
Key Insights
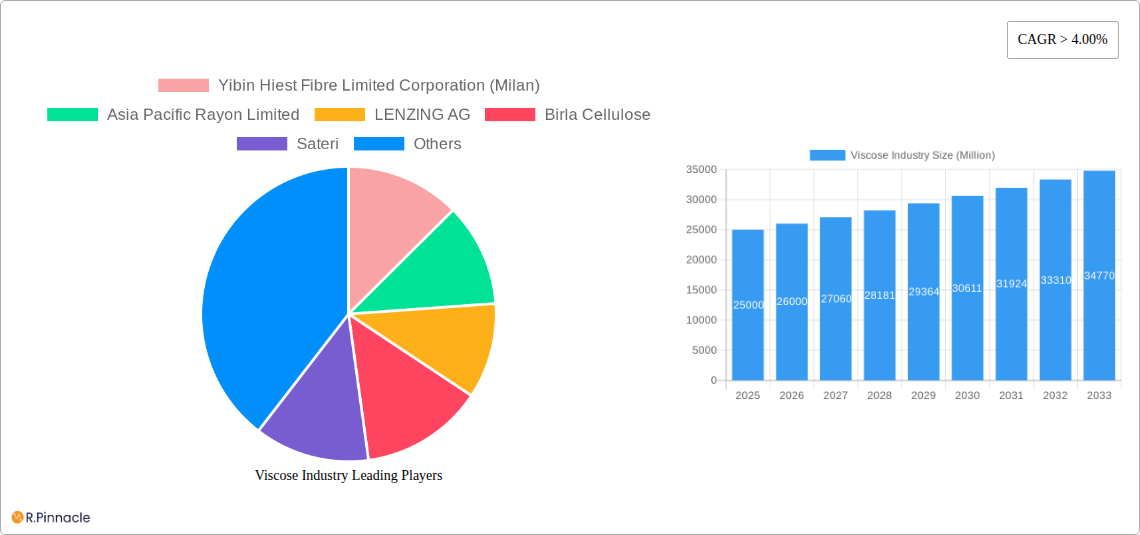
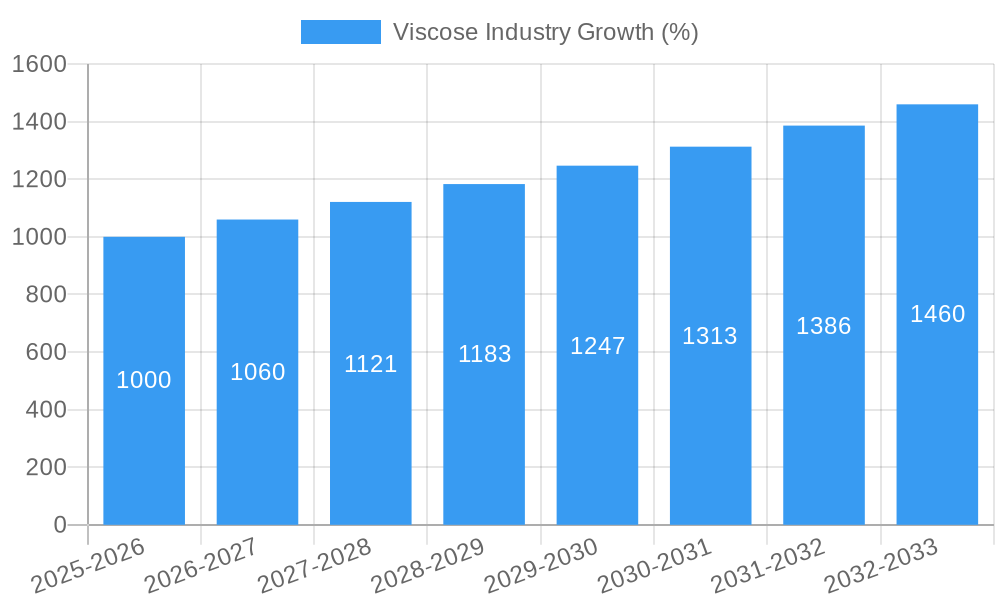
The global viscose industry is experiencing robust growth, projected to maintain a Compound Annual Growth Rate (CAGR) exceeding 4.00% from 2025 to 2033. This expansion is driven by several key factors. Firstly, the increasing demand for sustainable and eco-friendly textiles is fueling the adoption of viscose, a cellulose-based fiber, as a more responsible alternative to traditional petroleum-based materials. The growing apparel and textile industries, particularly in rapidly developing economies like those in Asia-Pacific, are significant contributors to this demand. Furthermore, advancements in viscose production technologies are leading to improved fiber quality and reduced environmental impact, further enhancing market appeal. The segmentation within the viscose market reflects diverse applications, with woven textiles (textile and apparel) currently dominating, followed by non-woven and specialty applications. This suggests significant opportunities for growth in non-woven applications, driven by their use in hygiene products, filtration, and other industrial segments. Competition among major players like Yibin Hiest Fibre Limited Corporation, Asia Pacific Rayon Limited, and LENZING AG is intense, driving innovation and price competitiveness. While challenges remain – such as fluctuations in raw material prices and environmental concerns around viscose production – the overall market trajectory suggests a continued upward trend over the forecast period.
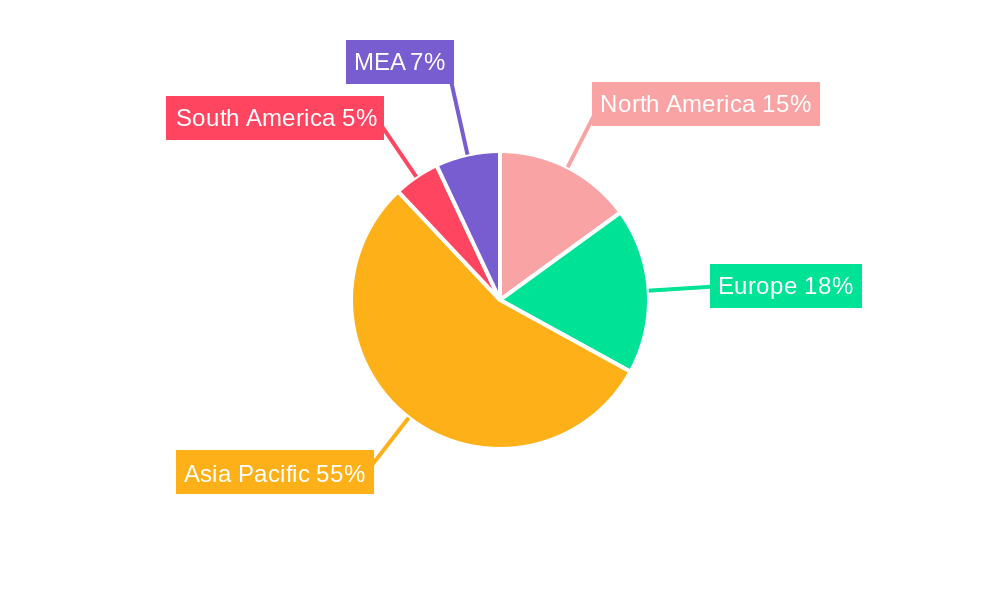
The regional distribution of the viscose market shows significant concentration in the Asia-Pacific region, driven by large-scale production and strong domestic demand in countries like China and India. North America and Europe also represent substantial markets, characterized by higher demand for high-quality viscose products and a focus on sustainability. Growth in other regions, such as South America and the Middle East & Africa, is expected to be slower, though consistent, mirroring the overall economic development and industrial expansion in these areas. The ongoing efforts to improve the environmental sustainability of viscose production are crucial for long-term growth, requiring collaborative efforts from industry players, governments, and environmental organizations. Focus on reducing water consumption, minimizing waste, and promoting responsible sourcing of raw materials will be key to sustaining the industry's positive momentum. Ultimately, the future of the viscose industry hinges on its ability to balance the needs of a growing global market with the demands for environmental responsibility and sustainable production practices.
Viscose Industry Market Report: 2019-2033
This comprehensive report provides an in-depth analysis of the global viscose industry, offering valuable insights for industry professionals, investors, and strategic decision-makers. The study period covers 2019-2033, with a base year of 2025 and a forecast period of 2025-2033. This report leverages extensive market research and data analysis to deliver actionable intelligence on market dynamics, growth drivers, and competitive landscapes. Expect detailed segmentation analysis, including application (Woven [Textile and Apparel], Non-woven, and Specialty), regional breakdowns, and key player profiles. The report also covers significant industry developments and future outlook projections. Millions are used for all values.
Viscose Industry Market Structure & Innovation Trends
This section analyzes the market concentration, highlighting the market share of key players like LENZING AG, Birla Cellulose, and Sateri. We examine innovation drivers, including the increasing demand for sustainable and eco-friendly viscose fabrics, and regulatory frameworks impacting production and consumption. The impact of product substitutes, such as other synthetic and natural fibers, is also explored. End-user demographics are analyzed to understand the changing demands within the textile and apparel, non-woven, and specialty segments. Finally, this section details significant mergers and acquisitions (M&A) activities within the industry, including deal values (where available) and their impact on market consolidation. For example, the xx Million deal between [Company A] and [Company B] significantly altered the market share dynamics in [Region].
- Market Concentration: Highly concentrated, with top 5 players holding approximately xx% market share in 2024.
- Innovation Drivers: Sustainability concerns, technological advancements in fiber production, and increasing demand for high-performance fabrics.
- Regulatory Frameworks: Growing emphasis on environmental regulations, impacting production processes and material sourcing.
- Product Substitutes: Competition from other natural and synthetic fibers, including polyester and cotton.
- M&A Activity: xx major M&A deals valued at approximately xx Million in the last 5 years, leading to increased consolidation.
Viscose Industry Market Dynamics & Trends
This section delves into the key market dynamics, examining the Compound Annual Growth Rate (CAGR) and market penetration rates across different segments. We analyze market growth drivers, such as increasing global textile production, rising disposable incomes in emerging economies, and growing demand for comfortable and sustainable clothing. Technological disruptions, including advancements in fiber production processes and the development of innovative viscose-based products, are discussed. Consumer preferences are explored, with a focus on the growing preference for sustainable and eco-friendly products. The competitive dynamics are analyzed, highlighting the strategies employed by leading companies to gain a competitive edge. The report also examines the impact of macroeconomic factors, such as fluctuations in raw material prices and global economic growth, on the viscose market. The projected CAGR for the forecast period (2025-2033) is estimated to be xx%. Market penetration in key regions, particularly [Region], is expected to reach xx% by 2033.
Dominant Regions & Segments in Viscose Industry
This section identifies the leading region and segment within the viscose industry. [Region] is projected to maintain its dominance during the forecast period, driven by factors such as robust economic growth, supportive government policies, and a well-established textile industry. The Woven (Textile and Apparel) segment is expected to retain the largest market share, attributed to its extensive use in clothing manufacturing.
- Key Drivers for [Region]:
- Strong economic growth and rising disposable incomes.
- Government incentives promoting textile and apparel manufacturing.
- Well-developed infrastructure and skilled workforce.
- Key Drivers for Woven (Textile and Apparel) Segment:
- High demand for clothing and apparel.
- Versatility and adaptability of viscose fabrics.
- Wide range of applications across various clothing styles.
Viscose Industry Product Innovations
Recent innovations in viscose fiber production have focused on enhancing sustainability and performance characteristics. Companies like Sateri have introduced carbon-neutral products like EcoCosy and FINEX, which incorporate recycled materials, showcasing a trend towards circular economy practices. These innovations cater to the growing consumer preference for eco-friendly and ethically sourced products. The development of new viscose blends, such as those incorporating spandex for improved elasticity, further broadens the applications and market reach of viscose fabrics.
Report Scope & Segmentation Analysis
This report segments the viscose market by application: Woven (Textile and Apparel), Non-woven, and Specialty. The Woven segment is expected to witness significant growth driven by the flourishing textile and apparel industry. The Non-woven segment is projected to experience moderate growth, primarily fueled by the expanding hygiene and medical sectors. The Specialty segment, encompassing high-performance and niche applications, is poised for growth due to rising demand in various specialized industries. Market size and growth projections are provided for each segment, along with analysis of competitive landscapes.
Key Drivers of Viscose Industry Growth
The viscose industry's growth is propelled by several factors. The burgeoning global textile and apparel industry creates substantial demand. Technological advancements in fiber production lead to improved quality, sustainability, and cost efficiency. Furthermore, supportive government policies in key regions incentivize investment and production. The rising consumer preference for comfortable and sustainable clothing further fuels market expansion.
Challenges in the Viscose Industry Sector
The viscose industry faces significant challenges, including fluctuating raw material prices, environmental concerns associated with viscose production, and intense competition from other fibers. Stringent environmental regulations in certain regions impose production constraints and increase costs. Supply chain disruptions can significantly impact production and profitability.
Emerging Opportunities in Viscose Industry
Emerging opportunities lie in the development of advanced sustainable viscose fibers, catering to the growing demand for eco-friendly products. Innovation in fiber production processes aimed at reduced environmental impact presents significant potential. Expanding into new applications, such as specialized textiles for medical and industrial uses, also presents lucrative opportunities.
Leading Players in the Viscose Industry Market
- LENZING AG
- Birla Cellulose
- Sateri
- Kelheim Fibres GmbH
- Yibin Hiest Fibre Limited Corporation (Milan)
- Asia Pacific Rayon Limited
- Nanjing Chemical Fibre Co Ltd
- Glanzstoff
- Tangshan Sanyou Group Xingda Chemical Fibre Co Ltd
- SNIACE Group
- Xinjiang Zhongtoi Chemical Co Ltd
- Jilin Chemical Fiber Group Co Ltd
Key Developments in Viscose Industry
- July 2022: Sateri launched EcoCosy, Lyocell, and FINEX, three carbon-neutral fiber products. FINEX, a flagship recycled fiber, contains up to 20% recycled material, significantly reducing carbon emissions compared to conventional viscose.
- October 2022: Birla Cellulose and Gerber Childrenswear LLC partnered to introduce a new line of baby and toddler clothing using a sustainably produced viscose fabric (95% viscose, 5% spandex) derived from eucalyptus trees. This highlights the increasing use of sustainable viscose in high-profile brands.
Future Outlook for Viscose Industry Market
The viscose industry is poised for continued growth, driven by increasing demand from the textile and apparel industry, coupled with the rising adoption of sustainable practices. Technological advancements, particularly in eco-friendly fiber production, will further propel market expansion. Strategic partnerships and collaborations between fiber producers and brands will play a crucial role in shaping the industry's future trajectory. The focus on sustainability and circular economy principles will be key to long-term success.
Viscose Industry Segmentation
-
1. Application
- 1.1. Woven (Textile and Apparel)
-
1.2. Non-woven and Specialty
- 1.2.1. Healthcare
- 1.2.2. Automotive
- 1.2.3. Other Applications
Viscose Industry Segmentation By Geography
-
1. Asia Pacific
- 1.1. China
- 1.2. India
- 1.3. Japan
- 1.4. South Korea
- 1.5. Rest of Asia Pacific
-
2. North America
- 2.1. United States
- 2.2. Canada
- 2.3. Mexico
-
3. Europe
- 3.1. Germany
- 3.2. United Kingdom
- 3.3. Italy
- 3.4. France
- 3.5. Rest of Europe
-
4. South America
- 4.1. Brazil
- 4.2. Argentina
- 4.3. Rest of South America
-
5. Middle East & Africa
- 5.1. UAE
- 5.2. Saudi Arabia
- 5.3. South Africa
- 5.4. Rest of Middle East & Africa
Viscose Industry REPORT HIGHLIGHTS
| Aspects | Details |
|---|---|
| Study Period | 2019-2033 |
| Base Year | 2024 |
| Estimated Year | 2025 |
| Forecast Period | 2025-2033 |
| Historical Period | 2019-2024 |
| Growth Rate | CAGR of > 4.00% from 2019-2033 |
| Segmentation |
|
Table of Contents
- 1. Introduction
- 1.1. Research Scope
- 1.2. Market Segmentation
- 1.3. Research Methodology
- 1.4. Definitions and Assumptions
- 2. Executive Summary
- 2.1. Introduction
- 3. Market Dynamics
- 3.1. Introduction
- 3.2. Market Drivers
- 3.2.1 Growing Demand for Apparels and Clothing; Increased Adoption of Viscose Fabrics
- 3.2.2 due to Ambiguity in Cotton Prices
- 3.3. Market Restrains
- 3.3.1 Competition from Synthetic Fibers; Unfavorable Conditions Arising due to the Impact of COVID-19
- 3.3.2 Especially in End-user Industries like Automotive and Others
- 3.4. Market Trends
- 3.4.1. Increasing Demand for Woven Fibers
- 4. Market Factor Analysis
- 4.1. Porters Five Forces
- 4.2. Supply/Value Chain
- 4.3. PESTEL analysis
- 4.4. Market Entropy
- 4.5. Patent/Trademark Analysis
- 5. Global Viscose Industry Analysis, Insights and Forecast, 2019-2031
- 5.1. Market Analysis, Insights and Forecast - by Application
- 5.1.1. Woven (Textile and Apparel)
- 5.1.2. Non-woven and Specialty
- 5.1.2.1. Healthcare
- 5.1.2.2. Automotive
- 5.1.2.3. Other Applications
- 5.2. Market Analysis, Insights and Forecast - by Region
- 5.2.1. Asia Pacific
- 5.2.2. North America
- 5.2.3. Europe
- 5.2.4. South America
- 5.2.5. Middle East & Africa
- 5.1. Market Analysis, Insights and Forecast - by Application
- 6. Asia Pacific Viscose Industry Analysis, Insights and Forecast, 2019-2031
- 6.1. Market Analysis, Insights and Forecast - by Application
- 6.1.1. Woven (Textile and Apparel)
- 6.1.2. Non-woven and Specialty
- 6.1.2.1. Healthcare
- 6.1.2.2. Automotive
- 6.1.2.3. Other Applications
- 6.1. Market Analysis, Insights and Forecast - by Application
- 7. North America Viscose Industry Analysis, Insights and Forecast, 2019-2031
- 7.1. Market Analysis, Insights and Forecast - by Application
- 7.1.1. Woven (Textile and Apparel)
- 7.1.2. Non-woven and Specialty
- 7.1.2.1. Healthcare
- 7.1.2.2. Automotive
- 7.1.2.3. Other Applications
- 7.1. Market Analysis, Insights and Forecast - by Application
- 8. Europe Viscose Industry Analysis, Insights and Forecast, 2019-2031
- 8.1. Market Analysis, Insights and Forecast - by Application
- 8.1.1. Woven (Textile and Apparel)
- 8.1.2. Non-woven and Specialty
- 8.1.2.1. Healthcare
- 8.1.2.2. Automotive
- 8.1.2.3. Other Applications
- 8.1. Market Analysis, Insights and Forecast - by Application
- 9. South America Viscose Industry Analysis, Insights and Forecast, 2019-2031
- 9.1. Market Analysis, Insights and Forecast - by Application
- 9.1.1. Woven (Textile and Apparel)
- 9.1.2. Non-woven and Specialty
- 9.1.2.1. Healthcare
- 9.1.2.2. Automotive
- 9.1.2.3. Other Applications
- 9.1. Market Analysis, Insights and Forecast - by Application
- 10. Middle East & Africa Viscose Industry Analysis, Insights and Forecast, 2019-2031
- 10.1. Market Analysis, Insights and Forecast - by Application
- 10.1.1. Woven (Textile and Apparel)
- 10.1.2. Non-woven and Specialty
- 10.1.2.1. Healthcare
- 10.1.2.2. Automotive
- 10.1.2.3. Other Applications
- 10.1. Market Analysis, Insights and Forecast - by Application
- 11. North America Viscose Industry Analysis, Insights and Forecast, 2019-2031
- 11.1. Market Analysis, Insights and Forecast - By Country/Sub-region
- 11.1.1 United States
- 11.1.2 Canada
- 11.1.3 Mexico
- 12. Europe Viscose Industry Analysis, Insights and Forecast, 2019-2031
- 12.1. Market Analysis, Insights and Forecast - By Country/Sub-region
- 12.1.1 Germany
- 12.1.2 United Kingdom
- 12.1.3 France
- 12.1.4 Spain
- 12.1.5 Italy
- 12.1.6 Spain
- 12.1.7 Belgium
- 12.1.8 Netherland
- 12.1.9 Nordics
- 12.1.10 Rest of Europe
- 13. Asia Pacific Viscose Industry Analysis, Insights and Forecast, 2019-2031
- 13.1. Market Analysis, Insights and Forecast - By Country/Sub-region
- 13.1.1 China
- 13.1.2 Japan
- 13.1.3 India
- 13.1.4 South Korea
- 13.1.5 Southeast Asia
- 13.1.6 Australia
- 13.1.7 Indonesia
- 13.1.8 Phillipes
- 13.1.9 Singapore
- 13.1.10 Thailandc
- 13.1.11 Rest of Asia Pacific
- 14. South America Viscose Industry Analysis, Insights and Forecast, 2019-2031
- 14.1. Market Analysis, Insights and Forecast - By Country/Sub-region
- 14.1.1 Brazil
- 14.1.2 Argentina
- 14.1.3 Peru
- 14.1.4 Chile
- 14.1.5 Colombia
- 14.1.6 Ecuador
- 14.1.7 Venezuela
- 14.1.8 Rest of South America
- 15. North America Viscose Industry Analysis, Insights and Forecast, 2019-2031
- 15.1. Market Analysis, Insights and Forecast - By Country/Sub-region
- 15.1.1 United States
- 15.1.2 Canada
- 15.1.3 Mexico
- 16. MEA Viscose Industry Analysis, Insights and Forecast, 2019-2031
- 16.1. Market Analysis, Insights and Forecast - By Country/Sub-region
- 16.1.1 United Arab Emirates
- 16.1.2 Saudi Arabia
- 16.1.3 South Africa
- 16.1.4 Rest of Middle East and Africa
- 17. Competitive Analysis
- 17.1. Global Market Share Analysis 2024
- 17.2. Company Profiles
- 17.2.1 Yibin Hiest Fibre Limited Corporation (Milan)
- 17.2.1.1. Overview
- 17.2.1.2. Products
- 17.2.1.3. SWOT Analysis
- 17.2.1.4. Recent Developments
- 17.2.1.5. Financials (Based on Availability)
- 17.2.2 Asia Pacific Rayon Limited
- 17.2.2.1. Overview
- 17.2.2.2. Products
- 17.2.2.3. SWOT Analysis
- 17.2.2.4. Recent Developments
- 17.2.2.5. Financials (Based on Availability)
- 17.2.3 LENZING AG
- 17.2.3.1. Overview
- 17.2.3.2. Products
- 17.2.3.3. SWOT Analysis
- 17.2.3.4. Recent Developments
- 17.2.3.5. Financials (Based on Availability)
- 17.2.4 Birla Cellulose
- 17.2.4.1. Overview
- 17.2.4.2. Products
- 17.2.4.3. SWOT Analysis
- 17.2.4.4. Recent Developments
- 17.2.4.5. Financials (Based on Availability)
- 17.2.5 Sateri
- 17.2.5.1. Overview
- 17.2.5.2. Products
- 17.2.5.3. SWOT Analysis
- 17.2.5.4. Recent Developments
- 17.2.5.5. Financials (Based on Availability)
- 17.2.6 Kelheim Fibres GmbH
- 17.2.6.1. Overview
- 17.2.6.2. Products
- 17.2.6.3. SWOT Analysis
- 17.2.6.4. Recent Developments
- 17.2.6.5. Financials (Based on Availability)
- 17.2.7 Nanjing Chemical Fibre Co Ltd
- 17.2.7.1. Overview
- 17.2.7.2. Products
- 17.2.7.3. SWOT Analysis
- 17.2.7.4. Recent Developments
- 17.2.7.5. Financials (Based on Availability)
- 17.2.8 Glanzstoff
- 17.2.8.1. Overview
- 17.2.8.2. Products
- 17.2.8.3. SWOT Analysis
- 17.2.8.4. Recent Developments
- 17.2.8.5. Financials (Based on Availability)
- 17.2.9 Tangshan Sanyou Group Xingda Chemical Fibre Co Ltd
- 17.2.9.1. Overview
- 17.2.9.2. Products
- 17.2.9.3. SWOT Analysis
- 17.2.9.4. Recent Developments
- 17.2.9.5. Financials (Based on Availability)
- 17.2.10 SNIACE Group
- 17.2.10.1. Overview
- 17.2.10.2. Products
- 17.2.10.3. SWOT Analysis
- 17.2.10.4. Recent Developments
- 17.2.10.5. Financials (Based on Availability)
- 17.2.11 Xinjiang Zhongtoi Chemical Co Ltd
- 17.2.11.1. Overview
- 17.2.11.2. Products
- 17.2.11.3. SWOT Analysis
- 17.2.11.4. Recent Developments
- 17.2.11.5. Financials (Based on Availability)
- 17.2.12 Jilin Chemical Fiber Group Co Ltd
- 17.2.12.1. Overview
- 17.2.12.2. Products
- 17.2.12.3. SWOT Analysis
- 17.2.12.4. Recent Developments
- 17.2.12.5. Financials (Based on Availability)
- 17.2.1 Yibin Hiest Fibre Limited Corporation (Milan)
List of Figures
- Figure 1: Global Viscose Industry Revenue Breakdown (Million, %) by Region 2024 & 2032
- Figure 2: Global Viscose Industry Volume Breakdown (K Tons, %) by Region 2024 & 2032
- Figure 3: North America Viscose Industry Revenue (Million), by Country 2024 & 2032
- Figure 4: North America Viscose Industry Volume (K Tons), by Country 2024 & 2032
- Figure 5: North America Viscose Industry Revenue Share (%), by Country 2024 & 2032
- Figure 6: North America Viscose Industry Volume Share (%), by Country 2024 & 2032
- Figure 7: Europe Viscose Industry Revenue (Million), by Country 2024 & 2032
- Figure 8: Europe Viscose Industry Volume (K Tons), by Country 2024 & 2032
- Figure 9: Europe Viscose Industry Revenue Share (%), by Country 2024 & 2032
- Figure 10: Europe Viscose Industry Volume Share (%), by Country 2024 & 2032
- Figure 11: Asia Pacific Viscose Industry Revenue (Million), by Country 2024 & 2032
- Figure 12: Asia Pacific Viscose Industry Volume (K Tons), by Country 2024 & 2032
- Figure 13: Asia Pacific Viscose Industry Revenue Share (%), by Country 2024 & 2032
- Figure 14: Asia Pacific Viscose Industry Volume Share (%), by Country 2024 & 2032
- Figure 15: South America Viscose Industry Revenue (Million), by Country 2024 & 2032
- Figure 16: South America Viscose Industry Volume (K Tons), by Country 2024 & 2032
- Figure 17: South America Viscose Industry Revenue Share (%), by Country 2024 & 2032
- Figure 18: South America Viscose Industry Volume Share (%), by Country 2024 & 2032
- Figure 19: North America Viscose Industry Revenue (Million), by Country 2024 & 2032
- Figure 20: North America Viscose Industry Volume (K Tons), by Country 2024 & 2032
- Figure 21: North America Viscose Industry Revenue Share (%), by Country 2024 & 2032
- Figure 22: North America Viscose Industry Volume Share (%), by Country 2024 & 2032
- Figure 23: MEA Viscose Industry Revenue (Million), by Country 2024 & 2032
- Figure 24: MEA Viscose Industry Volume (K Tons), by Country 2024 & 2032
- Figure 25: MEA Viscose Industry Revenue Share (%), by Country 2024 & 2032
- Figure 26: MEA Viscose Industry Volume Share (%), by Country 2024 & 2032
- Figure 27: Asia Pacific Viscose Industry Revenue (Million), by Application 2024 & 2032
- Figure 28: Asia Pacific Viscose Industry Volume (K Tons), by Application 2024 & 2032
- Figure 29: Asia Pacific Viscose Industry Revenue Share (%), by Application 2024 & 2032
- Figure 30: Asia Pacific Viscose Industry Volume Share (%), by Application 2024 & 2032
- Figure 31: Asia Pacific Viscose Industry Revenue (Million), by Country 2024 & 2032
- Figure 32: Asia Pacific Viscose Industry Volume (K Tons), by Country 2024 & 2032
- Figure 33: Asia Pacific Viscose Industry Revenue Share (%), by Country 2024 & 2032
- Figure 34: Asia Pacific Viscose Industry Volume Share (%), by Country 2024 & 2032
- Figure 35: North America Viscose Industry Revenue (Million), by Application 2024 & 2032
- Figure 36: North America Viscose Industry Volume (K Tons), by Application 2024 & 2032
- Figure 37: North America Viscose Industry Revenue Share (%), by Application 2024 & 2032
- Figure 38: North America Viscose Industry Volume Share (%), by Application 2024 & 2032
- Figure 39: North America Viscose Industry Revenue (Million), by Country 2024 & 2032
- Figure 40: North America Viscose Industry Volume (K Tons), by Country 2024 & 2032
- Figure 41: North America Viscose Industry Revenue Share (%), by Country 2024 & 2032
- Figure 42: North America Viscose Industry Volume Share (%), by Country 2024 & 2032
- Figure 43: Europe Viscose Industry Revenue (Million), by Application 2024 & 2032
- Figure 44: Europe Viscose Industry Volume (K Tons), by Application 2024 & 2032
- Figure 45: Europe Viscose Industry Revenue Share (%), by Application 2024 & 2032
- Figure 46: Europe Viscose Industry Volume Share (%), by Application 2024 & 2032
- Figure 47: Europe Viscose Industry Revenue (Million), by Country 2024 & 2032
- Figure 48: Europe Viscose Industry Volume (K Tons), by Country 2024 & 2032
- Figure 49: Europe Viscose Industry Revenue Share (%), by Country 2024 & 2032
- Figure 50: Europe Viscose Industry Volume Share (%), by Country 2024 & 2032
- Figure 51: South America Viscose Industry Revenue (Million), by Application 2024 & 2032
- Figure 52: South America Viscose Industry Volume (K Tons), by Application 2024 & 2032
- Figure 53: South America Viscose Industry Revenue Share (%), by Application 2024 & 2032
- Figure 54: South America Viscose Industry Volume Share (%), by Application 2024 & 2032
- Figure 55: South America Viscose Industry Revenue (Million), by Country 2024 & 2032
- Figure 56: South America Viscose Industry Volume (K Tons), by Country 2024 & 2032
- Figure 57: South America Viscose Industry Revenue Share (%), by Country 2024 & 2032
- Figure 58: South America Viscose Industry Volume Share (%), by Country 2024 & 2032
- Figure 59: Middle East & Africa Viscose Industry Revenue (Million), by Application 2024 & 2032
- Figure 60: Middle East & Africa Viscose Industry Volume (K Tons), by Application 2024 & 2032
- Figure 61: Middle East & Africa Viscose Industry Revenue Share (%), by Application 2024 & 2032
- Figure 62: Middle East & Africa Viscose Industry Volume Share (%), by Application 2024 & 2032
- Figure 63: Middle East & Africa Viscose Industry Revenue (Million), by Country 2024 & 2032
- Figure 64: Middle East & Africa Viscose Industry Volume (K Tons), by Country 2024 & 2032
- Figure 65: Middle East & Africa Viscose Industry Revenue Share (%), by Country 2024 & 2032
- Figure 66: Middle East & Africa Viscose Industry Volume Share (%), by Country 2024 & 2032
List of Tables
- Table 1: Global Viscose Industry Revenue Million Forecast, by Region 2019 & 2032
- Table 2: Global Viscose Industry Volume K Tons Forecast, by Region 2019 & 2032
- Table 3: Global Viscose Industry Revenue Million Forecast, by Application 2019 & 2032
- Table 4: Global Viscose Industry Volume K Tons Forecast, by Application 2019 & 2032
- Table 5: Global Viscose Industry Revenue Million Forecast, by Region 2019 & 2032
- Table 6: Global Viscose Industry Volume K Tons Forecast, by Region 2019 & 2032
- Table 7: Global Viscose Industry Revenue Million Forecast, by Country 2019 & 2032
- Table 8: Global Viscose Industry Volume K Tons Forecast, by Country 2019 & 2032
- Table 9: United States Viscose Industry Revenue (Million) Forecast, by Application 2019 & 2032
- Table 10: United States Viscose Industry Volume (K Tons) Forecast, by Application 2019 & 2032
- Table 11: Canada Viscose Industry Revenue (Million) Forecast, by Application 2019 & 2032
- Table 12: Canada Viscose Industry Volume (K Tons) Forecast, by Application 2019 & 2032
- Table 13: Mexico Viscose Industry Revenue (Million) Forecast, by Application 2019 & 2032
- Table 14: Mexico Viscose Industry Volume (K Tons) Forecast, by Application 2019 & 2032
- Table 15: Global Viscose Industry Revenue Million Forecast, by Country 2019 & 2032
- Table 16: Global Viscose Industry Volume K Tons Forecast, by Country 2019 & 2032
- Table 17: Germany Viscose Industry Revenue (Million) Forecast, by Application 2019 & 2032
- Table 18: Germany Viscose Industry Volume (K Tons) Forecast, by Application 2019 & 2032
- Table 19: United Kingdom Viscose Industry Revenue (Million) Forecast, by Application 2019 & 2032
- Table 20: United Kingdom Viscose Industry Volume (K Tons) Forecast, by Application 2019 & 2032
- Table 21: France Viscose Industry Revenue (Million) Forecast, by Application 2019 & 2032
- Table 22: France Viscose Industry Volume (K Tons) Forecast, by Application 2019 & 2032
- Table 23: Spain Viscose Industry Revenue (Million) Forecast, by Application 2019 & 2032
- Table 24: Spain Viscose Industry Volume (K Tons) Forecast, by Application 2019 & 2032
- Table 25: Italy Viscose Industry Revenue (Million) Forecast, by Application 2019 & 2032
- Table 26: Italy Viscose Industry Volume (K Tons) Forecast, by Application 2019 & 2032
- Table 27: Spain Viscose Industry Revenue (Million) Forecast, by Application 2019 & 2032
- Table 28: Spain Viscose Industry Volume (K Tons) Forecast, by Application 2019 & 2032
- Table 29: Belgium Viscose Industry Revenue (Million) Forecast, by Application 2019 & 2032
- Table 30: Belgium Viscose Industry Volume (K Tons) Forecast, by Application 2019 & 2032
- Table 31: Netherland Viscose Industry Revenue (Million) Forecast, by Application 2019 & 2032
- Table 32: Netherland Viscose Industry Volume (K Tons) Forecast, by Application 2019 & 2032
- Table 33: Nordics Viscose Industry Revenue (Million) Forecast, by Application 2019 & 2032
- Table 34: Nordics Viscose Industry Volume (K Tons) Forecast, by Application 2019 & 2032
- Table 35: Rest of Europe Viscose Industry Revenue (Million) Forecast, by Application 2019 & 2032
- Table 36: Rest of Europe Viscose Industry Volume (K Tons) Forecast, by Application 2019 & 2032
- Table 37: Global Viscose Industry Revenue Million Forecast, by Country 2019 & 2032
- Table 38: Global Viscose Industry Volume K Tons Forecast, by Country 2019 & 2032
- Table 39: China Viscose Industry Revenue (Million) Forecast, by Application 2019 & 2032
- Table 40: China Viscose Industry Volume (K Tons) Forecast, by Application 2019 & 2032
- Table 41: Japan Viscose Industry Revenue (Million) Forecast, by Application 2019 & 2032
- Table 42: Japan Viscose Industry Volume (K Tons) Forecast, by Application 2019 & 2032
- Table 43: India Viscose Industry Revenue (Million) Forecast, by Application 2019 & 2032
- Table 44: India Viscose Industry Volume (K Tons) Forecast, by Application 2019 & 2032
- Table 45: South Korea Viscose Industry Revenue (Million) Forecast, by Application 2019 & 2032
- Table 46: South Korea Viscose Industry Volume (K Tons) Forecast, by Application 2019 & 2032
- Table 47: Southeast Asia Viscose Industry Revenue (Million) Forecast, by Application 2019 & 2032
- Table 48: Southeast Asia Viscose Industry Volume (K Tons) Forecast, by Application 2019 & 2032
- Table 49: Australia Viscose Industry Revenue (Million) Forecast, by Application 2019 & 2032
- Table 50: Australia Viscose Industry Volume (K Tons) Forecast, by Application 2019 & 2032
- Table 51: Indonesia Viscose Industry Revenue (Million) Forecast, by Application 2019 & 2032
- Table 52: Indonesia Viscose Industry Volume (K Tons) Forecast, by Application 2019 & 2032
- Table 53: Phillipes Viscose Industry Revenue (Million) Forecast, by Application 2019 & 2032
- Table 54: Phillipes Viscose Industry Volume (K Tons) Forecast, by Application 2019 & 2032
- Table 55: Singapore Viscose Industry Revenue (Million) Forecast, by Application 2019 & 2032
- Table 56: Singapore Viscose Industry Volume (K Tons) Forecast, by Application 2019 & 2032
- Table 57: Thailandc Viscose Industry Revenue (Million) Forecast, by Application 2019 & 2032
- Table 58: Thailandc Viscose Industry Volume (K Tons) Forecast, by Application 2019 & 2032
- Table 59: Rest of Asia Pacific Viscose Industry Revenue (Million) Forecast, by Application 2019 & 2032
- Table 60: Rest of Asia Pacific Viscose Industry Volume (K Tons) Forecast, by Application 2019 & 2032
- Table 61: Global Viscose Industry Revenue Million Forecast, by Country 2019 & 2032
- Table 62: Global Viscose Industry Volume K Tons Forecast, by Country 2019 & 2032
- Table 63: Brazil Viscose Industry Revenue (Million) Forecast, by Application 2019 & 2032
- Table 64: Brazil Viscose Industry Volume (K Tons) Forecast, by Application 2019 & 2032
- Table 65: Argentina Viscose Industry Revenue (Million) Forecast, by Application 2019 & 2032
- Table 66: Argentina Viscose Industry Volume (K Tons) Forecast, by Application 2019 & 2032
- Table 67: Peru Viscose Industry Revenue (Million) Forecast, by Application 2019 & 2032
- Table 68: Peru Viscose Industry Volume (K Tons) Forecast, by Application 2019 & 2032
- Table 69: Chile Viscose Industry Revenue (Million) Forecast, by Application 2019 & 2032
- Table 70: Chile Viscose Industry Volume (K Tons) Forecast, by Application 2019 & 2032
- Table 71: Colombia Viscose Industry Revenue (Million) Forecast, by Application 2019 & 2032
- Table 72: Colombia Viscose Industry Volume (K Tons) Forecast, by Application 2019 & 2032
- Table 73: Ecuador Viscose Industry Revenue (Million) Forecast, by Application 2019 & 2032
- Table 74: Ecuador Viscose Industry Volume (K Tons) Forecast, by Application 2019 & 2032
- Table 75: Venezuela Viscose Industry Revenue (Million) Forecast, by Application 2019 & 2032
- Table 76: Venezuela Viscose Industry Volume (K Tons) Forecast, by Application 2019 & 2032
- Table 77: Rest of South America Viscose Industry Revenue (Million) Forecast, by Application 2019 & 2032
- Table 78: Rest of South America Viscose Industry Volume (K Tons) Forecast, by Application 2019 & 2032
- Table 79: Global Viscose Industry Revenue Million Forecast, by Country 2019 & 2032
- Table 80: Global Viscose Industry Volume K Tons Forecast, by Country 2019 & 2032
- Table 81: United States Viscose Industry Revenue (Million) Forecast, by Application 2019 & 2032
- Table 82: United States Viscose Industry Volume (K Tons) Forecast, by Application 2019 & 2032
- Table 83: Canada Viscose Industry Revenue (Million) Forecast, by Application 2019 & 2032
- Table 84: Canada Viscose Industry Volume (K Tons) Forecast, by Application 2019 & 2032
- Table 85: Mexico Viscose Industry Revenue (Million) Forecast, by Application 2019 & 2032
- Table 86: Mexico Viscose Industry Volume (K Tons) Forecast, by Application 2019 & 2032
- Table 87: Global Viscose Industry Revenue Million Forecast, by Country 2019 & 2032
- Table 88: Global Viscose Industry Volume K Tons Forecast, by Country 2019 & 2032
- Table 89: United Arab Emirates Viscose Industry Revenue (Million) Forecast, by Application 2019 & 2032
- Table 90: United Arab Emirates Viscose Industry Volume (K Tons) Forecast, by Application 2019 & 2032
- Table 91: Saudi Arabia Viscose Industry Revenue (Million) Forecast, by Application 2019 & 2032
- Table 92: Saudi Arabia Viscose Industry Volume (K Tons) Forecast, by Application 2019 & 2032
- Table 93: South Africa Viscose Industry Revenue (Million) Forecast, by Application 2019 & 2032
- Table 94: South Africa Viscose Industry Volume (K Tons) Forecast, by Application 2019 & 2032
- Table 95: Rest of Middle East and Africa Viscose Industry Revenue (Million) Forecast, by Application 2019 & 2032
- Table 96: Rest of Middle East and Africa Viscose Industry Volume (K Tons) Forecast, by Application 2019 & 2032
- Table 97: Global Viscose Industry Revenue Million Forecast, by Application 2019 & 2032
- Table 98: Global Viscose Industry Volume K Tons Forecast, by Application 2019 & 2032
- Table 99: Global Viscose Industry Revenue Million Forecast, by Country 2019 & 2032
- Table 100: Global Viscose Industry Volume K Tons Forecast, by Country 2019 & 2032
- Table 101: China Viscose Industry Revenue (Million) Forecast, by Application 2019 & 2032
- Table 102: China Viscose Industry Volume (K Tons) Forecast, by Application 2019 & 2032
- Table 103: India Viscose Industry Revenue (Million) Forecast, by Application 2019 & 2032
- Table 104: India Viscose Industry Volume (K Tons) Forecast, by Application 2019 & 2032
- Table 105: Japan Viscose Industry Revenue (Million) Forecast, by Application 2019 & 2032
- Table 106: Japan Viscose Industry Volume (K Tons) Forecast, by Application 2019 & 2032
- Table 107: South Korea Viscose Industry Revenue (Million) Forecast, by Application 2019 & 2032
- Table 108: South Korea Viscose Industry Volume (K Tons) Forecast, by Application 2019 & 2032
- Table 109: Rest of Asia Pacific Viscose Industry Revenue (Million) Forecast, by Application 2019 & 2032
- Table 110: Rest of Asia Pacific Viscose Industry Volume (K Tons) Forecast, by Application 2019 & 2032
- Table 111: Global Viscose Industry Revenue Million Forecast, by Application 2019 & 2032
- Table 112: Global Viscose Industry Volume K Tons Forecast, by Application 2019 & 2032
- Table 113: Global Viscose Industry Revenue Million Forecast, by Country 2019 & 2032
- Table 114: Global Viscose Industry Volume K Tons Forecast, by Country 2019 & 2032
- Table 115: United States Viscose Industry Revenue (Million) Forecast, by Application 2019 & 2032
- Table 116: United States Viscose Industry Volume (K Tons) Forecast, by Application 2019 & 2032
- Table 117: Canada Viscose Industry Revenue (Million) Forecast, by Application 2019 & 2032
- Table 118: Canada Viscose Industry Volume (K Tons) Forecast, by Application 2019 & 2032
- Table 119: Mexico Viscose Industry Revenue (Million) Forecast, by Application 2019 & 2032
- Table 120: Mexico Viscose Industry Volume (K Tons) Forecast, by Application 2019 & 2032
- Table 121: Global Viscose Industry Revenue Million Forecast, by Application 2019 & 2032
- Table 122: Global Viscose Industry Volume K Tons Forecast, by Application 2019 & 2032
- Table 123: Global Viscose Industry Revenue Million Forecast, by Country 2019 & 2032
- Table 124: Global Viscose Industry Volume K Tons Forecast, by Country 2019 & 2032
- Table 125: Germany Viscose Industry Revenue (Million) Forecast, by Application 2019 & 2032
- Table 126: Germany Viscose Industry Volume (K Tons) Forecast, by Application 2019 & 2032
- Table 127: United Kingdom Viscose Industry Revenue (Million) Forecast, by Application 2019 & 2032
- Table 128: United Kingdom Viscose Industry Volume (K Tons) Forecast, by Application 2019 & 2032
- Table 129: Italy Viscose Industry Revenue (Million) Forecast, by Application 2019 & 2032
- Table 130: Italy Viscose Industry Volume (K Tons) Forecast, by Application 2019 & 2032
- Table 131: France Viscose Industry Revenue (Million) Forecast, by Application 2019 & 2032
- Table 132: France Viscose Industry Volume (K Tons) Forecast, by Application 2019 & 2032
- Table 133: Rest of Europe Viscose Industry Revenue (Million) Forecast, by Application 2019 & 2032
- Table 134: Rest of Europe Viscose Industry Volume (K Tons) Forecast, by Application 2019 & 2032
- Table 135: Global Viscose Industry Revenue Million Forecast, by Application 2019 & 2032
- Table 136: Global Viscose Industry Volume K Tons Forecast, by Application 2019 & 2032
- Table 137: Global Viscose Industry Revenue Million Forecast, by Country 2019 & 2032
- Table 138: Global Viscose Industry Volume K Tons Forecast, by Country 2019 & 2032
- Table 139: Brazil Viscose Industry Revenue (Million) Forecast, by Application 2019 & 2032
- Table 140: Brazil Viscose Industry Volume (K Tons) Forecast, by Application 2019 & 2032
- Table 141: Argentina Viscose Industry Revenue (Million) Forecast, by Application 2019 & 2032
- Table 142: Argentina Viscose Industry Volume (K Tons) Forecast, by Application 2019 & 2032
- Table 143: Rest of South America Viscose Industry Revenue (Million) Forecast, by Application 2019 & 2032
- Table 144: Rest of South America Viscose Industry Volume (K Tons) Forecast, by Application 2019 & 2032
- Table 145: Global Viscose Industry Revenue Million Forecast, by Application 2019 & 2032
- Table 146: Global Viscose Industry Volume K Tons Forecast, by Application 2019 & 2032
- Table 147: Global Viscose Industry Revenue Million Forecast, by Country 2019 & 2032
- Table 148: Global Viscose Industry Volume K Tons Forecast, by Country 2019 & 2032
- Table 149: UAE Viscose Industry Revenue (Million) Forecast, by Application 2019 & 2032
- Table 150: UAE Viscose Industry Volume (K Tons) Forecast, by Application 2019 & 2032
- Table 151: Saudi Arabia Viscose Industry Revenue (Million) Forecast, by Application 2019 & 2032
- Table 152: Saudi Arabia Viscose Industry Volume (K Tons) Forecast, by Application 2019 & 2032
- Table 153: South Africa Viscose Industry Revenue (Million) Forecast, by Application 2019 & 2032
- Table 154: South Africa Viscose Industry Volume (K Tons) Forecast, by Application 2019 & 2032
- Table 155: Rest of Middle East & Africa Viscose Industry Revenue (Million) Forecast, by Application 2019 & 2032
- Table 156: Rest of Middle East & Africa Viscose Industry Volume (K Tons) Forecast, by Application 2019 & 2032
Frequently Asked Questions
1. What is the projected Compound Annual Growth Rate (CAGR) of the Viscose Industry?
The projected CAGR is approximately > 4.00%.
2. Which companies are prominent players in the Viscose Industry?
Key companies in the market include Yibin Hiest Fibre Limited Corporation (Milan), Asia Pacific Rayon Limited, LENZING AG, Birla Cellulose, Sateri, Kelheim Fibres GmbH, Nanjing Chemical Fibre Co Ltd, Glanzstoff, Tangshan Sanyou Group Xingda Chemical Fibre Co Ltd, SNIACE Group, Xinjiang Zhongtoi Chemical Co Ltd, Jilin Chemical Fiber Group Co Ltd.
3. What are the main segments of the Viscose Industry?
The market segments include Application.
4. Can you provide details about the market size?
The market size is estimated to be USD XX Million as of 2022.
5. What are some drivers contributing to market growth?
Growing Demand for Apparels and Clothing; Increased Adoption of Viscose Fabrics. due to Ambiguity in Cotton Prices.
6. What are the notable trends driving market growth?
Increasing Demand for Woven Fibers.
7. Are there any restraints impacting market growth?
Competition from Synthetic Fibers; Unfavorable Conditions Arising due to the Impact of COVID-19. Especially in End-user Industries like Automotive and Others.
8. Can you provide examples of recent developments in the market?
October 2022: Birla Cellulose and Gerber Childrenswear LLC introduced a new range of clothing for babies and toddlers by Gerber. The clothing brand features a collection of buttery-soft rompers, pajamas, dresses, and headbands manufactured with a more sustainably produced viscose fabric mainly derived from eucalyptus trees found in nature. The new fabric choice comprises 95% viscose and 5% spandex.
9. What pricing options are available for accessing the report?
Pricing options include single-user, multi-user, and enterprise licenses priced at USD 4750, USD 5250, and USD 8750 respectively.
10. Is the market size provided in terms of value or volume?
The market size is provided in terms of value, measured in Million and volume, measured in K Tons.
11. Are there any specific market keywords associated with the report?
Yes, the market keyword associated with the report is "Viscose Industry," which aids in identifying and referencing the specific market segment covered.
12. How do I determine which pricing option suits my needs best?
The pricing options vary based on user requirements and access needs. Individual users may opt for single-user licenses, while businesses requiring broader access may choose multi-user or enterprise licenses for cost-effective access to the report.
13. Are there any additional resources or data provided in the Viscose Industry report?
While the report offers comprehensive insights, it's advisable to review the specific contents or supplementary materials provided to ascertain if additional resources or data are available.
14. How can I stay updated on further developments or reports in the Viscose Industry?
To stay informed about further developments, trends, and reports in the Viscose Industry, consider subscribing to industry newsletters, following relevant companies and organizations, or regularly checking reputable industry news sources and publications.
Methodology
Step 1 - Identification of Relevant Samples Size from Population Database


Step 2 - Approaches for Defining Global Market Size (Value, Volume* & Price*)

Note*: In applicable scenarios
Step 3 - Data Sources
Primary Research
- Web Analytics
- Survey Reports
- Research Institute
- Latest Research Reports
- Opinion Leaders
Secondary Research
- Annual Reports
- White Paper
- Latest Press Release
- Industry Association
- Paid Database
- Investor Presentations

Step 4 - Data Triangulation
Involves using different sources of information in order to increase the validity of a study
These sources are likely to be stakeholders in a program - participants, other researchers, program staff, other community members, and so on.
Then we put all data in single framework & apply various statistical tools to find out the dynamic on the market.
During the analysis stage, feedback from the stakeholder groups would be compared to determine areas of agreement as well as areas of divergence


