
Key Insights
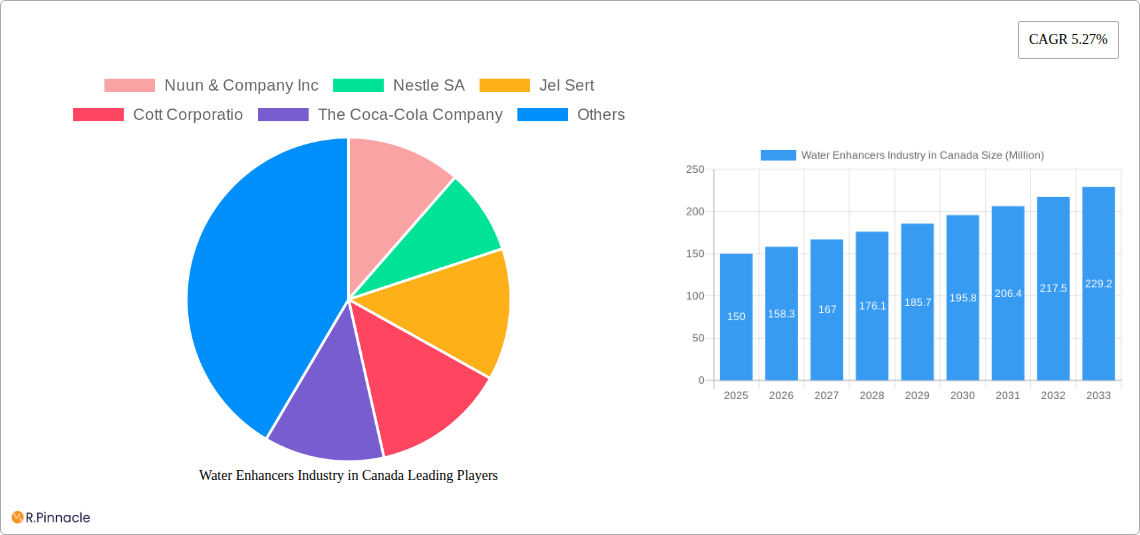
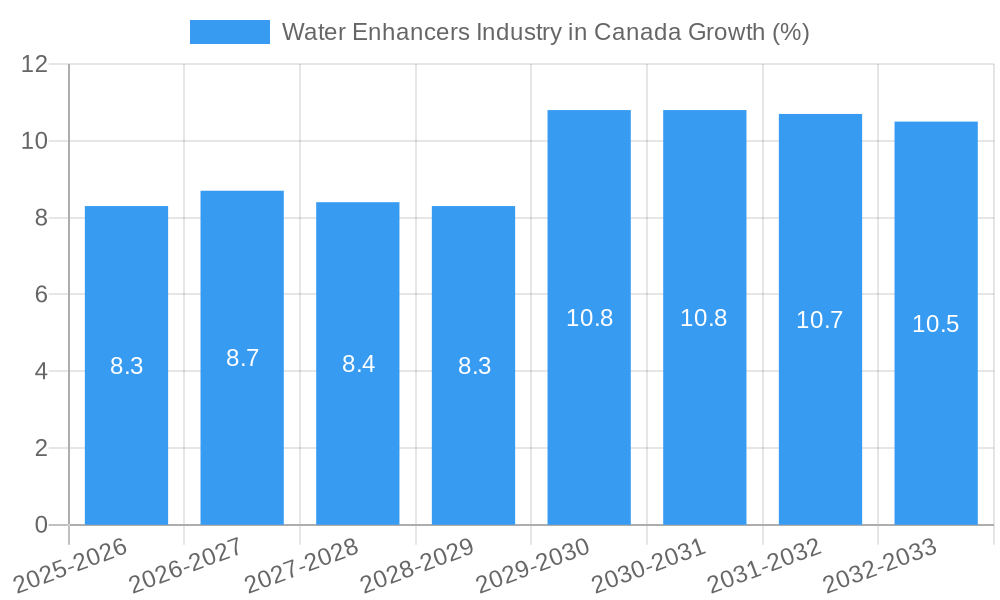
The Canadian water enhancer market, valued at approximately $150 million CAD in 2025, is poised for steady growth, projected to exhibit a Compound Annual Growth Rate (CAGR) of 5.27% from 2025 to 2033. This expansion is driven by several key factors. The increasing consumer awareness of health and wellness, coupled with a rising preference for healthier beverage alternatives, fuels demand for low-sugar, low-calorie options like water enhancers. Furthermore, the convenience factor offered by these products, allowing easy customization of water flavor profiles, is a significant driver. Growth is also spurred by innovative product launches, including functional water enhancers infused with vitamins, minerals, and electrolytes, catering to the growing demand for functional beverages. The market is segmented by distribution channels, with pharmacies and health stores, online channels, and supermarkets holding significant shares. Major players like Nuun & Company Inc., Nestle SA, and Coca-Cola Company compete fiercely, driving innovation and product differentiation. Regional variations in consumption patterns are observed, with urban centers and regions with higher health consciousness potentially exhibiting faster growth rates. While potential economic downturns could pose a minor restraint, the overall outlook for the Canadian water enhancer market remains positive, driven by sustained consumer interest in health-conscious beverages.
The projected growth trajectory suggests a market value exceeding $250 million CAD by 2033. This growth is expected to be influenced by evolving consumer preferences, with an anticipated shift towards more natural and sustainable ingredients. The emergence of premium and specialized water enhancers targeting specific health needs, like enhanced hydration during sports activities, is also anticipated to contribute to market expansion. Competitive dynamics will remain intense, with established players focusing on brand building and new product development to maintain their market share. The continued expansion of online retail channels and the growing integration of e-commerce platforms are also key factors contributing to the predicted growth of this market segment in Canada. This expansion will largely depend on sustained consumer interest in convenient and healthy beverage options.
Water Enhancers Industry in Canada: A Comprehensive Market Report (2019-2033)
This comprehensive report provides an in-depth analysis of the Canadian water enhancers market, offering invaluable insights for industry professionals, investors, and strategic decision-makers. The study covers the period from 2019 to 2033, with a focus on the base year 2025 and a forecast period spanning 2025-2033. The report utilizes rigorous research methodologies to deliver actionable intelligence and predict future market trends. Expect detailed analysis of market size, growth drivers, competitive landscape, and emerging opportunities, empowering you to make informed business strategies.
Water Enhancers Industry in Canada Market Structure & Innovation Trends
This section analyzes the Canadian water enhancers market structure, encompassing market concentration, innovation drivers, regulatory frameworks, product substitutes, end-user demographics, and mergers & acquisitions (M&A) activities. The market is characterized by a mix of large multinational players like Nestle SA, The Coca-Cola Company, and PepsiCo INC, alongside smaller, specialized brands such as Nuun & Company Inc and Wisdom Natural Brands. Market concentration is moderate, with the top five players holding an estimated xx% market share in 2025.
- Innovation Drivers: Growing consumer demand for healthier beverage options, increasing focus on functional benefits (e.g., electrolytes, vitamins), and ongoing product diversification drive innovation.
- Regulatory Framework: Health Canada regulations regarding food additives and labeling significantly influence product development and marketing strategies.
- Product Substitutes: Ready-to-drink infused waters, fruit juices, and sports drinks pose significant competitive pressure.
- End-User Demographics: The target demographic primarily comprises health-conscious individuals, athletes, and those seeking convenient hydration solutions. The market is expected to see growth among younger consumers as well.
- M&A Activities: The past five years have witnessed xx M&A deals, totaling an estimated value of $xx Million, indicating a consolidating market landscape. Strategic acquisitions enhance product portfolios and expand market reach.
Water Enhancers Industry in Canada Market Dynamics & Trends
The Canadian water enhancers market exhibits strong growth potential, driven by several key factors. The rising health consciousness amongst consumers continues to fuel demand for healthier alternatives to sugary drinks. Furthermore, the increasing popularity of active lifestyles and sports contributes to heightened demand for electrolyte-enhanced products. Technological advancements in flavor creation and packaging also influence market trends.
The market is expected to witness a CAGR of xx% during the forecast period (2025-2033), with market penetration expected to increase from xx% in 2025 to xx% by 2033. Competitive dynamics are shaped by both price competition and product differentiation, with companies focusing on unique flavor profiles, functional benefits, and sustainable packaging options.
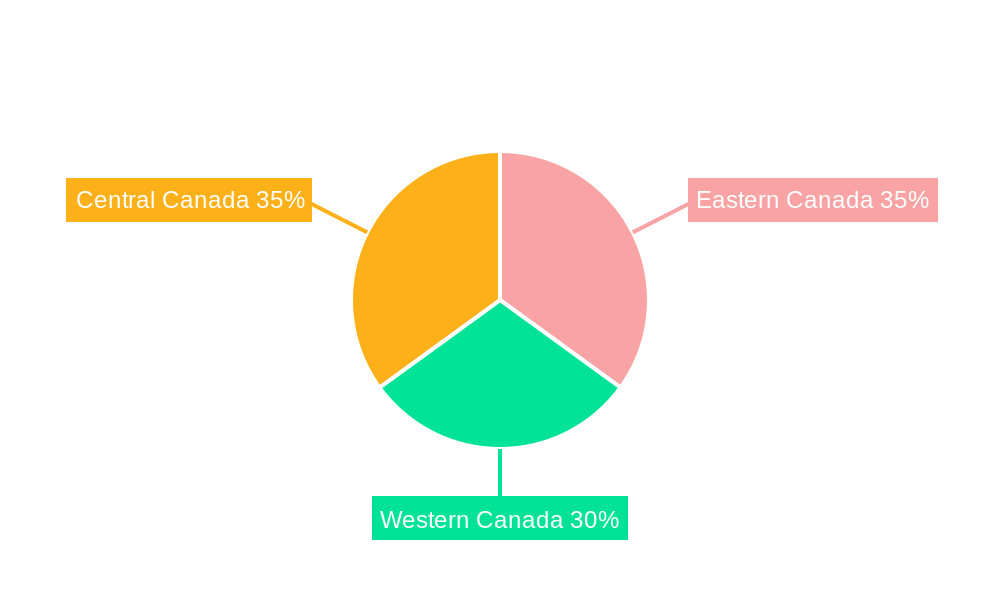
Dominant Regions & Segments in Water Enhancers Industry in Canada
While detailed regional breakdowns require further analysis, preliminary data suggests a relatively even distribution of sales across major Canadian provinces. However, certain distribution channels demonstrate clearer dominance:
- Hypermarkets/Supermarkets: This segment holds the largest market share, driven by high consumer foot traffic, extensive product placement opportunities, and strategic partnerships with major retailers like Loblaw Inc. Key growth drivers for this segment include the ongoing expansion of retail spaces and increased purchasing power.
- Convenience Stores: This segment shows significant growth potential, catering to on-the-go consumers. Increased convenience store density and growing consumer preference for immediate consumption contribute to segment growth.
- Pharmacies & Health Stores: This segment benefits from the increasing focus on health and wellness, attracting customers seeking natural and functional products. Growth is influenced by expansion of pharmacy chains and growing emphasis on natural product offerings.
- Online Channels: The online segment exhibits rising growth driven by e-commerce expansion and growing consumer adoption of online grocery shopping.
- Other distribution channels: This segment includes smaller retailers, direct-to-consumer sales, and food service outlets, contributing a smaller but noticeable percentage to the overall market share.
Water Enhancers Industry in Canada Product Innovations
Recent product innovations in the Canadian market focus on natural ingredients, unique flavor combinations, and functional benefits. The trend toward reduced sugar content and enhanced electrolyte formulations is prevalent. Companies are increasingly using innovative packaging to enhance shelf life and appeal to environmentally conscious consumers. This focus on innovation caters to evolving consumer preferences and strengthens competitive positioning.
Report Scope & Segmentation Analysis
This report segments the Canadian water enhancers market primarily by distribution channel: Pharmacies & Health Stores, Convenience Stores, Hypermarkets/Supermarkets, Online Channels, and Other distribution channels. Each segment's market size, growth projections, and competitive dynamics are analyzed in detail. Growth rates vary significantly across segments, with hypermarkets/supermarkets showing steady growth, while online channels are projected to experience the fastest expansion. Competitive dynamics within each segment are influenced by factors such as brand loyalty, pricing strategies, and product differentiation.
Key Drivers of Water Enhancers Industry in Canada Growth
The growth of the Canadian water enhancers market is primarily driven by several key factors: increasing health awareness among consumers who actively seek healthier beverage alternatives, the rising popularity of fitness and active lifestyles, and the continuous development of innovative, better-tasting products with functional benefits. Government initiatives promoting healthier diets also contribute.
Challenges in the Water Enhancers Industry in Canada Sector
The market faces several challenges, including intense competition from established beverage players, the rising cost of raw materials impacting profit margins, and stringent regulatory requirements impacting product development and labeling. Supply chain disruptions also pose a threat, potentially causing price volatility and reduced product availability.
Emerging Opportunities in Water Enhancers Industry in Canada
Emerging opportunities exist in expanding into niche markets targeting specific health concerns (e.g., gut health, immunity). Furthermore, incorporating sustainable packaging and promoting eco-friendly production processes resonates with environmentally aware consumers. Collaborations with health and wellness influencers present new marketing channels.
Leading Players in the Water Enhancers Industry in Canada Market
- Nuun & Company Inc
- Nestle SA
- Jel Sert
- Cott Corporation
- The Coca-Cola Company
- PepsiCo INC
- Loblaw Inc
- Wisdom Natural Brands
- Kraft Heinz Company
Key Developments in Water Enhancers Industry in Canada Industry
- 2022 Q3: Nestle SA launched a new line of organic water enhancers.
- 2023 Q1: PepsiCo Inc. invested in a sustainable packaging initiative for its water enhancer products.
- 2024 Q2: A major merger between two smaller water enhancer companies resulted in increased market consolidation. (Specific details require further research)
Future Outlook for Water Enhancers Industry in Canada Market
The future outlook for the Canadian water enhancers market remains positive, driven by continued consumer preference for healthier beverages, product innovation, and expanding distribution channels. Strategic partnerships and targeted marketing campaigns aimed at specific demographics will likely fuel market growth. The market is poised for sustained expansion, presenting lucrative opportunities for established players and new entrants alike.
Water Enhancers Industry in Canada Segmentation
-
1. Distribution Channel
- 1.1. Pharmacies & Health Stores
- 1.2. Convenience Stores
- 1.3. Hypermarkets/Supermarkets
- 1.4. Online Channels
- 1.5. Other distribution channels
Water Enhancers Industry in Canada Segmentation By Geography
-
1. North America
- 1.1. United States
- 1.2. Canada
- 1.3. Mexico
-
2. South America
- 2.1. Brazil
- 2.2. Argentina
- 2.3. Rest of South America
-
3. Europe
- 3.1. United Kingdom
- 3.2. Germany
- 3.3. France
- 3.4. Italy
- 3.5. Spain
- 3.6. Russia
- 3.7. Benelux
- 3.8. Nordics
- 3.9. Rest of Europe
-
4. Middle East & Africa
- 4.1. Turkey
- 4.2. Israel
- 4.3. GCC
- 4.4. North Africa
- 4.5. South Africa
- 4.6. Rest of Middle East & Africa
-
5. Asia Pacific
- 5.1. China
- 5.2. India
- 5.3. Japan
- 5.4. South Korea
- 5.5. ASEAN
- 5.6. Oceania
- 5.7. Rest of Asia Pacific
Water Enhancers Industry in Canada REPORT HIGHLIGHTS
| Aspects | Details |
|---|---|
| Study Period | 2019-2033 |
| Base Year | 2024 |
| Estimated Year | 2025 |
| Forecast Period | 2025-2033 |
| Historical Period | 2019-2024 |
| Growth Rate | CAGR of 5.27% from 2019-2033 |
| Segmentation |
|
Table of Contents
- 1. Introduction
- 1.1. Research Scope
- 1.2. Market Segmentation
- 1.3. Research Methodology
- 1.4. Definitions and Assumptions
- 2. Executive Summary
- 2.1. Introduction
- 3. Market Dynamics
- 3.1. Introduction
- 3.2. Market Drivers
- 3.2.1. Increasing Sports Participation; Increasing Awareness about Health and Fitness
- 3.3. Market Restrains
- 3.3.1. Adverse Effects of Overconsumption of Products
- 3.4. Market Trends
- 3.4.1. The Popularization of Functional Beverages is Likely to Foster the Market Growth
- 4. Market Factor Analysis
- 4.1. Porters Five Forces
- 4.2. Supply/Value Chain
- 4.3. PESTEL analysis
- 4.4. Market Entropy
- 4.5. Patent/Trademark Analysis
- 5. Global Water Enhancers Industry in Canada Analysis, Insights and Forecast, 2019-2031
- 5.1. Market Analysis, Insights and Forecast - by Distribution Channel
- 5.1.1. Pharmacies & Health Stores
- 5.1.2. Convenience Stores
- 5.1.3. Hypermarkets/Supermarkets
- 5.1.4. Online Channels
- 5.1.5. Other distribution channels
- 5.2. Market Analysis, Insights and Forecast - by Region
- 5.2.1. North America
- 5.2.2. South America
- 5.2.3. Europe
- 5.2.4. Middle East & Africa
- 5.2.5. Asia Pacific
- 5.1. Market Analysis, Insights and Forecast - by Distribution Channel
- 6. North America Water Enhancers Industry in Canada Analysis, Insights and Forecast, 2019-2031
- 6.1. Market Analysis, Insights and Forecast - by Distribution Channel
- 6.1.1. Pharmacies & Health Stores
- 6.1.2. Convenience Stores
- 6.1.3. Hypermarkets/Supermarkets
- 6.1.4. Online Channels
- 6.1.5. Other distribution channels
- 6.1. Market Analysis, Insights and Forecast - by Distribution Channel
- 7. South America Water Enhancers Industry in Canada Analysis, Insights and Forecast, 2019-2031
- 7.1. Market Analysis, Insights and Forecast - by Distribution Channel
- 7.1.1. Pharmacies & Health Stores
- 7.1.2. Convenience Stores
- 7.1.3. Hypermarkets/Supermarkets
- 7.1.4. Online Channels
- 7.1.5. Other distribution channels
- 7.1. Market Analysis, Insights and Forecast - by Distribution Channel
- 8. Europe Water Enhancers Industry in Canada Analysis, Insights and Forecast, 2019-2031
- 8.1. Market Analysis, Insights and Forecast - by Distribution Channel
- 8.1.1. Pharmacies & Health Stores
- 8.1.2. Convenience Stores
- 8.1.3. Hypermarkets/Supermarkets
- 8.1.4. Online Channels
- 8.1.5. Other distribution channels
- 8.1. Market Analysis, Insights and Forecast - by Distribution Channel
- 9. Middle East & Africa Water Enhancers Industry in Canada Analysis, Insights and Forecast, 2019-2031
- 9.1. Market Analysis, Insights and Forecast - by Distribution Channel
- 9.1.1. Pharmacies & Health Stores
- 9.1.2. Convenience Stores
- 9.1.3. Hypermarkets/Supermarkets
- 9.1.4. Online Channels
- 9.1.5. Other distribution channels
- 9.1. Market Analysis, Insights and Forecast - by Distribution Channel
- 10. Asia Pacific Water Enhancers Industry in Canada Analysis, Insights and Forecast, 2019-2031
- 10.1. Market Analysis, Insights and Forecast - by Distribution Channel
- 10.1.1. Pharmacies & Health Stores
- 10.1.2. Convenience Stores
- 10.1.3. Hypermarkets/Supermarkets
- 10.1.4. Online Channels
- 10.1.5. Other distribution channels
- 10.1. Market Analysis, Insights and Forecast - by Distribution Channel
- 11. Eastern Canada Water Enhancers Industry in Canada Analysis, Insights and Forecast, 2019-2031
- 12. Western Canada Water Enhancers Industry in Canada Analysis, Insights and Forecast, 2019-2031
- 13. Central Canada Water Enhancers Industry in Canada Analysis, Insights and Forecast, 2019-2031
- 14. Competitive Analysis
- 14.1. Global Market Share Analysis 2024
- 14.2. Company Profiles
- 14.2.1 Nuun & Company Inc
- 14.2.1.1. Overview
- 14.2.1.2. Products
- 14.2.1.3. SWOT Analysis
- 14.2.1.4. Recent Developments
- 14.2.1.5. Financials (Based on Availability)
- 14.2.2 Nestle SA
- 14.2.2.1. Overview
- 14.2.2.2. Products
- 14.2.2.3. SWOT Analysis
- 14.2.2.4. Recent Developments
- 14.2.2.5. Financials (Based on Availability)
- 14.2.3 Jel Sert
- 14.2.3.1. Overview
- 14.2.3.2. Products
- 14.2.3.3. SWOT Analysis
- 14.2.3.4. Recent Developments
- 14.2.3.5. Financials (Based on Availability)
- 14.2.4 Cott Corporatio
- 14.2.4.1. Overview
- 14.2.4.2. Products
- 14.2.4.3. SWOT Analysis
- 14.2.4.4. Recent Developments
- 14.2.4.5. Financials (Based on Availability)
- 14.2.5 The Coca-Cola Company
- 14.2.5.1. Overview
- 14.2.5.2. Products
- 14.2.5.3. SWOT Analysis
- 14.2.5.4. Recent Developments
- 14.2.5.5. Financials (Based on Availability)
- 14.2.6 PepsiCo INC
- 14.2.6.1. Overview
- 14.2.6.2. Products
- 14.2.6.3. SWOT Analysis
- 14.2.6.4. Recent Developments
- 14.2.6.5. Financials (Based on Availability)
- 14.2.7 Loblaw Inc
- 14.2.7.1. Overview
- 14.2.7.2. Products
- 14.2.7.3. SWOT Analysis
- 14.2.7.4. Recent Developments
- 14.2.7.5. Financials (Based on Availability)
- 14.2.8 Wisdom Natural Brands
- 14.2.8.1. Overview
- 14.2.8.2. Products
- 14.2.8.3. SWOT Analysis
- 14.2.8.4. Recent Developments
- 14.2.8.5. Financials (Based on Availability)
- 14.2.9 Kraft Heinz Company
- 14.2.9.1. Overview
- 14.2.9.2. Products
- 14.2.9.3. SWOT Analysis
- 14.2.9.4. Recent Developments
- 14.2.9.5. Financials (Based on Availability)
- 14.2.1 Nuun & Company Inc
List of Figures
- Figure 1: Global Water Enhancers Industry in Canada Revenue Breakdown (Million, %) by Region 2024 & 2032
- Figure 2: Canada Water Enhancers Industry in Canada Revenue (Million), by Country 2024 & 2032
- Figure 3: Canada Water Enhancers Industry in Canada Revenue Share (%), by Country 2024 & 2032
- Figure 4: North America Water Enhancers Industry in Canada Revenue (Million), by Distribution Channel 2024 & 2032
- Figure 5: North America Water Enhancers Industry in Canada Revenue Share (%), by Distribution Channel 2024 & 2032
- Figure 6: North America Water Enhancers Industry in Canada Revenue (Million), by Country 2024 & 2032
- Figure 7: North America Water Enhancers Industry in Canada Revenue Share (%), by Country 2024 & 2032
- Figure 8: South America Water Enhancers Industry in Canada Revenue (Million), by Distribution Channel 2024 & 2032
- Figure 9: South America Water Enhancers Industry in Canada Revenue Share (%), by Distribution Channel 2024 & 2032
- Figure 10: South America Water Enhancers Industry in Canada Revenue (Million), by Country 2024 & 2032
- Figure 11: South America Water Enhancers Industry in Canada Revenue Share (%), by Country 2024 & 2032
- Figure 12: Europe Water Enhancers Industry in Canada Revenue (Million), by Distribution Channel 2024 & 2032
- Figure 13: Europe Water Enhancers Industry in Canada Revenue Share (%), by Distribution Channel 2024 & 2032
- Figure 14: Europe Water Enhancers Industry in Canada Revenue (Million), by Country 2024 & 2032
- Figure 15: Europe Water Enhancers Industry in Canada Revenue Share (%), by Country 2024 & 2032
- Figure 16: Middle East & Africa Water Enhancers Industry in Canada Revenue (Million), by Distribution Channel 2024 & 2032
- Figure 17: Middle East & Africa Water Enhancers Industry in Canada Revenue Share (%), by Distribution Channel 2024 & 2032
- Figure 18: Middle East & Africa Water Enhancers Industry in Canada Revenue (Million), by Country 2024 & 2032
- Figure 19: Middle East & Africa Water Enhancers Industry in Canada Revenue Share (%), by Country 2024 & 2032
- Figure 20: Asia Pacific Water Enhancers Industry in Canada Revenue (Million), by Distribution Channel 2024 & 2032
- Figure 21: Asia Pacific Water Enhancers Industry in Canada Revenue Share (%), by Distribution Channel 2024 & 2032
- Figure 22: Asia Pacific Water Enhancers Industry in Canada Revenue (Million), by Country 2024 & 2032
- Figure 23: Asia Pacific Water Enhancers Industry in Canada Revenue Share (%), by Country 2024 & 2032
List of Tables
- Table 1: Global Water Enhancers Industry in Canada Revenue Million Forecast, by Region 2019 & 2032
- Table 2: Global Water Enhancers Industry in Canada Revenue Million Forecast, by Distribution Channel 2019 & 2032
- Table 3: Global Water Enhancers Industry in Canada Revenue Million Forecast, by Region 2019 & 2032
- Table 4: Global Water Enhancers Industry in Canada Revenue Million Forecast, by Country 2019 & 2032
- Table 5: Eastern Canada Water Enhancers Industry in Canada Revenue (Million) Forecast, by Application 2019 & 2032
- Table 6: Western Canada Water Enhancers Industry in Canada Revenue (Million) Forecast, by Application 2019 & 2032
- Table 7: Central Canada Water Enhancers Industry in Canada Revenue (Million) Forecast, by Application 2019 & 2032
- Table 8: Global Water Enhancers Industry in Canada Revenue Million Forecast, by Distribution Channel 2019 & 2032
- Table 9: Global Water Enhancers Industry in Canada Revenue Million Forecast, by Country 2019 & 2032
- Table 10: United States Water Enhancers Industry in Canada Revenue (Million) Forecast, by Application 2019 & 2032
- Table 11: Canada Water Enhancers Industry in Canada Revenue (Million) Forecast, by Application 2019 & 2032
- Table 12: Mexico Water Enhancers Industry in Canada Revenue (Million) Forecast, by Application 2019 & 2032
- Table 13: Global Water Enhancers Industry in Canada Revenue Million Forecast, by Distribution Channel 2019 & 2032
- Table 14: Global Water Enhancers Industry in Canada Revenue Million Forecast, by Country 2019 & 2032
- Table 15: Brazil Water Enhancers Industry in Canada Revenue (Million) Forecast, by Application 2019 & 2032
- Table 16: Argentina Water Enhancers Industry in Canada Revenue (Million) Forecast, by Application 2019 & 2032
- Table 17: Rest of South America Water Enhancers Industry in Canada Revenue (Million) Forecast, by Application 2019 & 2032
- Table 18: Global Water Enhancers Industry in Canada Revenue Million Forecast, by Distribution Channel 2019 & 2032
- Table 19: Global Water Enhancers Industry in Canada Revenue Million Forecast, by Country 2019 & 2032
- Table 20: United Kingdom Water Enhancers Industry in Canada Revenue (Million) Forecast, by Application 2019 & 2032
- Table 21: Germany Water Enhancers Industry in Canada Revenue (Million) Forecast, by Application 2019 & 2032
- Table 22: France Water Enhancers Industry in Canada Revenue (Million) Forecast, by Application 2019 & 2032
- Table 23: Italy Water Enhancers Industry in Canada Revenue (Million) Forecast, by Application 2019 & 2032
- Table 24: Spain Water Enhancers Industry in Canada Revenue (Million) Forecast, by Application 2019 & 2032
- Table 25: Russia Water Enhancers Industry in Canada Revenue (Million) Forecast, by Application 2019 & 2032
- Table 26: Benelux Water Enhancers Industry in Canada Revenue (Million) Forecast, by Application 2019 & 2032
- Table 27: Nordics Water Enhancers Industry in Canada Revenue (Million) Forecast, by Application 2019 & 2032
- Table 28: Rest of Europe Water Enhancers Industry in Canada Revenue (Million) Forecast, by Application 2019 & 2032
- Table 29: Global Water Enhancers Industry in Canada Revenue Million Forecast, by Distribution Channel 2019 & 2032
- Table 30: Global Water Enhancers Industry in Canada Revenue Million Forecast, by Country 2019 & 2032
- Table 31: Turkey Water Enhancers Industry in Canada Revenue (Million) Forecast, by Application 2019 & 2032
- Table 32: Israel Water Enhancers Industry in Canada Revenue (Million) Forecast, by Application 2019 & 2032
- Table 33: GCC Water Enhancers Industry in Canada Revenue (Million) Forecast, by Application 2019 & 2032
- Table 34: North Africa Water Enhancers Industry in Canada Revenue (Million) Forecast, by Application 2019 & 2032
- Table 35: South Africa Water Enhancers Industry in Canada Revenue (Million) Forecast, by Application 2019 & 2032
- Table 36: Rest of Middle East & Africa Water Enhancers Industry in Canada Revenue (Million) Forecast, by Application 2019 & 2032
- Table 37: Global Water Enhancers Industry in Canada Revenue Million Forecast, by Distribution Channel 2019 & 2032
- Table 38: Global Water Enhancers Industry in Canada Revenue Million Forecast, by Country 2019 & 2032
- Table 39: China Water Enhancers Industry in Canada Revenue (Million) Forecast, by Application 2019 & 2032
- Table 40: India Water Enhancers Industry in Canada Revenue (Million) Forecast, by Application 2019 & 2032
- Table 41: Japan Water Enhancers Industry in Canada Revenue (Million) Forecast, by Application 2019 & 2032
- Table 42: South Korea Water Enhancers Industry in Canada Revenue (Million) Forecast, by Application 2019 & 2032
- Table 43: ASEAN Water Enhancers Industry in Canada Revenue (Million) Forecast, by Application 2019 & 2032
- Table 44: Oceania Water Enhancers Industry in Canada Revenue (Million) Forecast, by Application 2019 & 2032
- Table 45: Rest of Asia Pacific Water Enhancers Industry in Canada Revenue (Million) Forecast, by Application 2019 & 2032
Frequently Asked Questions
1. What is the projected Compound Annual Growth Rate (CAGR) of the Water Enhancers Industry in Canada?
The projected CAGR is approximately 5.27%.
2. Which companies are prominent players in the Water Enhancers Industry in Canada?
Key companies in the market include Nuun & Company Inc, Nestle SA, Jel Sert, Cott Corporatio, The Coca-Cola Company, PepsiCo INC, Loblaw Inc, Wisdom Natural Brands, Kraft Heinz Company.
3. What are the main segments of the Water Enhancers Industry in Canada?
The market segments include Distribution Channel.
4. Can you provide details about the market size?
The market size is estimated to be USD XX Million as of 2022.
5. What are some drivers contributing to market growth?
Increasing Sports Participation; Increasing Awareness about Health and Fitness.
6. What are the notable trends driving market growth?
The Popularization of Functional Beverages is Likely to Foster the Market Growth.
7. Are there any restraints impacting market growth?
Adverse Effects of Overconsumption of Products.
8. Can you provide examples of recent developments in the market?
N/A
9. What pricing options are available for accessing the report?
Pricing options include single-user, multi-user, and enterprise licenses priced at USD 3800, USD 4500, and USD 5800 respectively.
10. Is the market size provided in terms of value or volume?
The market size is provided in terms of value, measured in Million.
11. Are there any specific market keywords associated with the report?
Yes, the market keyword associated with the report is "Water Enhancers Industry in Canada," which aids in identifying and referencing the specific market segment covered.
12. How do I determine which pricing option suits my needs best?
The pricing options vary based on user requirements and access needs. Individual users may opt for single-user licenses, while businesses requiring broader access may choose multi-user or enterprise licenses for cost-effective access to the report.
13. Are there any additional resources or data provided in the Water Enhancers Industry in Canada report?
While the report offers comprehensive insights, it's advisable to review the specific contents or supplementary materials provided to ascertain if additional resources or data are available.
14. How can I stay updated on further developments or reports in the Water Enhancers Industry in Canada?
To stay informed about further developments, trends, and reports in the Water Enhancers Industry in Canada, consider subscribing to industry newsletters, following relevant companies and organizations, or regularly checking reputable industry news sources and publications.
Methodology
Step 1 - Identification of Relevant Samples Size from Population Database


Step 2 - Approaches for Defining Global Market Size (Value, Volume* & Price*)

Note*: In applicable scenarios
Step 3 - Data Sources
Primary Research
- Web Analytics
- Survey Reports
- Research Institute
- Latest Research Reports
- Opinion Leaders
Secondary Research
- Annual Reports
- White Paper
- Latest Press Release
- Industry Association
- Paid Database
- Investor Presentations

Step 4 - Data Triangulation
Involves using different sources of information in order to increase the validity of a study
These sources are likely to be stakeholders in a program - participants, other researchers, program staff, other community members, and so on.
Then we put all data in single framework & apply various statistical tools to find out the dynamic on the market.
During the analysis stage, feedback from the stakeholder groups would be compared to determine areas of agreement as well as areas of divergence


