
Key Insights
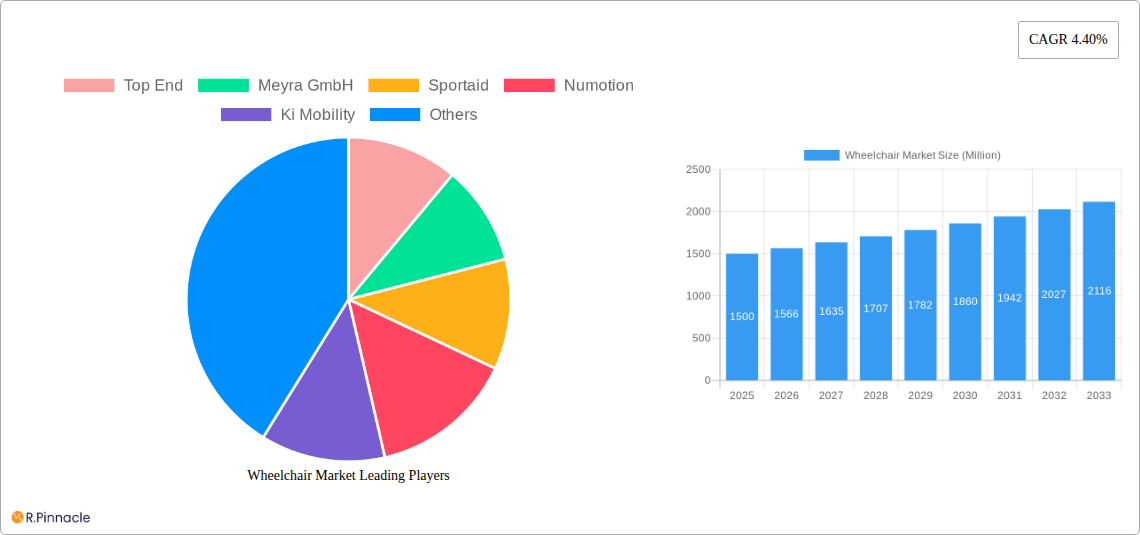
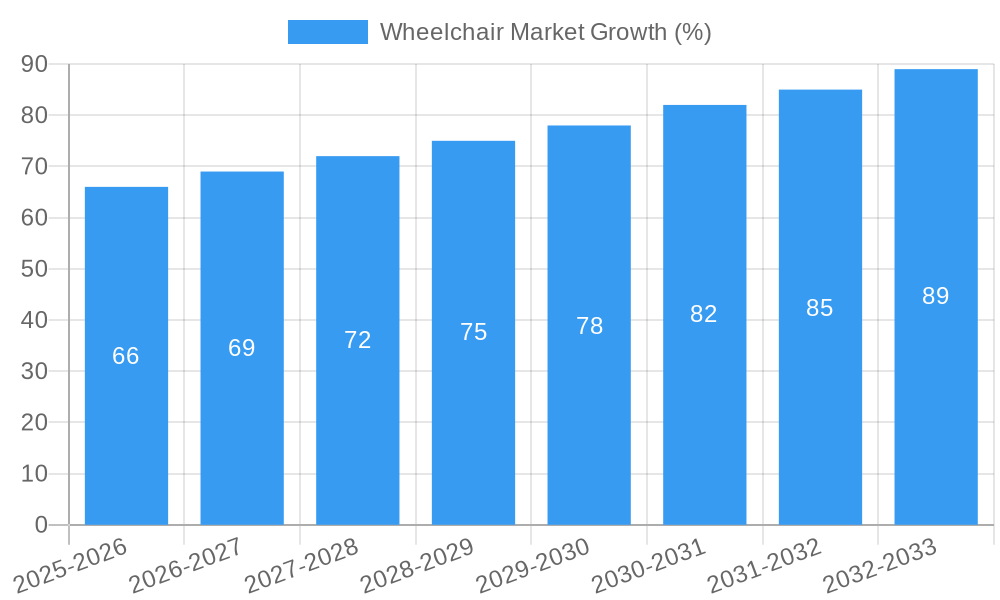
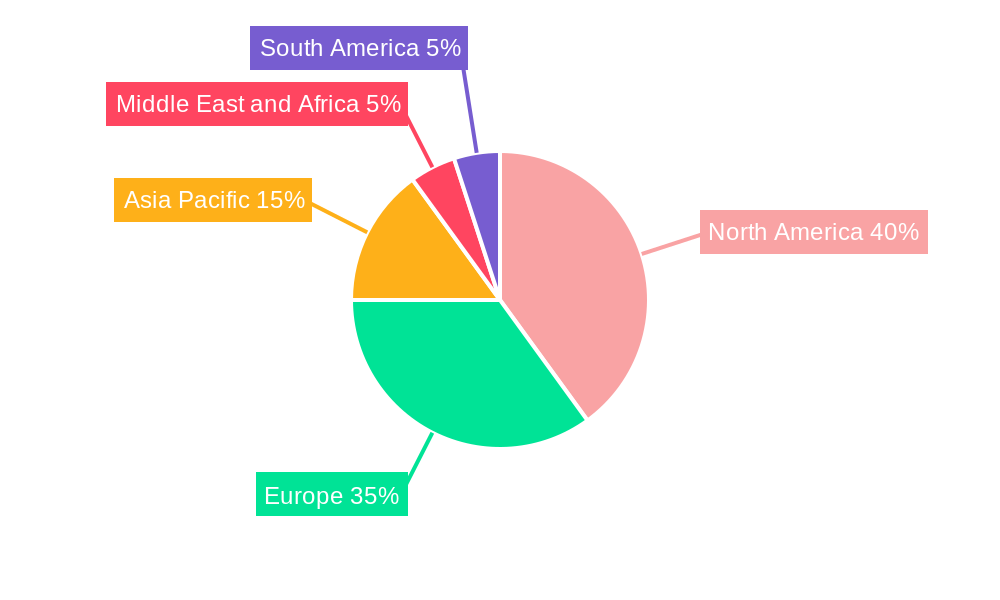
The global wheelchair market, currently valued at approximately $XX million (estimated based on provided CAGR and market size), is experiencing steady growth, projected to maintain a Compound Annual Growth Rate (CAGR) of 4.40% from 2025 to 2033. Several key factors fuel this expansion. The aging global population, coupled with increasing prevalence of chronic conditions like spinal cord injuries, cerebral palsy, diabetes, and Alzheimer's disease, significantly drives demand for wheelchairs. Technological advancements leading to lighter, more maneuverable, and technologically advanced power wheelchairs are also contributing to market growth. Furthermore, rising healthcare expenditure and improved access to assistive technologies in developing economies are expanding market opportunities. The market is segmented by product type (manual and power wheelchairs) and application (Alzheimer's, Diabetes, Spinal Cord Injury, Cerebral Palsy, and other applications), reflecting diverse user needs and varying technological requirements. North America and Europe currently dominate the market due to high healthcare spending and established healthcare infrastructure. However, the Asia-Pacific region is expected to witness significant growth in the coming years, driven by increasing awareness, rising disposable incomes, and a growing elderly population.
Despite the positive growth trajectory, certain challenges restrain market expansion. High costs associated with advanced power wheelchairs, particularly those with sophisticated features, can limit accessibility for some demographics. Additionally, the market faces competition from emerging technologies and alternative mobility solutions, which could impact the overall growth rate. However, ongoing research and development in lightweight materials, enhanced functionalities (like smart features and improved battery life), and customized wheelchair solutions are expected to mitigate these constraints and further stimulate market growth over the forecast period. Key players such as Top End, Meyra GmbH, Sportaid, Numotion, Ki Mobility, Permobil, Mountain Trike, Sunrise Medical, PER4MAX Medical, and Karman Healthcare are actively contributing to this dynamic market through product innovation and strategic market expansion. The competitive landscape is characterized by both established players and emerging companies striving to cater to the diverse needs of the wheelchair user community.
Wheelchair Market Report: 2019-2033
This comprehensive report provides a detailed analysis of the global Wheelchair Market, offering invaluable insights for industry professionals, investors, and stakeholders. Covering the period 2019-2033, with a base year of 2025, this report meticulously examines market dynamics, key players, and future growth projections. The global Wheelchair Market is estimated to be valued at xx Million in 2025 and is projected to reach xx Million by 2033, exhibiting a CAGR of xx% during the forecast period (2025-2033).
Wheelchair Market Structure & Innovation Trends
The Wheelchair market is characterized by a moderately concentrated structure, with key players holding significant market share. Top players like Permobil, Sunrise Medical, and Invacare (not included in your provided list) command a substantial portion of the market. However, the presence of numerous smaller companies and niche players contributes to a dynamic competitive landscape. Innovation is driven by advancements in materials science (lighter, stronger materials), electronics (smart wheelchairs with advanced control systems), and assistive technologies (improving user experience and independence). Regulatory frameworks, such as those governing medical device safety and accessibility, significantly influence market trends. Product substitutes, while limited, include alternative mobility solutions like walking aids and electric scooters. The end-user demographics are broad, encompassing individuals with various disabilities, aging populations, and those recovering from injuries.
- Market Share: Permobil: xx%, Sunrise Medical: xx%, Invacare: xx%, Others: xx% (estimated values)
- M&A Activity: The market witnesses regular M&A activity, with deal values ranging from xx Million to xx Million in recent years. Examples include Sunrise Medical's acquisition of James Leckley Design and Firefly Friends in 2021, showcasing a strategic focus on expanding pediatric mobility offerings.
Wheelchair Market Dynamics & Trends
The Wheelchair market is experiencing robust growth, driven by several factors. The aging global population, rising prevalence of chronic diseases (e.g., spinal cord injuries, cerebral palsy, diabetes), and increasing awareness regarding accessibility have contributed significantly to market expansion. Technological advancements, particularly in power wheelchair technology, offer enhanced mobility and improved quality of life for users, further fueling market demand. Consumer preferences are shifting towards lighter, more maneuverable, and technologically advanced wheelchairs. Competitive dynamics are characterized by product differentiation, technological innovation, and strategic partnerships. Market penetration of advanced features like power-assisted controls and smart technology continues to rise.
Dominant Regions & Segments in Wheelchair Market
The North American and European regions currently dominate the Wheelchair market, driven by higher healthcare expenditure, well-established healthcare infrastructure, and a strong regulatory framework supporting accessibility. Within product types, power wheelchairs constitute a larger market segment than manual wheelchairs due to higher comfort and enhanced mobility. Among applications, spinal cord injuries and cerebral palsy represent significant segments, with a large and growing patient population. Other applications, like the needs of individuals with Alzheimer's and diabetes, are also driving growth, but at a slower rate than the primary applications.
- Key Drivers for North America: High healthcare expenditure, aging population, established healthcare infrastructure.
- Key Drivers for Europe: Similar to North America, also includes strong government initiatives promoting accessibility and inclusivity.
- Power Wheelchairs: Dominated by technological advancements and higher purchasing power in developed nations.
- Spinal Cord Injury/Cerebral Palsy: Larger patient population compared to other applications.
Wheelchair Market Product Innovations
Recent advancements in wheelchair technology include the integration of smart features like GPS tracking, advanced power systems, and customizable seating options. Lightweight materials and improved design are enhancing maneuverability and user comfort. These innovations are addressing unmet needs in the market, offering enhanced independence and improving the overall user experience. Competitors are leveraging these trends to gain a competitive advantage, with a focus on customization, comfort, and smart functionality.
Report Scope & Segmentation Analysis
This report segments the Wheelchair market based on product type (Manual Wheelchairs, Power Wheelchairs) and application (Alzheimer's, Diabetes, Spinal Cord Injury, Cerebral Palsy, Other Applications). Each segment is analyzed in terms of market size, growth projections, and competitive dynamics. The market for power wheelchairs is expected to grow at a faster rate compared to manual wheelchairs due to advancements in technology and increasing disposable income. Similarly, segments related to spinal cord injury and cerebral palsy represent significant market potential due to the considerable number of patients requiring these devices.
Key Drivers of Wheelchair Market Growth
The Wheelchair market is propelled by several factors. The aging global population necessitates greater accessibility and mobility solutions. Rising prevalence of chronic diseases like spinal cord injuries and cerebral palsy directly increases demand. Technological advancements, leading to lighter, more advanced, and comfortable wheelchairs, stimulate growth. Government regulations promoting accessibility in public spaces and healthcare policies supporting assistive devices further enhance market expansion.
Challenges in the Wheelchair Market Sector
Challenges include high manufacturing costs, stringent regulatory approvals, and intense competition among established and emerging players. Supply chain disruptions can impact product availability and cost. The fluctuating price of raw materials can also affect profitability. Furthermore, reimbursement policies and healthcare insurance coverage vary across different regions, impacting market access.
Emerging Opportunities in Wheelchair Market
Emerging opportunities lie in the development of smart wheelchairs with advanced features, personalized customization options, and improved user interfaces. Expansion into developing markets with growing healthcare infrastructure presents substantial growth potential. The integration of telehealth and remote monitoring capabilities offers exciting avenues for enhanced user care and support. Focus on sustainable and eco-friendly materials is a developing trend.
Leading Players in the Wheelchair Market Market
- Top End
- Meyra GmbH
- Sportaid
- Numotion
- Ki Mobility
- Permobil
- Mountain Trike
- Sunrise Medical
- PER4MAX Medical
- Karman Healthcare
Key Developments in Wheelchair Market Industry
- October 2021: Numotion announced a five-year strategic partnership with Team Gleason, focusing on improving access to technology for ALS patients. This significantly expands access and raises awareness within a specific, high-need segment.
- August 2021: Sunrise Medical acquired James Leckley Design and Firefly Friends, strengthening its position in the pediatric mobility market. This strategic move expands market share and product offerings, enhancing competitive advantage.
Future Outlook for Wheelchair Market Market
The Wheelchair market is poised for sustained growth, driven by technological innovation, expanding elderly populations, and rising prevalence of chronic conditions. Strategic partnerships, acquisitions, and a focus on developing markets will shape the industry's future. Companies concentrating on personalized solutions, smart technology integration, and sustainable manufacturing practices will gain a significant competitive edge.
Wheelchair Market Segmentation
-
1. Product Type
- 1.1. Manual Wheelchairs
- 1.2. Power Wheelchairs
-
2. Application
- 2.1. Alzheimer's
- 2.2. Diabetes
- 2.3. Spinal Cord Injury
- 2.4. Cerebral Palsy
- 2.5. Other Applications
Wheelchair Market Segmentation By Geography
-
1. North America
- 1.1. United States
- 1.2. Canada
- 1.3. Mexico
-
2. Europe
- 2.1. Germany
- 2.2. United Kingdom
- 2.3. France
- 2.4. Italy
- 2.5. Spain
- 2.6. Rest of Europe
-
3. Asia Pacific
- 3.1. China
- 3.2. Japan
- 3.3. India
- 3.4. Australia
- 3.5. South Korea
- 3.6. Rest of Asia Pacific
-
4. Middle East and Africa
- 4.1. GCC
- 4.2. South Africa
- 4.3. Rest of Middle East and Africa
-
5. South America
- 5.1. Brazil
- 5.2. Argentina
- 5.3. Rest of South America
Wheelchair Market REPORT HIGHLIGHTS
| Aspects | Details |
|---|---|
| Study Period | 2019-2033 |
| Base Year | 2024 |
| Estimated Year | 2025 |
| Forecast Period | 2025-2033 |
| Historical Period | 2019-2024 |
| Growth Rate | CAGR of 4.40% from 2019-2033 |
| Segmentation |
|
Table of Contents
- 1. Introduction
- 1.1. Research Scope
- 1.2. Market Segmentation
- 1.3. Research Methodology
- 1.4. Definitions and Assumptions
- 2. Executive Summary
- 2.1. Introduction
- 3. Market Dynamics
- 3.1. Introduction
- 3.2. Market Drivers
- 3.2.1. Increasing Global Geriatric Population; Increasing Technological Innovations
- 3.3. Market Restrains
- 3.3.1. Lesser Adoption in Middle- and Low-income Countries
- 3.4. Market Trends
- 3.4.1. The Cerebral Palsy Segment is Expected to Hold a Major Market Share
- 4. Market Factor Analysis
- 4.1. Porters Five Forces
- 4.2. Supply/Value Chain
- 4.3. PESTEL analysis
- 4.4. Market Entropy
- 4.5. Patent/Trademark Analysis
- 5. Global Wheelchair Market Analysis, Insights and Forecast, 2019-2031
- 5.1. Market Analysis, Insights and Forecast - by Product Type
- 5.1.1. Manual Wheelchairs
- 5.1.2. Power Wheelchairs
- 5.2. Market Analysis, Insights and Forecast - by Application
- 5.2.1. Alzheimer's
- 5.2.2. Diabetes
- 5.2.3. Spinal Cord Injury
- 5.2.4. Cerebral Palsy
- 5.2.5. Other Applications
- 5.3. Market Analysis, Insights and Forecast - by Region
- 5.3.1. North America
- 5.3.2. Europe
- 5.3.3. Asia Pacific
- 5.3.4. Middle East and Africa
- 5.3.5. South America
- 5.1. Market Analysis, Insights and Forecast - by Product Type
- 6. North America Wheelchair Market Analysis, Insights and Forecast, 2019-2031
- 6.1. Market Analysis, Insights and Forecast - by Product Type
- 6.1.1. Manual Wheelchairs
- 6.1.2. Power Wheelchairs
- 6.2. Market Analysis, Insights and Forecast - by Application
- 6.2.1. Alzheimer's
- 6.2.2. Diabetes
- 6.2.3. Spinal Cord Injury
- 6.2.4. Cerebral Palsy
- 6.2.5. Other Applications
- 6.1. Market Analysis, Insights and Forecast - by Product Type
- 7. Europe Wheelchair Market Analysis, Insights and Forecast, 2019-2031
- 7.1. Market Analysis, Insights and Forecast - by Product Type
- 7.1.1. Manual Wheelchairs
- 7.1.2. Power Wheelchairs
- 7.2. Market Analysis, Insights and Forecast - by Application
- 7.2.1. Alzheimer's
- 7.2.2. Diabetes
- 7.2.3. Spinal Cord Injury
- 7.2.4. Cerebral Palsy
- 7.2.5. Other Applications
- 7.1. Market Analysis, Insights and Forecast - by Product Type
- 8. Asia Pacific Wheelchair Market Analysis, Insights and Forecast, 2019-2031
- 8.1. Market Analysis, Insights and Forecast - by Product Type
- 8.1.1. Manual Wheelchairs
- 8.1.2. Power Wheelchairs
- 8.2. Market Analysis, Insights and Forecast - by Application
- 8.2.1. Alzheimer's
- 8.2.2. Diabetes
- 8.2.3. Spinal Cord Injury
- 8.2.4. Cerebral Palsy
- 8.2.5. Other Applications
- 8.1. Market Analysis, Insights and Forecast - by Product Type
- 9. Middle East and Africa Wheelchair Market Analysis, Insights and Forecast, 2019-2031
- 9.1. Market Analysis, Insights and Forecast - by Product Type
- 9.1.1. Manual Wheelchairs
- 9.1.2. Power Wheelchairs
- 9.2. Market Analysis, Insights and Forecast - by Application
- 9.2.1. Alzheimer's
- 9.2.2. Diabetes
- 9.2.3. Spinal Cord Injury
- 9.2.4. Cerebral Palsy
- 9.2.5. Other Applications
- 9.1. Market Analysis, Insights and Forecast - by Product Type
- 10. South America Wheelchair Market Analysis, Insights and Forecast, 2019-2031
- 10.1. Market Analysis, Insights and Forecast - by Product Type
- 10.1.1. Manual Wheelchairs
- 10.1.2. Power Wheelchairs
- 10.2. Market Analysis, Insights and Forecast - by Application
- 10.2.1. Alzheimer's
- 10.2.2. Diabetes
- 10.2.3. Spinal Cord Injury
- 10.2.4. Cerebral Palsy
- 10.2.5. Other Applications
- 10.1. Market Analysis, Insights and Forecast - by Product Type
- 11. North America Wheelchair Market Analysis, Insights and Forecast, 2019-2031
- 11.1. Market Analysis, Insights and Forecast - By Country/Sub-region
- 11.1.1 United States
- 11.1.2 Canada
- 11.1.3 Mexico
- 12. Europe Wheelchair Market Analysis, Insights and Forecast, 2019-2031
- 12.1. Market Analysis, Insights and Forecast - By Country/Sub-region
- 12.1.1 Germany
- 12.1.2 United Kingdom
- 12.1.3 France
- 12.1.4 Italy
- 12.1.5 Spain
- 12.1.6 Rest of Europe
- 13. Asia Pacific Wheelchair Market Analysis, Insights and Forecast, 2019-2031
- 13.1. Market Analysis, Insights and Forecast - By Country/Sub-region
- 13.1.1 China
- 13.1.2 Japan
- 13.1.3 India
- 13.1.4 Australia
- 13.1.5 South Korea
- 13.1.6 Rest of Asia Pacific
- 14. Middle East and Africa Wheelchair Market Analysis, Insights and Forecast, 2019-2031
- 14.1. Market Analysis, Insights and Forecast - By Country/Sub-region
- 14.1.1 GCC
- 14.1.2 South Africa
- 14.1.3 Rest of Middle East and Africa
- 15. South America Wheelchair Market Analysis, Insights and Forecast, 2019-2031
- 15.1. Market Analysis, Insights and Forecast - By Country/Sub-region
- 15.1.1 Brazil
- 15.1.2 Argentina
- 15.1.3 Rest of South America
- 16. Competitive Analysis
- 16.1. Global Market Share Analysis 2024
- 16.2. Company Profiles
- 16.2.1 Top End
- 16.2.1.1. Overview
- 16.2.1.2. Products
- 16.2.1.3. SWOT Analysis
- 16.2.1.4. Recent Developments
- 16.2.1.5. Financials (Based on Availability)
- 16.2.2 Meyra GmbH
- 16.2.2.1. Overview
- 16.2.2.2. Products
- 16.2.2.3. SWOT Analysis
- 16.2.2.4. Recent Developments
- 16.2.2.5. Financials (Based on Availability)
- 16.2.3 Sportaid
- 16.2.3.1. Overview
- 16.2.3.2. Products
- 16.2.3.3. SWOT Analysis
- 16.2.3.4. Recent Developments
- 16.2.3.5. Financials (Based on Availability)
- 16.2.4 Numotion
- 16.2.4.1. Overview
- 16.2.4.2. Products
- 16.2.4.3. SWOT Analysis
- 16.2.4.4. Recent Developments
- 16.2.4.5. Financials (Based on Availability)
- 16.2.5 Ki Mobility
- 16.2.5.1. Overview
- 16.2.5.2. Products
- 16.2.5.3. SWOT Analysis
- 16.2.5.4. Recent Developments
- 16.2.5.5. Financials (Based on Availability)
- 16.2.6 Permobil
- 16.2.6.1. Overview
- 16.2.6.2. Products
- 16.2.6.3. SWOT Analysis
- 16.2.6.4. Recent Developments
- 16.2.6.5. Financials (Based on Availability)
- 16.2.7 Mountain Trike
- 16.2.7.1. Overview
- 16.2.7.2. Products
- 16.2.7.3. SWOT Analysis
- 16.2.7.4. Recent Developments
- 16.2.7.5. Financials (Based on Availability)
- 16.2.8 Sunrise Medical
- 16.2.8.1. Overview
- 16.2.8.2. Products
- 16.2.8.3. SWOT Analysis
- 16.2.8.4. Recent Developments
- 16.2.8.5. Financials (Based on Availability)
- 16.2.9 PER4MAX Medical
- 16.2.9.1. Overview
- 16.2.9.2. Products
- 16.2.9.3. SWOT Analysis
- 16.2.9.4. Recent Developments
- 16.2.9.5. Financials (Based on Availability)
- 16.2.10 Karman Healthcare
- 16.2.10.1. Overview
- 16.2.10.2. Products
- 16.2.10.3. SWOT Analysis
- 16.2.10.4. Recent Developments
- 16.2.10.5. Financials (Based on Availability)
- 16.2.1 Top End
List of Figures
- Figure 1: Global Wheelchair Market Revenue Breakdown (Million, %) by Region 2024 & 2032
- Figure 2: Global Wheelchair Market Volume Breakdown (K Unit, %) by Region 2024 & 2032
- Figure 3: North America Wheelchair Market Revenue (Million), by Country 2024 & 2032
- Figure 4: North America Wheelchair Market Volume (K Unit), by Country 2024 & 2032
- Figure 5: North America Wheelchair Market Revenue Share (%), by Country 2024 & 2032
- Figure 6: North America Wheelchair Market Volume Share (%), by Country 2024 & 2032
- Figure 7: Europe Wheelchair Market Revenue (Million), by Country 2024 & 2032
- Figure 8: Europe Wheelchair Market Volume (K Unit), by Country 2024 & 2032
- Figure 9: Europe Wheelchair Market Revenue Share (%), by Country 2024 & 2032
- Figure 10: Europe Wheelchair Market Volume Share (%), by Country 2024 & 2032
- Figure 11: Asia Pacific Wheelchair Market Revenue (Million), by Country 2024 & 2032
- Figure 12: Asia Pacific Wheelchair Market Volume (K Unit), by Country 2024 & 2032
- Figure 13: Asia Pacific Wheelchair Market Revenue Share (%), by Country 2024 & 2032
- Figure 14: Asia Pacific Wheelchair Market Volume Share (%), by Country 2024 & 2032
- Figure 15: Middle East and Africa Wheelchair Market Revenue (Million), by Country 2024 & 2032
- Figure 16: Middle East and Africa Wheelchair Market Volume (K Unit), by Country 2024 & 2032
- Figure 17: Middle East and Africa Wheelchair Market Revenue Share (%), by Country 2024 & 2032
- Figure 18: Middle East and Africa Wheelchair Market Volume Share (%), by Country 2024 & 2032
- Figure 19: South America Wheelchair Market Revenue (Million), by Country 2024 & 2032
- Figure 20: South America Wheelchair Market Volume (K Unit), by Country 2024 & 2032
- Figure 21: South America Wheelchair Market Revenue Share (%), by Country 2024 & 2032
- Figure 22: South America Wheelchair Market Volume Share (%), by Country 2024 & 2032
- Figure 23: North America Wheelchair Market Revenue (Million), by Product Type 2024 & 2032
- Figure 24: North America Wheelchair Market Volume (K Unit), by Product Type 2024 & 2032
- Figure 25: North America Wheelchair Market Revenue Share (%), by Product Type 2024 & 2032
- Figure 26: North America Wheelchair Market Volume Share (%), by Product Type 2024 & 2032
- Figure 27: North America Wheelchair Market Revenue (Million), by Application 2024 & 2032
- Figure 28: North America Wheelchair Market Volume (K Unit), by Application 2024 & 2032
- Figure 29: North America Wheelchair Market Revenue Share (%), by Application 2024 & 2032
- Figure 30: North America Wheelchair Market Volume Share (%), by Application 2024 & 2032
- Figure 31: North America Wheelchair Market Revenue (Million), by Country 2024 & 2032
- Figure 32: North America Wheelchair Market Volume (K Unit), by Country 2024 & 2032
- Figure 33: North America Wheelchair Market Revenue Share (%), by Country 2024 & 2032
- Figure 34: North America Wheelchair Market Volume Share (%), by Country 2024 & 2032
- Figure 35: Europe Wheelchair Market Revenue (Million), by Product Type 2024 & 2032
- Figure 36: Europe Wheelchair Market Volume (K Unit), by Product Type 2024 & 2032
- Figure 37: Europe Wheelchair Market Revenue Share (%), by Product Type 2024 & 2032
- Figure 38: Europe Wheelchair Market Volume Share (%), by Product Type 2024 & 2032
- Figure 39: Europe Wheelchair Market Revenue (Million), by Application 2024 & 2032
- Figure 40: Europe Wheelchair Market Volume (K Unit), by Application 2024 & 2032
- Figure 41: Europe Wheelchair Market Revenue Share (%), by Application 2024 & 2032
- Figure 42: Europe Wheelchair Market Volume Share (%), by Application 2024 & 2032
- Figure 43: Europe Wheelchair Market Revenue (Million), by Country 2024 & 2032
- Figure 44: Europe Wheelchair Market Volume (K Unit), by Country 2024 & 2032
- Figure 45: Europe Wheelchair Market Revenue Share (%), by Country 2024 & 2032
- Figure 46: Europe Wheelchair Market Volume Share (%), by Country 2024 & 2032
- Figure 47: Asia Pacific Wheelchair Market Revenue (Million), by Product Type 2024 & 2032
- Figure 48: Asia Pacific Wheelchair Market Volume (K Unit), by Product Type 2024 & 2032
- Figure 49: Asia Pacific Wheelchair Market Revenue Share (%), by Product Type 2024 & 2032
- Figure 50: Asia Pacific Wheelchair Market Volume Share (%), by Product Type 2024 & 2032
- Figure 51: Asia Pacific Wheelchair Market Revenue (Million), by Application 2024 & 2032
- Figure 52: Asia Pacific Wheelchair Market Volume (K Unit), by Application 2024 & 2032
- Figure 53: Asia Pacific Wheelchair Market Revenue Share (%), by Application 2024 & 2032
- Figure 54: Asia Pacific Wheelchair Market Volume Share (%), by Application 2024 & 2032
- Figure 55: Asia Pacific Wheelchair Market Revenue (Million), by Country 2024 & 2032
- Figure 56: Asia Pacific Wheelchair Market Volume (K Unit), by Country 2024 & 2032
- Figure 57: Asia Pacific Wheelchair Market Revenue Share (%), by Country 2024 & 2032
- Figure 58: Asia Pacific Wheelchair Market Volume Share (%), by Country 2024 & 2032
- Figure 59: Middle East and Africa Wheelchair Market Revenue (Million), by Product Type 2024 & 2032
- Figure 60: Middle East and Africa Wheelchair Market Volume (K Unit), by Product Type 2024 & 2032
- Figure 61: Middle East and Africa Wheelchair Market Revenue Share (%), by Product Type 2024 & 2032
- Figure 62: Middle East and Africa Wheelchair Market Volume Share (%), by Product Type 2024 & 2032
- Figure 63: Middle East and Africa Wheelchair Market Revenue (Million), by Application 2024 & 2032
- Figure 64: Middle East and Africa Wheelchair Market Volume (K Unit), by Application 2024 & 2032
- Figure 65: Middle East and Africa Wheelchair Market Revenue Share (%), by Application 2024 & 2032
- Figure 66: Middle East and Africa Wheelchair Market Volume Share (%), by Application 2024 & 2032
- Figure 67: Middle East and Africa Wheelchair Market Revenue (Million), by Country 2024 & 2032
- Figure 68: Middle East and Africa Wheelchair Market Volume (K Unit), by Country 2024 & 2032
- Figure 69: Middle East and Africa Wheelchair Market Revenue Share (%), by Country 2024 & 2032
- Figure 70: Middle East and Africa Wheelchair Market Volume Share (%), by Country 2024 & 2032
- Figure 71: South America Wheelchair Market Revenue (Million), by Product Type 2024 & 2032
- Figure 72: South America Wheelchair Market Volume (K Unit), by Product Type 2024 & 2032
- Figure 73: South America Wheelchair Market Revenue Share (%), by Product Type 2024 & 2032
- Figure 74: South America Wheelchair Market Volume Share (%), by Product Type 2024 & 2032
- Figure 75: South America Wheelchair Market Revenue (Million), by Application 2024 & 2032
- Figure 76: South America Wheelchair Market Volume (K Unit), by Application 2024 & 2032
- Figure 77: South America Wheelchair Market Revenue Share (%), by Application 2024 & 2032
- Figure 78: South America Wheelchair Market Volume Share (%), by Application 2024 & 2032
- Figure 79: South America Wheelchair Market Revenue (Million), by Country 2024 & 2032
- Figure 80: South America Wheelchair Market Volume (K Unit), by Country 2024 & 2032
- Figure 81: South America Wheelchair Market Revenue Share (%), by Country 2024 & 2032
- Figure 82: South America Wheelchair Market Volume Share (%), by Country 2024 & 2032
List of Tables
- Table 1: Global Wheelchair Market Revenue Million Forecast, by Region 2019 & 2032
- Table 2: Global Wheelchair Market Volume K Unit Forecast, by Region 2019 & 2032
- Table 3: Global Wheelchair Market Revenue Million Forecast, by Product Type 2019 & 2032
- Table 4: Global Wheelchair Market Volume K Unit Forecast, by Product Type 2019 & 2032
- Table 5: Global Wheelchair Market Revenue Million Forecast, by Application 2019 & 2032
- Table 6: Global Wheelchair Market Volume K Unit Forecast, by Application 2019 & 2032
- Table 7: Global Wheelchair Market Revenue Million Forecast, by Region 2019 & 2032
- Table 8: Global Wheelchair Market Volume K Unit Forecast, by Region 2019 & 2032
- Table 9: Global Wheelchair Market Revenue Million Forecast, by Country 2019 & 2032
- Table 10: Global Wheelchair Market Volume K Unit Forecast, by Country 2019 & 2032
- Table 11: United States Wheelchair Market Revenue (Million) Forecast, by Application 2019 & 2032
- Table 12: United States Wheelchair Market Volume (K Unit) Forecast, by Application 2019 & 2032
- Table 13: Canada Wheelchair Market Revenue (Million) Forecast, by Application 2019 & 2032
- Table 14: Canada Wheelchair Market Volume (K Unit) Forecast, by Application 2019 & 2032
- Table 15: Mexico Wheelchair Market Revenue (Million) Forecast, by Application 2019 & 2032
- Table 16: Mexico Wheelchair Market Volume (K Unit) Forecast, by Application 2019 & 2032
- Table 17: Global Wheelchair Market Revenue Million Forecast, by Country 2019 & 2032
- Table 18: Global Wheelchair Market Volume K Unit Forecast, by Country 2019 & 2032
- Table 19: Germany Wheelchair Market Revenue (Million) Forecast, by Application 2019 & 2032
- Table 20: Germany Wheelchair Market Volume (K Unit) Forecast, by Application 2019 & 2032
- Table 21: United Kingdom Wheelchair Market Revenue (Million) Forecast, by Application 2019 & 2032
- Table 22: United Kingdom Wheelchair Market Volume (K Unit) Forecast, by Application 2019 & 2032
- Table 23: France Wheelchair Market Revenue (Million) Forecast, by Application 2019 & 2032
- Table 24: France Wheelchair Market Volume (K Unit) Forecast, by Application 2019 & 2032
- Table 25: Italy Wheelchair Market Revenue (Million) Forecast, by Application 2019 & 2032
- Table 26: Italy Wheelchair Market Volume (K Unit) Forecast, by Application 2019 & 2032
- Table 27: Spain Wheelchair Market Revenue (Million) Forecast, by Application 2019 & 2032
- Table 28: Spain Wheelchair Market Volume (K Unit) Forecast, by Application 2019 & 2032
- Table 29: Rest of Europe Wheelchair Market Revenue (Million) Forecast, by Application 2019 & 2032
- Table 30: Rest of Europe Wheelchair Market Volume (K Unit) Forecast, by Application 2019 & 2032
- Table 31: Global Wheelchair Market Revenue Million Forecast, by Country 2019 & 2032
- Table 32: Global Wheelchair Market Volume K Unit Forecast, by Country 2019 & 2032
- Table 33: China Wheelchair Market Revenue (Million) Forecast, by Application 2019 & 2032
- Table 34: China Wheelchair Market Volume (K Unit) Forecast, by Application 2019 & 2032
- Table 35: Japan Wheelchair Market Revenue (Million) Forecast, by Application 2019 & 2032
- Table 36: Japan Wheelchair Market Volume (K Unit) Forecast, by Application 2019 & 2032
- Table 37: India Wheelchair Market Revenue (Million) Forecast, by Application 2019 & 2032
- Table 38: India Wheelchair Market Volume (K Unit) Forecast, by Application 2019 & 2032
- Table 39: Australia Wheelchair Market Revenue (Million) Forecast, by Application 2019 & 2032
- Table 40: Australia Wheelchair Market Volume (K Unit) Forecast, by Application 2019 & 2032
- Table 41: South Korea Wheelchair Market Revenue (Million) Forecast, by Application 2019 & 2032
- Table 42: South Korea Wheelchair Market Volume (K Unit) Forecast, by Application 2019 & 2032
- Table 43: Rest of Asia Pacific Wheelchair Market Revenue (Million) Forecast, by Application 2019 & 2032
- Table 44: Rest of Asia Pacific Wheelchair Market Volume (K Unit) Forecast, by Application 2019 & 2032
- Table 45: Global Wheelchair Market Revenue Million Forecast, by Country 2019 & 2032
- Table 46: Global Wheelchair Market Volume K Unit Forecast, by Country 2019 & 2032
- Table 47: GCC Wheelchair Market Revenue (Million) Forecast, by Application 2019 & 2032
- Table 48: GCC Wheelchair Market Volume (K Unit) Forecast, by Application 2019 & 2032
- Table 49: South Africa Wheelchair Market Revenue (Million) Forecast, by Application 2019 & 2032
- Table 50: South Africa Wheelchair Market Volume (K Unit) Forecast, by Application 2019 & 2032
- Table 51: Rest of Middle East and Africa Wheelchair Market Revenue (Million) Forecast, by Application 2019 & 2032
- Table 52: Rest of Middle East and Africa Wheelchair Market Volume (K Unit) Forecast, by Application 2019 & 2032
- Table 53: Global Wheelchair Market Revenue Million Forecast, by Country 2019 & 2032
- Table 54: Global Wheelchair Market Volume K Unit Forecast, by Country 2019 & 2032
- Table 55: Brazil Wheelchair Market Revenue (Million) Forecast, by Application 2019 & 2032
- Table 56: Brazil Wheelchair Market Volume (K Unit) Forecast, by Application 2019 & 2032
- Table 57: Argentina Wheelchair Market Revenue (Million) Forecast, by Application 2019 & 2032
- Table 58: Argentina Wheelchair Market Volume (K Unit) Forecast, by Application 2019 & 2032
- Table 59: Rest of South America Wheelchair Market Revenue (Million) Forecast, by Application 2019 & 2032
- Table 60: Rest of South America Wheelchair Market Volume (K Unit) Forecast, by Application 2019 & 2032
- Table 61: Global Wheelchair Market Revenue Million Forecast, by Product Type 2019 & 2032
- Table 62: Global Wheelchair Market Volume K Unit Forecast, by Product Type 2019 & 2032
- Table 63: Global Wheelchair Market Revenue Million Forecast, by Application 2019 & 2032
- Table 64: Global Wheelchair Market Volume K Unit Forecast, by Application 2019 & 2032
- Table 65: Global Wheelchair Market Revenue Million Forecast, by Country 2019 & 2032
- Table 66: Global Wheelchair Market Volume K Unit Forecast, by Country 2019 & 2032
- Table 67: United States Wheelchair Market Revenue (Million) Forecast, by Application 2019 & 2032
- Table 68: United States Wheelchair Market Volume (K Unit) Forecast, by Application 2019 & 2032
- Table 69: Canada Wheelchair Market Revenue (Million) Forecast, by Application 2019 & 2032
- Table 70: Canada Wheelchair Market Volume (K Unit) Forecast, by Application 2019 & 2032
- Table 71: Mexico Wheelchair Market Revenue (Million) Forecast, by Application 2019 & 2032
- Table 72: Mexico Wheelchair Market Volume (K Unit) Forecast, by Application 2019 & 2032
- Table 73: Global Wheelchair Market Revenue Million Forecast, by Product Type 2019 & 2032
- Table 74: Global Wheelchair Market Volume K Unit Forecast, by Product Type 2019 & 2032
- Table 75: Global Wheelchair Market Revenue Million Forecast, by Application 2019 & 2032
- Table 76: Global Wheelchair Market Volume K Unit Forecast, by Application 2019 & 2032
- Table 77: Global Wheelchair Market Revenue Million Forecast, by Country 2019 & 2032
- Table 78: Global Wheelchair Market Volume K Unit Forecast, by Country 2019 & 2032
- Table 79: Germany Wheelchair Market Revenue (Million) Forecast, by Application 2019 & 2032
- Table 80: Germany Wheelchair Market Volume (K Unit) Forecast, by Application 2019 & 2032
- Table 81: United Kingdom Wheelchair Market Revenue (Million) Forecast, by Application 2019 & 2032
- Table 82: United Kingdom Wheelchair Market Volume (K Unit) Forecast, by Application 2019 & 2032
- Table 83: France Wheelchair Market Revenue (Million) Forecast, by Application 2019 & 2032
- Table 84: France Wheelchair Market Volume (K Unit) Forecast, by Application 2019 & 2032
- Table 85: Italy Wheelchair Market Revenue (Million) Forecast, by Application 2019 & 2032
- Table 86: Italy Wheelchair Market Volume (K Unit) Forecast, by Application 2019 & 2032
- Table 87: Spain Wheelchair Market Revenue (Million) Forecast, by Application 2019 & 2032
- Table 88: Spain Wheelchair Market Volume (K Unit) Forecast, by Application 2019 & 2032
- Table 89: Rest of Europe Wheelchair Market Revenue (Million) Forecast, by Application 2019 & 2032
- Table 90: Rest of Europe Wheelchair Market Volume (K Unit) Forecast, by Application 2019 & 2032
- Table 91: Global Wheelchair Market Revenue Million Forecast, by Product Type 2019 & 2032
- Table 92: Global Wheelchair Market Volume K Unit Forecast, by Product Type 2019 & 2032
- Table 93: Global Wheelchair Market Revenue Million Forecast, by Application 2019 & 2032
- Table 94: Global Wheelchair Market Volume K Unit Forecast, by Application 2019 & 2032
- Table 95: Global Wheelchair Market Revenue Million Forecast, by Country 2019 & 2032
- Table 96: Global Wheelchair Market Volume K Unit Forecast, by Country 2019 & 2032
- Table 97: China Wheelchair Market Revenue (Million) Forecast, by Application 2019 & 2032
- Table 98: China Wheelchair Market Volume (K Unit) Forecast, by Application 2019 & 2032
- Table 99: Japan Wheelchair Market Revenue (Million) Forecast, by Application 2019 & 2032
- Table 100: Japan Wheelchair Market Volume (K Unit) Forecast, by Application 2019 & 2032
- Table 101: India Wheelchair Market Revenue (Million) Forecast, by Application 2019 & 2032
- Table 102: India Wheelchair Market Volume (K Unit) Forecast, by Application 2019 & 2032
- Table 103: Australia Wheelchair Market Revenue (Million) Forecast, by Application 2019 & 2032
- Table 104: Australia Wheelchair Market Volume (K Unit) Forecast, by Application 2019 & 2032
- Table 105: South Korea Wheelchair Market Revenue (Million) Forecast, by Application 2019 & 2032
- Table 106: South Korea Wheelchair Market Volume (K Unit) Forecast, by Application 2019 & 2032
- Table 107: Rest of Asia Pacific Wheelchair Market Revenue (Million) Forecast, by Application 2019 & 2032
- Table 108: Rest of Asia Pacific Wheelchair Market Volume (K Unit) Forecast, by Application 2019 & 2032
- Table 109: Global Wheelchair Market Revenue Million Forecast, by Product Type 2019 & 2032
- Table 110: Global Wheelchair Market Volume K Unit Forecast, by Product Type 2019 & 2032
- Table 111: Global Wheelchair Market Revenue Million Forecast, by Application 2019 & 2032
- Table 112: Global Wheelchair Market Volume K Unit Forecast, by Application 2019 & 2032
- Table 113: Global Wheelchair Market Revenue Million Forecast, by Country 2019 & 2032
- Table 114: Global Wheelchair Market Volume K Unit Forecast, by Country 2019 & 2032
- Table 115: GCC Wheelchair Market Revenue (Million) Forecast, by Application 2019 & 2032
- Table 116: GCC Wheelchair Market Volume (K Unit) Forecast, by Application 2019 & 2032
- Table 117: South Africa Wheelchair Market Revenue (Million) Forecast, by Application 2019 & 2032
- Table 118: South Africa Wheelchair Market Volume (K Unit) Forecast, by Application 2019 & 2032
- Table 119: Rest of Middle East and Africa Wheelchair Market Revenue (Million) Forecast, by Application 2019 & 2032
- Table 120: Rest of Middle East and Africa Wheelchair Market Volume (K Unit) Forecast, by Application 2019 & 2032
- Table 121: Global Wheelchair Market Revenue Million Forecast, by Product Type 2019 & 2032
- Table 122: Global Wheelchair Market Volume K Unit Forecast, by Product Type 2019 & 2032
- Table 123: Global Wheelchair Market Revenue Million Forecast, by Application 2019 & 2032
- Table 124: Global Wheelchair Market Volume K Unit Forecast, by Application 2019 & 2032
- Table 125: Global Wheelchair Market Revenue Million Forecast, by Country 2019 & 2032
- Table 126: Global Wheelchair Market Volume K Unit Forecast, by Country 2019 & 2032
- Table 127: Brazil Wheelchair Market Revenue (Million) Forecast, by Application 2019 & 2032
- Table 128: Brazil Wheelchair Market Volume (K Unit) Forecast, by Application 2019 & 2032
- Table 129: Argentina Wheelchair Market Revenue (Million) Forecast, by Application 2019 & 2032
- Table 130: Argentina Wheelchair Market Volume (K Unit) Forecast, by Application 2019 & 2032
- Table 131: Rest of South America Wheelchair Market Revenue (Million) Forecast, by Application 2019 & 2032
- Table 132: Rest of South America Wheelchair Market Volume (K Unit) Forecast, by Application 2019 & 2032
Frequently Asked Questions
1. What is the projected Compound Annual Growth Rate (CAGR) of the Wheelchair Market?
The projected CAGR is approximately 4.40%.
2. Which companies are prominent players in the Wheelchair Market?
Key companies in the market include Top End, Meyra GmbH, Sportaid, Numotion, Ki Mobility, Permobil, Mountain Trike, Sunrise Medical, PER4MAX Medical, Karman Healthcare.
3. What are the main segments of the Wheelchair Market?
The market segments include Product Type, Application.
4. Can you provide details about the market size?
The market size is estimated to be USD XX Million as of 2022.
5. What are some drivers contributing to market growth?
Increasing Global Geriatric Population; Increasing Technological Innovations.
6. What are the notable trends driving market growth?
The Cerebral Palsy Segment is Expected to Hold a Major Market Share.
7. Are there any restraints impacting market growth?
Lesser Adoption in Middle- and Low-income Countries.
8. Can you provide examples of recent developments in the market?
In October 2021, Numotion announced a five-year strategic partnership with Team Gleason to improve access and development of technology and advanced equipment for people affected by Amyotrophic Lateral Sclerosis (ALS). Team Gleason, through Numotion, has provided over 400 wheelchair lifts over 2020.
9. What pricing options are available for accessing the report?
Pricing options include single-user, multi-user, and enterprise licenses priced at USD 4750, USD 5250, and USD 8750 respectively.
10. Is the market size provided in terms of value or volume?
The market size is provided in terms of value, measured in Million and volume, measured in K Unit.
11. Are there any specific market keywords associated with the report?
Yes, the market keyword associated with the report is "Wheelchair Market," which aids in identifying and referencing the specific market segment covered.
12. How do I determine which pricing option suits my needs best?
The pricing options vary based on user requirements and access needs. Individual users may opt for single-user licenses, while businesses requiring broader access may choose multi-user or enterprise licenses for cost-effective access to the report.
13. Are there any additional resources or data provided in the Wheelchair Market report?
While the report offers comprehensive insights, it's advisable to review the specific contents or supplementary materials provided to ascertain if additional resources or data are available.
14. How can I stay updated on further developments or reports in the Wheelchair Market?
To stay informed about further developments, trends, and reports in the Wheelchair Market, consider subscribing to industry newsletters, following relevant companies and organizations, or regularly checking reputable industry news sources and publications.
Methodology
Step 1 - Identification of Relevant Samples Size from Population Database


Step 2 - Approaches for Defining Global Market Size (Value, Volume* & Price*)

Note*: In applicable scenarios
Step 3 - Data Sources
Primary Research
- Web Analytics
- Survey Reports
- Research Institute
- Latest Research Reports
- Opinion Leaders
Secondary Research
- Annual Reports
- White Paper
- Latest Press Release
- Industry Association
- Paid Database
- Investor Presentations

Step 4 - Data Triangulation
Involves using different sources of information in order to increase the validity of a study
These sources are likely to be stakeholders in a program - participants, other researchers, program staff, other community members, and so on.
Then we put all data in single framework & apply various statistical tools to find out the dynamic on the market.
During the analysis stage, feedback from the stakeholder groups would be compared to determine areas of agreement as well as areas of divergence


