
Key Insights
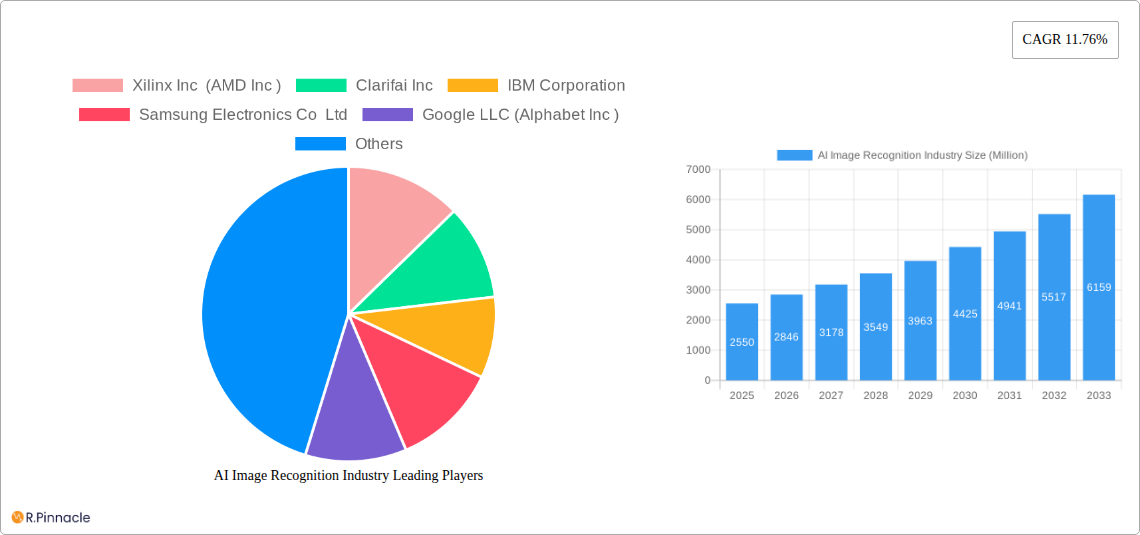
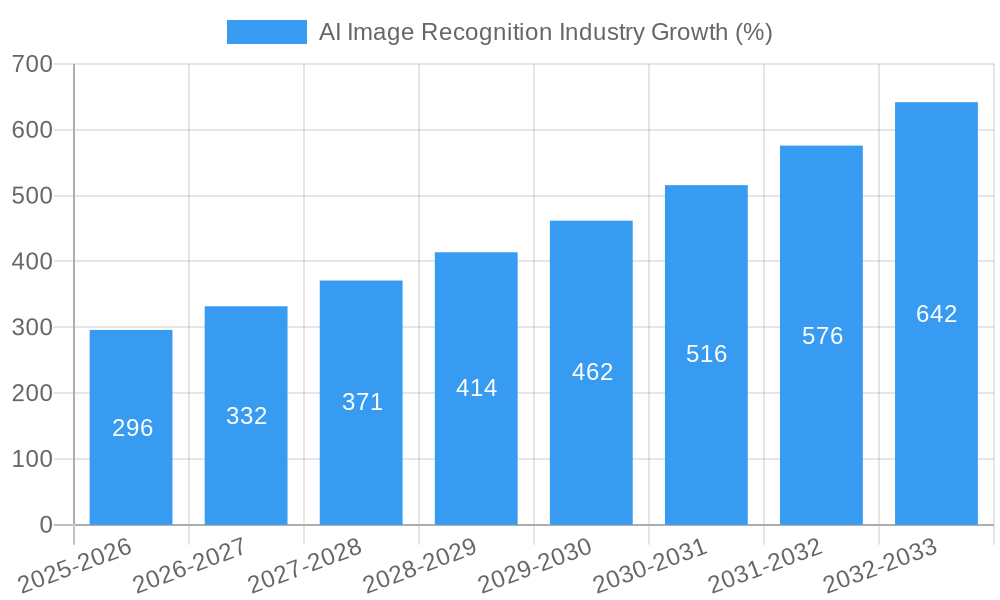
The AI image recognition market is experiencing robust growth, projected to reach \$2.55 billion in 2025 and expand significantly over the forecast period (2025-2033). A Compound Annual Growth Rate (CAGR) of 11.76% indicates a dynamic market driven by several key factors. Increasing adoption across diverse sectors like automotive (autonomous driving, advanced driver-assistance systems), BFSI (fraud detection, KYC/AML compliance), and healthcare (medical image analysis, disease diagnosis) fuels this expansion. Technological advancements, including improved algorithms, enhanced processing power, and the proliferation of edge computing, contribute significantly to market growth. Furthermore, the rising availability of labeled datasets for training AI models and increasing investments in research and development further accelerate market penetration. The market is segmented by type (hardware, software, services) and end-user vertical, reflecting the diverse applications of AI image recognition technology. Competitive landscape is dominated by major technology players like Xilinx (AMD), Clarifai, IBM, Samsung, Google, Microsoft, Qualcomm, Amazon Web Services, Micron, Nvidia, and Intel, each contributing to innovation and market expansion through continuous product development and strategic partnerships.
Despite this positive outlook, certain restraints could influence the market's trajectory. High implementation costs, especially for sophisticated applications requiring specialized hardware and extensive data processing, could hinder adoption in certain sectors. Data privacy and security concerns, particularly in sensitive applications like healthcare and BFSI, also represent challenges that need to be addressed through robust security measures and ethical guidelines. The market's future success hinges on overcoming these challenges and leveraging the continued advancements in AI technology and data availability to unlock new opportunities across various sectors. Future growth will likely be propelled by innovations in real-time image recognition, improved accuracy in object detection, and the integration of AI image recognition into increasingly diverse applications. Expansion into emerging economies, with their growing digitalization and increasing demand for technological solutions, offers further potential for market expansion.
AI Image Recognition Industry Market Report: 2019-2033
This comprehensive report provides an in-depth analysis of the AI Image Recognition industry, projecting a market value exceeding xx Million by 2033. It covers market structure, dynamics, leading players, key segments, and future outlook, offering actionable insights for industry professionals and investors. The study period spans 2019-2033, with 2025 serving as the base and estimated year. The report leverages data from the historical period (2019-2024) and forecasts market trends until 2033.
AI Image Recognition Industry Market Structure & Innovation Trends
The AI Image Recognition market is characterized by a dynamic interplay of established tech giants and innovative startups. Market concentration is moderate, with several key players holding significant market share, estimated at xx Million in 2025. However, the market exhibits high innovation, driven by advancements in deep learning, computer vision, and edge computing. Regulatory frameworks, particularly concerning data privacy and security, are evolving and influencing market dynamics. Product substitutes, like traditional image analysis techniques, are gradually losing market share due to AI's superior accuracy and efficiency.
- Market Share (2025, estimated): Google LLC (xx%), Microsoft Corporation (xx%), Amazon Web Services Inc (xx%), others (xx%).
- M&A Activity (2019-2024): The total value of M&A deals exceeded xx Million, signifying strong consolidation within the sector. Notable deals included acquisitions focused on enhancing AI capabilities and expanding into new market segments.
AI Image Recognition Industry Market Dynamics & Trends
The AI Image Recognition market exhibits robust growth, driven by escalating demand across diverse sectors, including automotive, healthcare, and security. The compound annual growth rate (CAGR) is projected to be xx% from 2025 to 2033. Technological disruptions, such as the proliferation of powerful GPUs and cloud-based AI platforms, are fueling innovation and market penetration. Consumer preferences are shifting towards AI-powered solutions that offer enhanced accuracy, speed, and convenience. The competitive landscape is intensely competitive, with companies vying for market share through product differentiation, strategic partnerships, and aggressive R&D investments. Market penetration is expected to reach xx% by 2033.
Dominant Regions & Segments in AI Image Recognition Industry
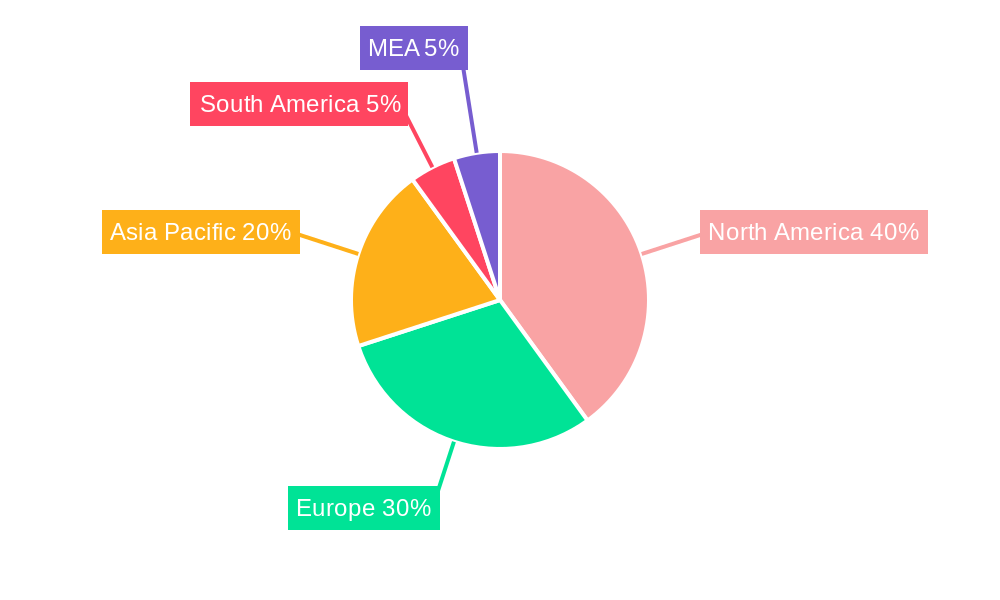
North America currently dominates the AI Image Recognition market, driven by a robust technology infrastructure, significant R&D investments, and early adoption of AI technologies. Within the segments:
By Type: The software segment currently holds the largest market share, but hardware is experiencing significant growth due to increasing demand for specialized AI processors. Services are gaining traction due to their scalability and cost-effectiveness.
By End-user Verticals: The healthcare and security sectors demonstrate exceptional growth potential owing to the increasing integration of AI-powered diagnostic tools and security systems. The automotive sector is also a major driver, propelled by the rise of autonomous vehicles. Other sectors like BFSI and retail are exhibiting significant adoption rates.
Key Drivers (North America):
- Strong government support for AI research and development.
- Presence of leading technology companies and research institutions.
- Well-developed IT infrastructure and high internet penetration.
AI Image Recognition Industry Product Innovations
Recent innovations encompass advanced deep learning algorithms, improved hardware accelerators, and the development of specialized AI chips designed for image recognition tasks. These advancements are enabling real-time processing of high-resolution images and enhanced accuracy in object detection and classification. Companies are focusing on developing AI solutions that are easily integrable into existing systems and offer user-friendly interfaces. This focus on ease of use and integration is crucial for wider market adoption.
Report Scope & Segmentation Analysis
The report meticulously segments the AI Image Recognition market by type (Hardware, Software, Services) and end-user verticals (Automotive, BFSI, Healthcare, Retail, Security, Other End-user Verticals). Each segment's growth projections, market size estimations, and competitive landscape are analyzed individually. The Automotive segment is projected for significant growth, driven by the increasing adoption of ADAS features. The Healthcare segment displays a high growth potential because of demand for AI-powered diagnostics.
Key Drivers of AI Image Recognition Industry Growth
The AI Image Recognition market's growth is propelled by several key factors:
- Technological Advancements: Improvements in deep learning algorithms, computer vision techniques, and specialized hardware are enhancing the accuracy and speed of image recognition.
- Increasing Data Availability: The exponential growth of digital images and videos fuels the development and training of robust AI models.
- Government Initiatives: Government support for AI research and development, coupled with favorable regulatory frameworks, is accelerating market growth.
Challenges in the AI Image Recognition Industry Sector
The industry faces challenges like:
- Data Privacy and Security Concerns: The use of sensitive data raises concerns about privacy breaches and the potential misuse of information.
- High Computational Costs: Training and deploying advanced AI models can be computationally expensive, limiting accessibility for some businesses.
- Lack of Skilled Professionals: A shortage of skilled professionals with expertise in AI and machine learning hinders the industry's development.
Emerging Opportunities in AI Image Recognition Industry
Emerging opportunities include:
- Expansion into New Verticals: The application of AI image recognition is expanding into sectors like agriculture, manufacturing, and environmental monitoring.
- Development of Novel Applications: New applications, such as AI-powered medical imaging analysis and advanced surveillance systems, are continuously being developed.
- Integration with IoT Devices: AI image recognition is increasingly integrated with IoT devices, expanding the potential applications and data sources.
Leading Players in the AI Image Recognition Industry Market
- Xilinx Inc (AMD Inc )
- Clarifai Inc
- IBM Corporation
- Samsung Electronics Co Ltd
- Google LLC (Alphabet Inc )
- Microsoft Corporation
- Qualcomm Incorporated
- Amazon Web Services Inc (Amazon Com Inc )
- Micron Technologies Inc
- Nvidia Corporation
- Intel Corporation
Key Developments in AI Image Recognition Industry Industry
- September 2022: Samsung Medison showcased its HERA W10 ultrasound system with AI diagnostic solutions at the ISUOG World Congress, highlighting the growing integration of AI in medical imaging.
- September 2022: Alcatraz AI secured USD 25 Million in Series A funding, indicating strong investor confidence in AI-powered security solutions.
Future Outlook for AI Image Recognition Industry Market
The AI Image Recognition market is poised for continued expansion, driven by technological advancements, increasing demand across diverse sectors, and favorable regulatory environments. Strategic partnerships, acquisitions, and innovation in areas such as edge computing and low-power AI will shape the industry's future. The market is expected to witness significant growth opportunities as more organizations embrace AI-powered solutions to enhance efficiency, accuracy, and decision-making.
AI Image Recognition Industry Segmentation
-
1. Type
- 1.1. Hardware
- 1.2. Software
- 1.3. Services
-
2. End-user Verticals
- 2.1. Automotive
- 2.2. BFSI
- 2.3. Healthcare
- 2.4. Retail
- 2.5. Security
- 2.6. Other End-user Verticals
AI Image Recognition Industry Segmentation By Geography
- 1. North America
- 2. Europe
- 3. Asia
- 4. Australia and New Zealand
- 5. Latin America
- 6. Middle East and Africa
AI Image Recognition Industry REPORT HIGHLIGHTS
| Aspects | Details |
|---|---|
| Study Period | 2019-2033 |
| Base Year | 2024 |
| Estimated Year | 2025 |
| Forecast Period | 2025-2033 |
| Historical Period | 2019-2024 |
| Growth Rate | CAGR of 11.76% from 2019-2033 |
| Segmentation |
|
Table of Contents
- 1. Introduction
- 1.1. Research Scope
- 1.2. Market Segmentation
- 1.3. Research Methodology
- 1.4. Definitions and Assumptions
- 2. Executive Summary
- 2.1. Introduction
- 3. Market Dynamics
- 3.1. Introduction
- 3.2. Market Drivers
- 3.2.1. Growing AI Adoption; Increasing Use of Big Data Analytics; Declining Costs of Hardware
- 3.3. Market Restrains
- 3.3.1. Lack of Technical Expertise
- 3.4. Market Trends
- 3.4.1. Healthcare Sector is Expected to Witness Significant Growth
- 4. Market Factor Analysis
- 4.1. Porters Five Forces
- 4.2. Supply/Value Chain
- 4.3. PESTEL analysis
- 4.4. Market Entropy
- 4.5. Patent/Trademark Analysis
- 5. Global AI Image Recognition Industry Analysis, Insights and Forecast, 2019-2031
- 5.1. Market Analysis, Insights and Forecast - by Type
- 5.1.1. Hardware
- 5.1.2. Software
- 5.1.3. Services
- 5.2. Market Analysis, Insights and Forecast - by End-user Verticals
- 5.2.1. Automotive
- 5.2.2. BFSI
- 5.2.3. Healthcare
- 5.2.4. Retail
- 5.2.5. Security
- 5.2.6. Other End-user Verticals
- 5.3. Market Analysis, Insights and Forecast - by Region
- 5.3.1. North America
- 5.3.2. Europe
- 5.3.3. Asia
- 5.3.4. Australia and New Zealand
- 5.3.5. Latin America
- 5.3.6. Middle East and Africa
- 5.1. Market Analysis, Insights and Forecast - by Type
- 6. North America AI Image Recognition Industry Analysis, Insights and Forecast, 2019-2031
- 6.1. Market Analysis, Insights and Forecast - by Type
- 6.1.1. Hardware
- 6.1.2. Software
- 6.1.3. Services
- 6.2. Market Analysis, Insights and Forecast - by End-user Verticals
- 6.2.1. Automotive
- 6.2.2. BFSI
- 6.2.3. Healthcare
- 6.2.4. Retail
- 6.2.5. Security
- 6.2.6. Other End-user Verticals
- 6.1. Market Analysis, Insights and Forecast - by Type
- 7. Europe AI Image Recognition Industry Analysis, Insights and Forecast, 2019-2031
- 7.1. Market Analysis, Insights and Forecast - by Type
- 7.1.1. Hardware
- 7.1.2. Software
- 7.1.3. Services
- 7.2. Market Analysis, Insights and Forecast - by End-user Verticals
- 7.2.1. Automotive
- 7.2.2. BFSI
- 7.2.3. Healthcare
- 7.2.4. Retail
- 7.2.5. Security
- 7.2.6. Other End-user Verticals
- 7.1. Market Analysis, Insights and Forecast - by Type
- 8. Asia AI Image Recognition Industry Analysis, Insights and Forecast, 2019-2031
- 8.1. Market Analysis, Insights and Forecast - by Type
- 8.1.1. Hardware
- 8.1.2. Software
- 8.1.3. Services
- 8.2. Market Analysis, Insights and Forecast - by End-user Verticals
- 8.2.1. Automotive
- 8.2.2. BFSI
- 8.2.3. Healthcare
- 8.2.4. Retail
- 8.2.5. Security
- 8.2.6. Other End-user Verticals
- 8.1. Market Analysis, Insights and Forecast - by Type
- 9. Australia and New Zealand AI Image Recognition Industry Analysis, Insights and Forecast, 2019-2031
- 9.1. Market Analysis, Insights and Forecast - by Type
- 9.1.1. Hardware
- 9.1.2. Software
- 9.1.3. Services
- 9.2. Market Analysis, Insights and Forecast - by End-user Verticals
- 9.2.1. Automotive
- 9.2.2. BFSI
- 9.2.3. Healthcare
- 9.2.4. Retail
- 9.2.5. Security
- 9.2.6. Other End-user Verticals
- 9.1. Market Analysis, Insights and Forecast - by Type
- 10. Latin America AI Image Recognition Industry Analysis, Insights and Forecast, 2019-2031
- 10.1. Market Analysis, Insights and Forecast - by Type
- 10.1.1. Hardware
- 10.1.2. Software
- 10.1.3. Services
- 10.2. Market Analysis, Insights and Forecast - by End-user Verticals
- 10.2.1. Automotive
- 10.2.2. BFSI
- 10.2.3. Healthcare
- 10.2.4. Retail
- 10.2.5. Security
- 10.2.6. Other End-user Verticals
- 10.1. Market Analysis, Insights and Forecast - by Type
- 11. Middle East and Africa AI Image Recognition Industry Analysis, Insights and Forecast, 2019-2031
- 11.1. Market Analysis, Insights and Forecast - by Type
- 11.1.1. Hardware
- 11.1.2. Software
- 11.1.3. Services
- 11.2. Market Analysis, Insights and Forecast - by End-user Verticals
- 11.2.1. Automotive
- 11.2.2. BFSI
- 11.2.3. Healthcare
- 11.2.4. Retail
- 11.2.5. Security
- 11.2.6. Other End-user Verticals
- 11.1. Market Analysis, Insights and Forecast - by Type
- 12. North America AI Image Recognition Industry Analysis, Insights and Forecast, 2019-2031
- 12.1. Market Analysis, Insights and Forecast - By Country/Sub-region
- 12.1.1 United States
- 12.1.2 Canada
- 12.1.3 Mexico
- 13. Europe AI Image Recognition Industry Analysis, Insights and Forecast, 2019-2031
- 13.1. Market Analysis, Insights and Forecast - By Country/Sub-region
- 13.1.1 Germany
- 13.1.2 United Kingdom
- 13.1.3 France
- 13.1.4 Spain
- 13.1.5 Italy
- 13.1.6 Spain
- 13.1.7 Belgium
- 13.1.8 Netherland
- 13.1.9 Nordics
- 13.1.10 Rest of Europe
- 14. Asia Pacific AI Image Recognition Industry Analysis, Insights and Forecast, 2019-2031
- 14.1. Market Analysis, Insights and Forecast - By Country/Sub-region
- 14.1.1 China
- 14.1.2 Japan
- 14.1.3 India
- 14.1.4 South Korea
- 14.1.5 Southeast Asia
- 14.1.6 Australia
- 14.1.7 Indonesia
- 14.1.8 Phillipes
- 14.1.9 Singapore
- 14.1.10 Thailandc
- 14.1.11 Rest of Asia Pacific
- 15. South America AI Image Recognition Industry Analysis, Insights and Forecast, 2019-2031
- 15.1. Market Analysis, Insights and Forecast - By Country/Sub-region
- 15.1.1 Brazil
- 15.1.2 Argentina
- 15.1.3 Peru
- 15.1.4 Chile
- 15.1.5 Colombia
- 15.1.6 Ecuador
- 15.1.7 Venezuela
- 15.1.8 Rest of South America
- 16. North America AI Image Recognition Industry Analysis, Insights and Forecast, 2019-2031
- 16.1. Market Analysis, Insights and Forecast - By Country/Sub-region
- 16.1.1 United States
- 16.1.2 Canada
- 16.1.3 Mexico
- 17. MEA AI Image Recognition Industry Analysis, Insights and Forecast, 2019-2031
- 17.1. Market Analysis, Insights and Forecast - By Country/Sub-region
- 17.1.1 United Arab Emirates
- 17.1.2 Saudi Arabia
- 17.1.3 South Africa
- 17.1.4 Rest of Middle East and Africa
- 18. Competitive Analysis
- 18.1. Global Market Share Analysis 2024
- 18.2. Company Profiles
- 18.2.1 Xilinx Inc (AMD Inc )
- 18.2.1.1. Overview
- 18.2.1.2. Products
- 18.2.1.3. SWOT Analysis
- 18.2.1.4. Recent Developments
- 18.2.1.5. Financials (Based on Availability)
- 18.2.2 Clarifai Inc
- 18.2.2.1. Overview
- 18.2.2.2. Products
- 18.2.2.3. SWOT Analysis
- 18.2.2.4. Recent Developments
- 18.2.2.5. Financials (Based on Availability)
- 18.2.3 IBM Corporation
- 18.2.3.1. Overview
- 18.2.3.2. Products
- 18.2.3.3. SWOT Analysis
- 18.2.3.4. Recent Developments
- 18.2.3.5. Financials (Based on Availability)
- 18.2.4 Samsung Electronics Co Ltd
- 18.2.4.1. Overview
- 18.2.4.2. Products
- 18.2.4.3. SWOT Analysis
- 18.2.4.4. Recent Developments
- 18.2.4.5. Financials (Based on Availability)
- 18.2.5 Google LLC (Alphabet Inc )
- 18.2.5.1. Overview
- 18.2.5.2. Products
- 18.2.5.3. SWOT Analysis
- 18.2.5.4. Recent Developments
- 18.2.5.5. Financials (Based on Availability)
- 18.2.6 Microsoft Corporation
- 18.2.6.1. Overview
- 18.2.6.2. Products
- 18.2.6.3. SWOT Analysis
- 18.2.6.4. Recent Developments
- 18.2.6.5. Financials (Based on Availability)
- 18.2.7 Qualcomm Incorporated
- 18.2.7.1. Overview
- 18.2.7.2. Products
- 18.2.7.3. SWOT Analysis
- 18.2.7.4. Recent Developments
- 18.2.7.5. Financials (Based on Availability)
- 18.2.8 Amazon Web Services Inc (Amazon Com Inc )
- 18.2.8.1. Overview
- 18.2.8.2. Products
- 18.2.8.3. SWOT Analysis
- 18.2.8.4. Recent Developments
- 18.2.8.5. Financials (Based on Availability)
- 18.2.9 Micron Technologies Inc
- 18.2.9.1. Overview
- 18.2.9.2. Products
- 18.2.9.3. SWOT Analysis
- 18.2.9.4. Recent Developments
- 18.2.9.5. Financials (Based on Availability)
- 18.2.10 Nvidia Corporation
- 18.2.10.1. Overview
- 18.2.10.2. Products
- 18.2.10.3. SWOT Analysis
- 18.2.10.4. Recent Developments
- 18.2.10.5. Financials (Based on Availability)
- 18.2.11 Intel Corporation
- 18.2.11.1. Overview
- 18.2.11.2. Products
- 18.2.11.3. SWOT Analysis
- 18.2.11.4. Recent Developments
- 18.2.11.5. Financials (Based on Availability)
- 18.2.1 Xilinx Inc (AMD Inc )
List of Figures
- Figure 1: Global AI Image Recognition Industry Revenue Breakdown (Million, %) by Region 2024 & 2032
- Figure 2: Global AI Image Recognition Industry Volume Breakdown (K Unit, %) by Region 2024 & 2032
- Figure 3: North America AI Image Recognition Industry Revenue (Million), by Country 2024 & 2032
- Figure 4: North America AI Image Recognition Industry Volume (K Unit), by Country 2024 & 2032
- Figure 5: North America AI Image Recognition Industry Revenue Share (%), by Country 2024 & 2032
- Figure 6: North America AI Image Recognition Industry Volume Share (%), by Country 2024 & 2032
- Figure 7: Europe AI Image Recognition Industry Revenue (Million), by Country 2024 & 2032
- Figure 8: Europe AI Image Recognition Industry Volume (K Unit), by Country 2024 & 2032
- Figure 9: Europe AI Image Recognition Industry Revenue Share (%), by Country 2024 & 2032
- Figure 10: Europe AI Image Recognition Industry Volume Share (%), by Country 2024 & 2032
- Figure 11: Asia Pacific AI Image Recognition Industry Revenue (Million), by Country 2024 & 2032
- Figure 12: Asia Pacific AI Image Recognition Industry Volume (K Unit), by Country 2024 & 2032
- Figure 13: Asia Pacific AI Image Recognition Industry Revenue Share (%), by Country 2024 & 2032
- Figure 14: Asia Pacific AI Image Recognition Industry Volume Share (%), by Country 2024 & 2032
- Figure 15: South America AI Image Recognition Industry Revenue (Million), by Country 2024 & 2032
- Figure 16: South America AI Image Recognition Industry Volume (K Unit), by Country 2024 & 2032
- Figure 17: South America AI Image Recognition Industry Revenue Share (%), by Country 2024 & 2032
- Figure 18: South America AI Image Recognition Industry Volume Share (%), by Country 2024 & 2032
- Figure 19: North America AI Image Recognition Industry Revenue (Million), by Country 2024 & 2032
- Figure 20: North America AI Image Recognition Industry Volume (K Unit), by Country 2024 & 2032
- Figure 21: North America AI Image Recognition Industry Revenue Share (%), by Country 2024 & 2032
- Figure 22: North America AI Image Recognition Industry Volume Share (%), by Country 2024 & 2032
- Figure 23: MEA AI Image Recognition Industry Revenue (Million), by Country 2024 & 2032
- Figure 24: MEA AI Image Recognition Industry Volume (K Unit), by Country 2024 & 2032
- Figure 25: MEA AI Image Recognition Industry Revenue Share (%), by Country 2024 & 2032
- Figure 26: MEA AI Image Recognition Industry Volume Share (%), by Country 2024 & 2032
- Figure 27: North America AI Image Recognition Industry Revenue (Million), by Type 2024 & 2032
- Figure 28: North America AI Image Recognition Industry Volume (K Unit), by Type 2024 & 2032
- Figure 29: North America AI Image Recognition Industry Revenue Share (%), by Type 2024 & 2032
- Figure 30: North America AI Image Recognition Industry Volume Share (%), by Type 2024 & 2032
- Figure 31: North America AI Image Recognition Industry Revenue (Million), by End-user Verticals 2024 & 2032
- Figure 32: North America AI Image Recognition Industry Volume (K Unit), by End-user Verticals 2024 & 2032
- Figure 33: North America AI Image Recognition Industry Revenue Share (%), by End-user Verticals 2024 & 2032
- Figure 34: North America AI Image Recognition Industry Volume Share (%), by End-user Verticals 2024 & 2032
- Figure 35: North America AI Image Recognition Industry Revenue (Million), by Country 2024 & 2032
- Figure 36: North America AI Image Recognition Industry Volume (K Unit), by Country 2024 & 2032
- Figure 37: North America AI Image Recognition Industry Revenue Share (%), by Country 2024 & 2032
- Figure 38: North America AI Image Recognition Industry Volume Share (%), by Country 2024 & 2032
- Figure 39: Europe AI Image Recognition Industry Revenue (Million), by Type 2024 & 2032
- Figure 40: Europe AI Image Recognition Industry Volume (K Unit), by Type 2024 & 2032
- Figure 41: Europe AI Image Recognition Industry Revenue Share (%), by Type 2024 & 2032
- Figure 42: Europe AI Image Recognition Industry Volume Share (%), by Type 2024 & 2032
- Figure 43: Europe AI Image Recognition Industry Revenue (Million), by End-user Verticals 2024 & 2032
- Figure 44: Europe AI Image Recognition Industry Volume (K Unit), by End-user Verticals 2024 & 2032
- Figure 45: Europe AI Image Recognition Industry Revenue Share (%), by End-user Verticals 2024 & 2032
- Figure 46: Europe AI Image Recognition Industry Volume Share (%), by End-user Verticals 2024 & 2032
- Figure 47: Europe AI Image Recognition Industry Revenue (Million), by Country 2024 & 2032
- Figure 48: Europe AI Image Recognition Industry Volume (K Unit), by Country 2024 & 2032
- Figure 49: Europe AI Image Recognition Industry Revenue Share (%), by Country 2024 & 2032
- Figure 50: Europe AI Image Recognition Industry Volume Share (%), by Country 2024 & 2032
- Figure 51: Asia AI Image Recognition Industry Revenue (Million), by Type 2024 & 2032
- Figure 52: Asia AI Image Recognition Industry Volume (K Unit), by Type 2024 & 2032
- Figure 53: Asia AI Image Recognition Industry Revenue Share (%), by Type 2024 & 2032
- Figure 54: Asia AI Image Recognition Industry Volume Share (%), by Type 2024 & 2032
- Figure 55: Asia AI Image Recognition Industry Revenue (Million), by End-user Verticals 2024 & 2032
- Figure 56: Asia AI Image Recognition Industry Volume (K Unit), by End-user Verticals 2024 & 2032
- Figure 57: Asia AI Image Recognition Industry Revenue Share (%), by End-user Verticals 2024 & 2032
- Figure 58: Asia AI Image Recognition Industry Volume Share (%), by End-user Verticals 2024 & 2032
- Figure 59: Asia AI Image Recognition Industry Revenue (Million), by Country 2024 & 2032
- Figure 60: Asia AI Image Recognition Industry Volume (K Unit), by Country 2024 & 2032
- Figure 61: Asia AI Image Recognition Industry Revenue Share (%), by Country 2024 & 2032
- Figure 62: Asia AI Image Recognition Industry Volume Share (%), by Country 2024 & 2032
- Figure 63: Australia and New Zealand AI Image Recognition Industry Revenue (Million), by Type 2024 & 2032
- Figure 64: Australia and New Zealand AI Image Recognition Industry Volume (K Unit), by Type 2024 & 2032
- Figure 65: Australia and New Zealand AI Image Recognition Industry Revenue Share (%), by Type 2024 & 2032
- Figure 66: Australia and New Zealand AI Image Recognition Industry Volume Share (%), by Type 2024 & 2032
- Figure 67: Australia and New Zealand AI Image Recognition Industry Revenue (Million), by End-user Verticals 2024 & 2032
- Figure 68: Australia and New Zealand AI Image Recognition Industry Volume (K Unit), by End-user Verticals 2024 & 2032
- Figure 69: Australia and New Zealand AI Image Recognition Industry Revenue Share (%), by End-user Verticals 2024 & 2032
- Figure 70: Australia and New Zealand AI Image Recognition Industry Volume Share (%), by End-user Verticals 2024 & 2032
- Figure 71: Australia and New Zealand AI Image Recognition Industry Revenue (Million), by Country 2024 & 2032
- Figure 72: Australia and New Zealand AI Image Recognition Industry Volume (K Unit), by Country 2024 & 2032
- Figure 73: Australia and New Zealand AI Image Recognition Industry Revenue Share (%), by Country 2024 & 2032
- Figure 74: Australia and New Zealand AI Image Recognition Industry Volume Share (%), by Country 2024 & 2032
- Figure 75: Latin America AI Image Recognition Industry Revenue (Million), by Type 2024 & 2032
- Figure 76: Latin America AI Image Recognition Industry Volume (K Unit), by Type 2024 & 2032
- Figure 77: Latin America AI Image Recognition Industry Revenue Share (%), by Type 2024 & 2032
- Figure 78: Latin America AI Image Recognition Industry Volume Share (%), by Type 2024 & 2032
- Figure 79: Latin America AI Image Recognition Industry Revenue (Million), by End-user Verticals 2024 & 2032
- Figure 80: Latin America AI Image Recognition Industry Volume (K Unit), by End-user Verticals 2024 & 2032
- Figure 81: Latin America AI Image Recognition Industry Revenue Share (%), by End-user Verticals 2024 & 2032
- Figure 82: Latin America AI Image Recognition Industry Volume Share (%), by End-user Verticals 2024 & 2032
- Figure 83: Latin America AI Image Recognition Industry Revenue (Million), by Country 2024 & 2032
- Figure 84: Latin America AI Image Recognition Industry Volume (K Unit), by Country 2024 & 2032
- Figure 85: Latin America AI Image Recognition Industry Revenue Share (%), by Country 2024 & 2032
- Figure 86: Latin America AI Image Recognition Industry Volume Share (%), by Country 2024 & 2032
- Figure 87: Middle East and Africa AI Image Recognition Industry Revenue (Million), by Type 2024 & 2032
- Figure 88: Middle East and Africa AI Image Recognition Industry Volume (K Unit), by Type 2024 & 2032
- Figure 89: Middle East and Africa AI Image Recognition Industry Revenue Share (%), by Type 2024 & 2032
- Figure 90: Middle East and Africa AI Image Recognition Industry Volume Share (%), by Type 2024 & 2032
- Figure 91: Middle East and Africa AI Image Recognition Industry Revenue (Million), by End-user Verticals 2024 & 2032
- Figure 92: Middle East and Africa AI Image Recognition Industry Volume (K Unit), by End-user Verticals 2024 & 2032
- Figure 93: Middle East and Africa AI Image Recognition Industry Revenue Share (%), by End-user Verticals 2024 & 2032
- Figure 94: Middle East and Africa AI Image Recognition Industry Volume Share (%), by End-user Verticals 2024 & 2032
- Figure 95: Middle East and Africa AI Image Recognition Industry Revenue (Million), by Country 2024 & 2032
- Figure 96: Middle East and Africa AI Image Recognition Industry Volume (K Unit), by Country 2024 & 2032
- Figure 97: Middle East and Africa AI Image Recognition Industry Revenue Share (%), by Country 2024 & 2032
- Figure 98: Middle East and Africa AI Image Recognition Industry Volume Share (%), by Country 2024 & 2032
List of Tables
- Table 1: Global AI Image Recognition Industry Revenue Million Forecast, by Region 2019 & 2032
- Table 2: Global AI Image Recognition Industry Volume K Unit Forecast, by Region 2019 & 2032
- Table 3: Global AI Image Recognition Industry Revenue Million Forecast, by Type 2019 & 2032
- Table 4: Global AI Image Recognition Industry Volume K Unit Forecast, by Type 2019 & 2032
- Table 5: Global AI Image Recognition Industry Revenue Million Forecast, by End-user Verticals 2019 & 2032
- Table 6: Global AI Image Recognition Industry Volume K Unit Forecast, by End-user Verticals 2019 & 2032
- Table 7: Global AI Image Recognition Industry Revenue Million Forecast, by Region 2019 & 2032
- Table 8: Global AI Image Recognition Industry Volume K Unit Forecast, by Region 2019 & 2032
- Table 9: Global AI Image Recognition Industry Revenue Million Forecast, by Country 2019 & 2032
- Table 10: Global AI Image Recognition Industry Volume K Unit Forecast, by Country 2019 & 2032
- Table 11: United States AI Image Recognition Industry Revenue (Million) Forecast, by Application 2019 & 2032
- Table 12: United States AI Image Recognition Industry Volume (K Unit) Forecast, by Application 2019 & 2032
- Table 13: Canada AI Image Recognition Industry Revenue (Million) Forecast, by Application 2019 & 2032
- Table 14: Canada AI Image Recognition Industry Volume (K Unit) Forecast, by Application 2019 & 2032
- Table 15: Mexico AI Image Recognition Industry Revenue (Million) Forecast, by Application 2019 & 2032
- Table 16: Mexico AI Image Recognition Industry Volume (K Unit) Forecast, by Application 2019 & 2032
- Table 17: Global AI Image Recognition Industry Revenue Million Forecast, by Country 2019 & 2032
- Table 18: Global AI Image Recognition Industry Volume K Unit Forecast, by Country 2019 & 2032
- Table 19: Germany AI Image Recognition Industry Revenue (Million) Forecast, by Application 2019 & 2032
- Table 20: Germany AI Image Recognition Industry Volume (K Unit) Forecast, by Application 2019 & 2032
- Table 21: United Kingdom AI Image Recognition Industry Revenue (Million) Forecast, by Application 2019 & 2032
- Table 22: United Kingdom AI Image Recognition Industry Volume (K Unit) Forecast, by Application 2019 & 2032
- Table 23: France AI Image Recognition Industry Revenue (Million) Forecast, by Application 2019 & 2032
- Table 24: France AI Image Recognition Industry Volume (K Unit) Forecast, by Application 2019 & 2032
- Table 25: Spain AI Image Recognition Industry Revenue (Million) Forecast, by Application 2019 & 2032
- Table 26: Spain AI Image Recognition Industry Volume (K Unit) Forecast, by Application 2019 & 2032
- Table 27: Italy AI Image Recognition Industry Revenue (Million) Forecast, by Application 2019 & 2032
- Table 28: Italy AI Image Recognition Industry Volume (K Unit) Forecast, by Application 2019 & 2032
- Table 29: Spain AI Image Recognition Industry Revenue (Million) Forecast, by Application 2019 & 2032
- Table 30: Spain AI Image Recognition Industry Volume (K Unit) Forecast, by Application 2019 & 2032
- Table 31: Belgium AI Image Recognition Industry Revenue (Million) Forecast, by Application 2019 & 2032
- Table 32: Belgium AI Image Recognition Industry Volume (K Unit) Forecast, by Application 2019 & 2032
- Table 33: Netherland AI Image Recognition Industry Revenue (Million) Forecast, by Application 2019 & 2032
- Table 34: Netherland AI Image Recognition Industry Volume (K Unit) Forecast, by Application 2019 & 2032
- Table 35: Nordics AI Image Recognition Industry Revenue (Million) Forecast, by Application 2019 & 2032
- Table 36: Nordics AI Image Recognition Industry Volume (K Unit) Forecast, by Application 2019 & 2032
- Table 37: Rest of Europe AI Image Recognition Industry Revenue (Million) Forecast, by Application 2019 & 2032
- Table 38: Rest of Europe AI Image Recognition Industry Volume (K Unit) Forecast, by Application 2019 & 2032
- Table 39: Global AI Image Recognition Industry Revenue Million Forecast, by Country 2019 & 2032
- Table 40: Global AI Image Recognition Industry Volume K Unit Forecast, by Country 2019 & 2032
- Table 41: China AI Image Recognition Industry Revenue (Million) Forecast, by Application 2019 & 2032
- Table 42: China AI Image Recognition Industry Volume (K Unit) Forecast, by Application 2019 & 2032
- Table 43: Japan AI Image Recognition Industry Revenue (Million) Forecast, by Application 2019 & 2032
- Table 44: Japan AI Image Recognition Industry Volume (K Unit) Forecast, by Application 2019 & 2032
- Table 45: India AI Image Recognition Industry Revenue (Million) Forecast, by Application 2019 & 2032
- Table 46: India AI Image Recognition Industry Volume (K Unit) Forecast, by Application 2019 & 2032
- Table 47: South Korea AI Image Recognition Industry Revenue (Million) Forecast, by Application 2019 & 2032
- Table 48: South Korea AI Image Recognition Industry Volume (K Unit) Forecast, by Application 2019 & 2032
- Table 49: Southeast Asia AI Image Recognition Industry Revenue (Million) Forecast, by Application 2019 & 2032
- Table 50: Southeast Asia AI Image Recognition Industry Volume (K Unit) Forecast, by Application 2019 & 2032
- Table 51: Australia AI Image Recognition Industry Revenue (Million) Forecast, by Application 2019 & 2032
- Table 52: Australia AI Image Recognition Industry Volume (K Unit) Forecast, by Application 2019 & 2032
- Table 53: Indonesia AI Image Recognition Industry Revenue (Million) Forecast, by Application 2019 & 2032
- Table 54: Indonesia AI Image Recognition Industry Volume (K Unit) Forecast, by Application 2019 & 2032
- Table 55: Phillipes AI Image Recognition Industry Revenue (Million) Forecast, by Application 2019 & 2032
- Table 56: Phillipes AI Image Recognition Industry Volume (K Unit) Forecast, by Application 2019 & 2032
- Table 57: Singapore AI Image Recognition Industry Revenue (Million) Forecast, by Application 2019 & 2032
- Table 58: Singapore AI Image Recognition Industry Volume (K Unit) Forecast, by Application 2019 & 2032
- Table 59: Thailandc AI Image Recognition Industry Revenue (Million) Forecast, by Application 2019 & 2032
- Table 60: Thailandc AI Image Recognition Industry Volume (K Unit) Forecast, by Application 2019 & 2032
- Table 61: Rest of Asia Pacific AI Image Recognition Industry Revenue (Million) Forecast, by Application 2019 & 2032
- Table 62: Rest of Asia Pacific AI Image Recognition Industry Volume (K Unit) Forecast, by Application 2019 & 2032
- Table 63: Global AI Image Recognition Industry Revenue Million Forecast, by Country 2019 & 2032
- Table 64: Global AI Image Recognition Industry Volume K Unit Forecast, by Country 2019 & 2032
- Table 65: Brazil AI Image Recognition Industry Revenue (Million) Forecast, by Application 2019 & 2032
- Table 66: Brazil AI Image Recognition Industry Volume (K Unit) Forecast, by Application 2019 & 2032
- Table 67: Argentina AI Image Recognition Industry Revenue (Million) Forecast, by Application 2019 & 2032
- Table 68: Argentina AI Image Recognition Industry Volume (K Unit) Forecast, by Application 2019 & 2032
- Table 69: Peru AI Image Recognition Industry Revenue (Million) Forecast, by Application 2019 & 2032
- Table 70: Peru AI Image Recognition Industry Volume (K Unit) Forecast, by Application 2019 & 2032
- Table 71: Chile AI Image Recognition Industry Revenue (Million) Forecast, by Application 2019 & 2032
- Table 72: Chile AI Image Recognition Industry Volume (K Unit) Forecast, by Application 2019 & 2032
- Table 73: Colombia AI Image Recognition Industry Revenue (Million) Forecast, by Application 2019 & 2032
- Table 74: Colombia AI Image Recognition Industry Volume (K Unit) Forecast, by Application 2019 & 2032
- Table 75: Ecuador AI Image Recognition Industry Revenue (Million) Forecast, by Application 2019 & 2032
- Table 76: Ecuador AI Image Recognition Industry Volume (K Unit) Forecast, by Application 2019 & 2032
- Table 77: Venezuela AI Image Recognition Industry Revenue (Million) Forecast, by Application 2019 & 2032
- Table 78: Venezuela AI Image Recognition Industry Volume (K Unit) Forecast, by Application 2019 & 2032
- Table 79: Rest of South America AI Image Recognition Industry Revenue (Million) Forecast, by Application 2019 & 2032
- Table 80: Rest of South America AI Image Recognition Industry Volume (K Unit) Forecast, by Application 2019 & 2032
- Table 81: Global AI Image Recognition Industry Revenue Million Forecast, by Country 2019 & 2032
- Table 82: Global AI Image Recognition Industry Volume K Unit Forecast, by Country 2019 & 2032
- Table 83: United States AI Image Recognition Industry Revenue (Million) Forecast, by Application 2019 & 2032
- Table 84: United States AI Image Recognition Industry Volume (K Unit) Forecast, by Application 2019 & 2032
- Table 85: Canada AI Image Recognition Industry Revenue (Million) Forecast, by Application 2019 & 2032
- Table 86: Canada AI Image Recognition Industry Volume (K Unit) Forecast, by Application 2019 & 2032
- Table 87: Mexico AI Image Recognition Industry Revenue (Million) Forecast, by Application 2019 & 2032
- Table 88: Mexico AI Image Recognition Industry Volume (K Unit) Forecast, by Application 2019 & 2032
- Table 89: Global AI Image Recognition Industry Revenue Million Forecast, by Country 2019 & 2032
- Table 90: Global AI Image Recognition Industry Volume K Unit Forecast, by Country 2019 & 2032
- Table 91: United Arab Emirates AI Image Recognition Industry Revenue (Million) Forecast, by Application 2019 & 2032
- Table 92: United Arab Emirates AI Image Recognition Industry Volume (K Unit) Forecast, by Application 2019 & 2032
- Table 93: Saudi Arabia AI Image Recognition Industry Revenue (Million) Forecast, by Application 2019 & 2032
- Table 94: Saudi Arabia AI Image Recognition Industry Volume (K Unit) Forecast, by Application 2019 & 2032
- Table 95: South Africa AI Image Recognition Industry Revenue (Million) Forecast, by Application 2019 & 2032
- Table 96: South Africa AI Image Recognition Industry Volume (K Unit) Forecast, by Application 2019 & 2032
- Table 97: Rest of Middle East and Africa AI Image Recognition Industry Revenue (Million) Forecast, by Application 2019 & 2032
- Table 98: Rest of Middle East and Africa AI Image Recognition Industry Volume (K Unit) Forecast, by Application 2019 & 2032
- Table 99: Global AI Image Recognition Industry Revenue Million Forecast, by Type 2019 & 2032
- Table 100: Global AI Image Recognition Industry Volume K Unit Forecast, by Type 2019 & 2032
- Table 101: Global AI Image Recognition Industry Revenue Million Forecast, by End-user Verticals 2019 & 2032
- Table 102: Global AI Image Recognition Industry Volume K Unit Forecast, by End-user Verticals 2019 & 2032
- Table 103: Global AI Image Recognition Industry Revenue Million Forecast, by Country 2019 & 2032
- Table 104: Global AI Image Recognition Industry Volume K Unit Forecast, by Country 2019 & 2032
- Table 105: Global AI Image Recognition Industry Revenue Million Forecast, by Type 2019 & 2032
- Table 106: Global AI Image Recognition Industry Volume K Unit Forecast, by Type 2019 & 2032
- Table 107: Global AI Image Recognition Industry Revenue Million Forecast, by End-user Verticals 2019 & 2032
- Table 108: Global AI Image Recognition Industry Volume K Unit Forecast, by End-user Verticals 2019 & 2032
- Table 109: Global AI Image Recognition Industry Revenue Million Forecast, by Country 2019 & 2032
- Table 110: Global AI Image Recognition Industry Volume K Unit Forecast, by Country 2019 & 2032
- Table 111: Global AI Image Recognition Industry Revenue Million Forecast, by Type 2019 & 2032
- Table 112: Global AI Image Recognition Industry Volume K Unit Forecast, by Type 2019 & 2032
- Table 113: Global AI Image Recognition Industry Revenue Million Forecast, by End-user Verticals 2019 & 2032
- Table 114: Global AI Image Recognition Industry Volume K Unit Forecast, by End-user Verticals 2019 & 2032
- Table 115: Global AI Image Recognition Industry Revenue Million Forecast, by Country 2019 & 2032
- Table 116: Global AI Image Recognition Industry Volume K Unit Forecast, by Country 2019 & 2032
- Table 117: Global AI Image Recognition Industry Revenue Million Forecast, by Type 2019 & 2032
- Table 118: Global AI Image Recognition Industry Volume K Unit Forecast, by Type 2019 & 2032
- Table 119: Global AI Image Recognition Industry Revenue Million Forecast, by End-user Verticals 2019 & 2032
- Table 120: Global AI Image Recognition Industry Volume K Unit Forecast, by End-user Verticals 2019 & 2032
- Table 121: Global AI Image Recognition Industry Revenue Million Forecast, by Country 2019 & 2032
- Table 122: Global AI Image Recognition Industry Volume K Unit Forecast, by Country 2019 & 2032
- Table 123: Global AI Image Recognition Industry Revenue Million Forecast, by Type 2019 & 2032
- Table 124: Global AI Image Recognition Industry Volume K Unit Forecast, by Type 2019 & 2032
- Table 125: Global AI Image Recognition Industry Revenue Million Forecast, by End-user Verticals 2019 & 2032
- Table 126: Global AI Image Recognition Industry Volume K Unit Forecast, by End-user Verticals 2019 & 2032
- Table 127: Global AI Image Recognition Industry Revenue Million Forecast, by Country 2019 & 2032
- Table 128: Global AI Image Recognition Industry Volume K Unit Forecast, by Country 2019 & 2032
- Table 129: Global AI Image Recognition Industry Revenue Million Forecast, by Type 2019 & 2032
- Table 130: Global AI Image Recognition Industry Volume K Unit Forecast, by Type 2019 & 2032
- Table 131: Global AI Image Recognition Industry Revenue Million Forecast, by End-user Verticals 2019 & 2032
- Table 132: Global AI Image Recognition Industry Volume K Unit Forecast, by End-user Verticals 2019 & 2032
- Table 133: Global AI Image Recognition Industry Revenue Million Forecast, by Country 2019 & 2032
- Table 134: Global AI Image Recognition Industry Volume K Unit Forecast, by Country 2019 & 2032
Frequently Asked Questions
1. What is the projected Compound Annual Growth Rate (CAGR) of the AI Image Recognition Industry?
The projected CAGR is approximately 11.76%.
2. Which companies are prominent players in the AI Image Recognition Industry?
Key companies in the market include Xilinx Inc (AMD Inc ), Clarifai Inc, IBM Corporation, Samsung Electronics Co Ltd, Google LLC (Alphabet Inc ), Microsoft Corporation, Qualcomm Incorporated, Amazon Web Services Inc (Amazon Com Inc ), Micron Technologies Inc, Nvidia Corporation, Intel Corporation.
3. What are the main segments of the AI Image Recognition Industry?
The market segments include Type, End-user Verticals.
4. Can you provide details about the market size?
The market size is estimated to be USD 2.55 Million as of 2022.
5. What are some drivers contributing to market growth?
Growing AI Adoption; Increasing Use of Big Data Analytics; Declining Costs of Hardware.
6. What are the notable trends driving market growth?
Healthcare Sector is Expected to Witness Significant Growth.
7. Are there any restraints impacting market growth?
Lack of Technical Expertise.
8. Can you provide examples of recent developments in the market?
September 2022: The International Society of Ultrasound in Obstetrics and Gynecology (ISUOG) World Congress 2022 was to take place in London, United Kingdom, from September 16 to September 18, and Samsung Medison, a leading manufacturer of medical equipment and a subsidiary of Samsung Electronics, was to attend the function to demonstrate its high-end HERA W10 obstetric and gynecological ultrasound equipment. The HERA W10 system has Intelligent Assist (AI diagnostic solutions), V8, and V7. These two top-of-the-line ultrasound systems can be employed with premium AI diagnostic solutions in various medical specialties.
9. What pricing options are available for accessing the report?
Pricing options include single-user, multi-user, and enterprise licenses priced at USD 4750, USD 5250, and USD 8750 respectively.
10. Is the market size provided in terms of value or volume?
The market size is provided in terms of value, measured in Million and volume, measured in K Unit.
11. Are there any specific market keywords associated with the report?
Yes, the market keyword associated with the report is "AI Image Recognition Industry," which aids in identifying and referencing the specific market segment covered.
12. How do I determine which pricing option suits my needs best?
The pricing options vary based on user requirements and access needs. Individual users may opt for single-user licenses, while businesses requiring broader access may choose multi-user or enterprise licenses for cost-effective access to the report.
13. Are there any additional resources or data provided in the AI Image Recognition Industry report?
While the report offers comprehensive insights, it's advisable to review the specific contents or supplementary materials provided to ascertain if additional resources or data are available.
14. How can I stay updated on further developments or reports in the AI Image Recognition Industry?
To stay informed about further developments, trends, and reports in the AI Image Recognition Industry, consider subscribing to industry newsletters, following relevant companies and organizations, or regularly checking reputable industry news sources and publications.
Methodology
Step 1 - Identification of Relevant Samples Size from Population Database


Step 2 - Approaches for Defining Global Market Size (Value, Volume* & Price*)

Note*: In applicable scenarios
Step 3 - Data Sources
Primary Research
- Web Analytics
- Survey Reports
- Research Institute
- Latest Research Reports
- Opinion Leaders
Secondary Research
- Annual Reports
- White Paper
- Latest Press Release
- Industry Association
- Paid Database
- Investor Presentations

Step 4 - Data Triangulation
Involves using different sources of information in order to increase the validity of a study
These sources are likely to be stakeholders in a program - participants, other researchers, program staff, other community members, and so on.
Then we put all data in single framework & apply various statistical tools to find out the dynamic on the market.
During the analysis stage, feedback from the stakeholder groups would be compared to determine areas of agreement as well as areas of divergence


