
Key Insights
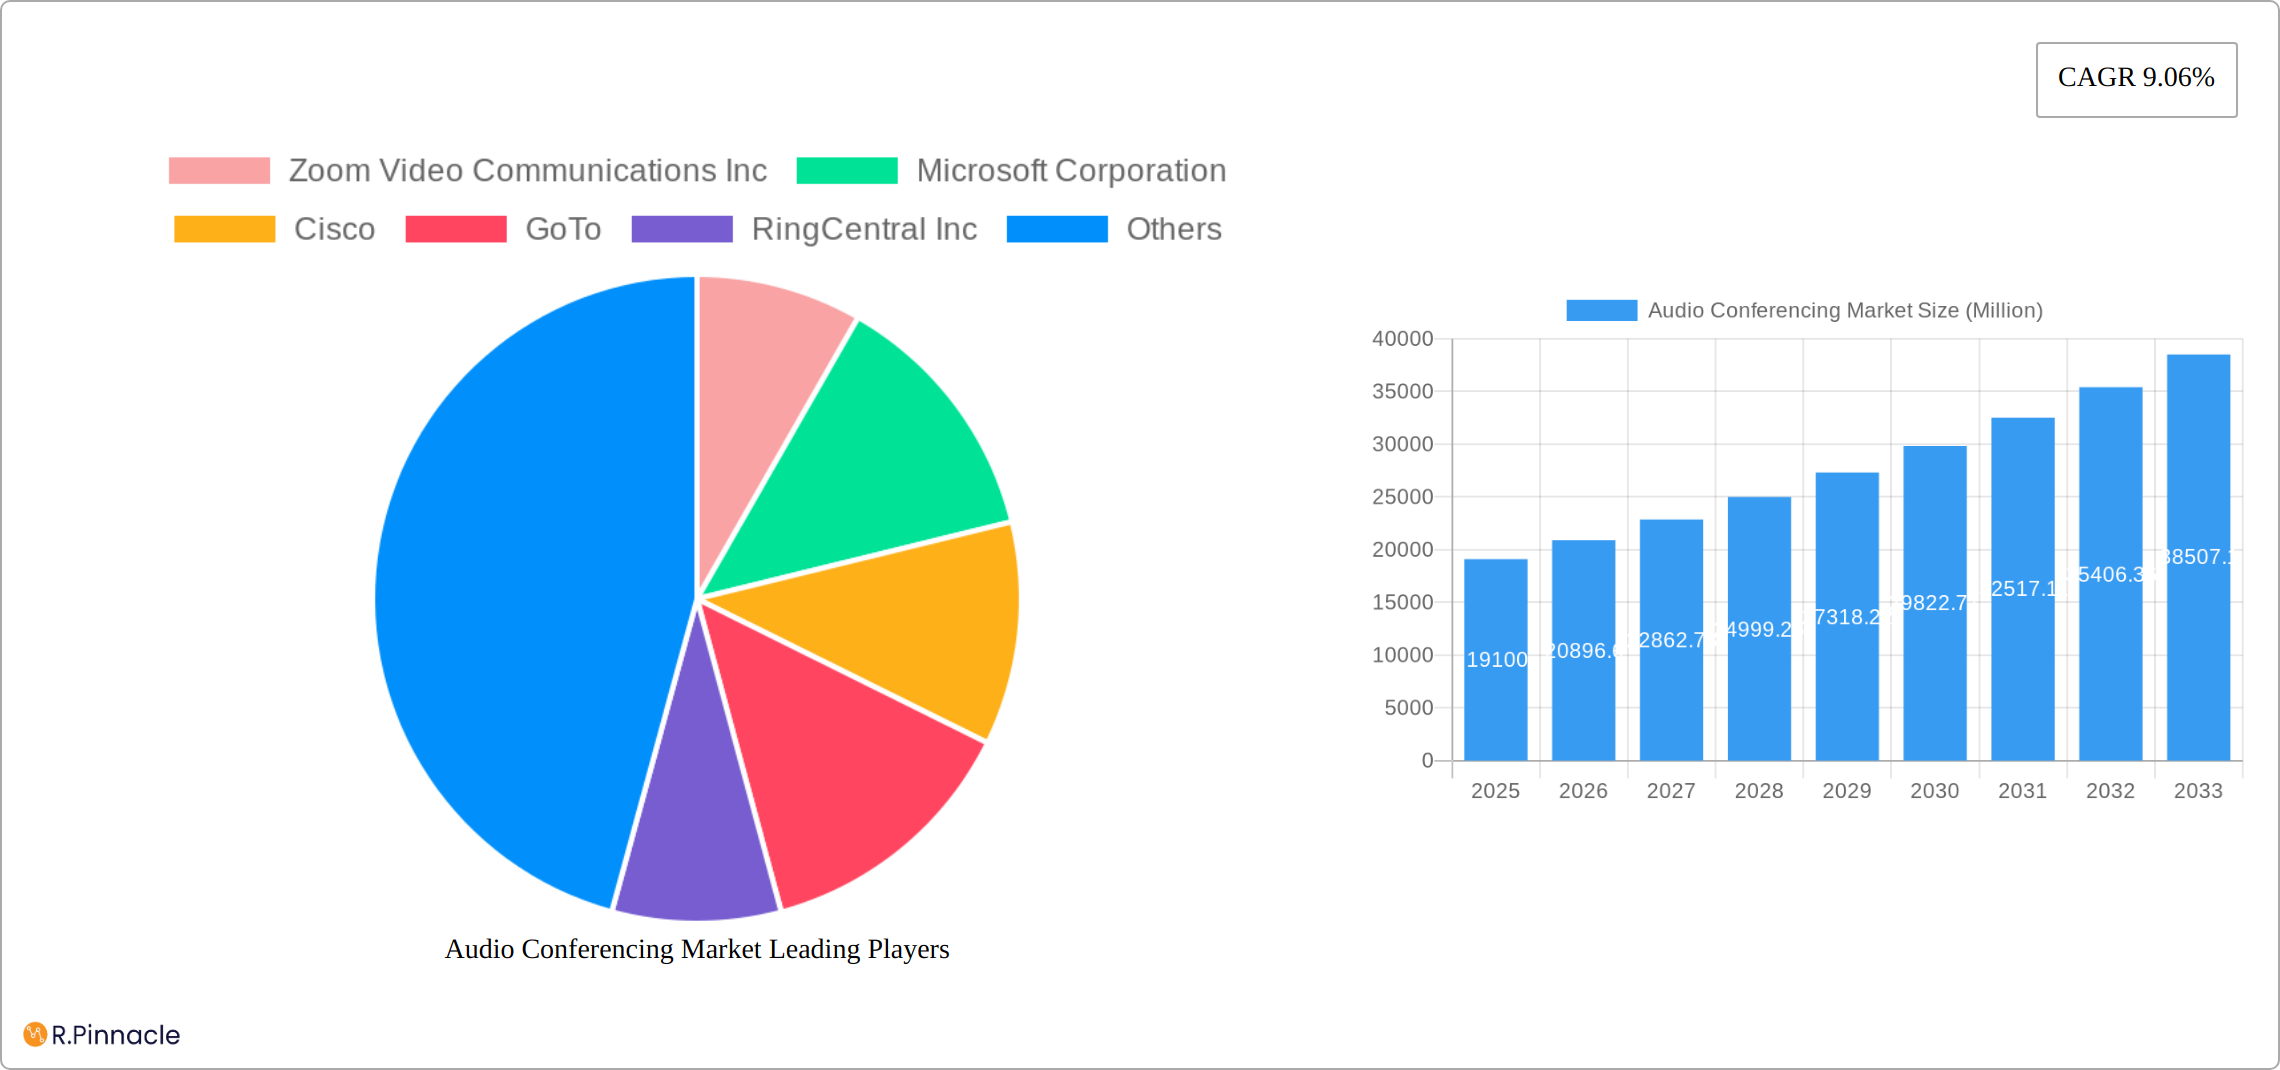
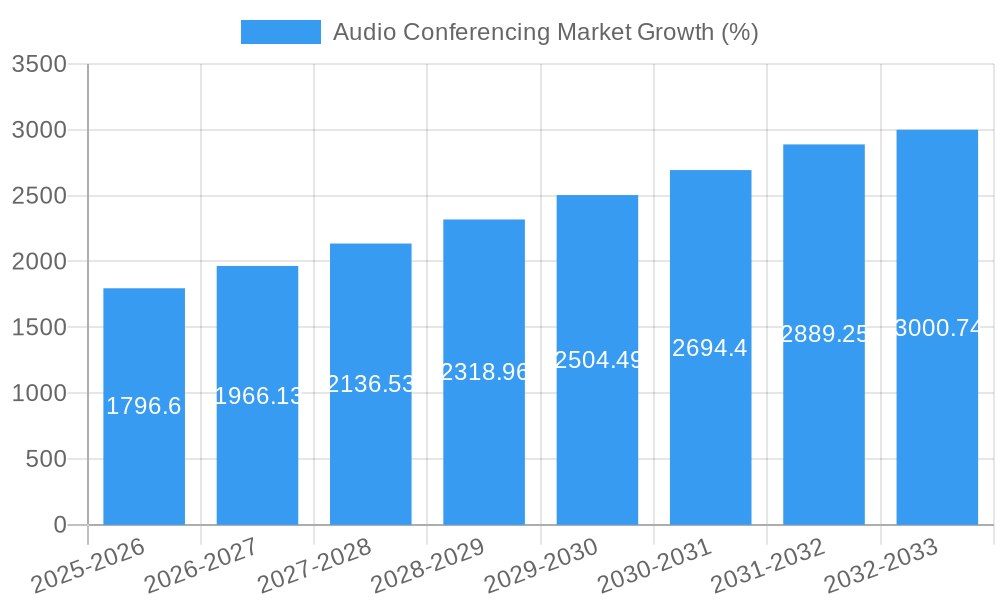
The global audio conferencing market, valued at $19.10 billion in 2025, is experiencing robust growth, projected to expand at a compound annual growth rate (CAGR) of 9.06% from 2025 to 2033. This expansion is fueled by several key drivers. The increasing adoption of hybrid and remote work models necessitates efficient communication solutions, driving demand for reliable and feature-rich audio conferencing platforms. Furthermore, the rising integration of audio conferencing with other collaboration tools, such as video conferencing and instant messaging, enhances productivity and streamlines workflows, boosting market uptake. Technological advancements, such as improved audio quality, enhanced security features, and AI-powered transcription services, are also contributing to market growth. The competitive landscape is characterized by a mix of established players like Zoom, Microsoft, and Cisco, along with emerging companies offering innovative solutions. While the market enjoys strong growth prospects, challenges such as concerns about data security and privacy, as well as the need for continuous technological upgrades to maintain competitiveness, present ongoing hurdles.
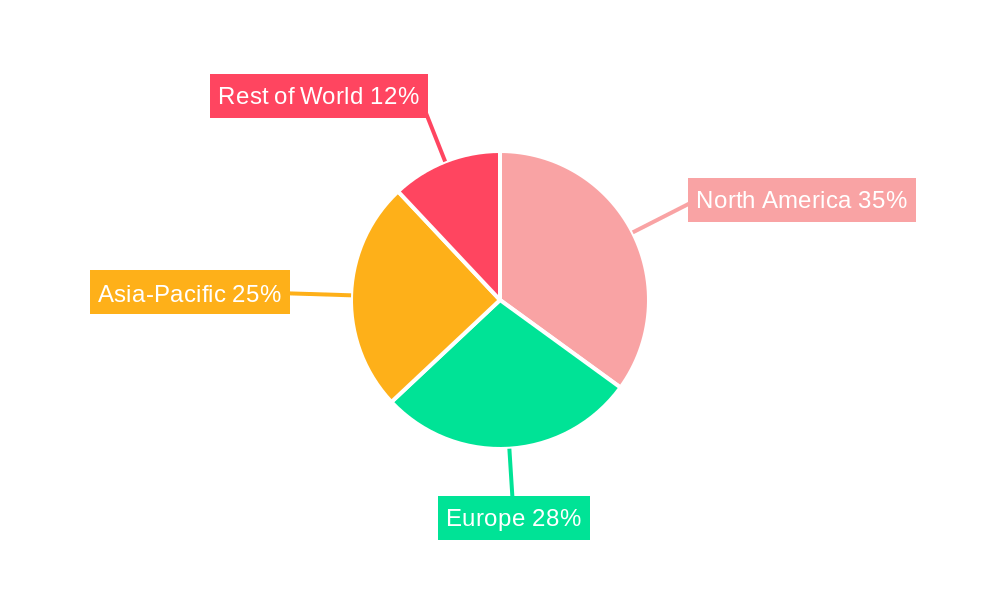
Looking ahead, the market is poised for significant transformation. The continued evolution of cloud-based solutions will further accelerate adoption, offering cost-effectiveness and scalability. The integration of advanced analytics and real-time insights into audio conferencing platforms will enable businesses to gain valuable data on meeting effectiveness and employee engagement. The rise of 5G and improved network infrastructure will also contribute to enhanced audio quality and reliability. Regional variations in market growth will likely persist, with mature markets in North America and Europe exhibiting steady growth, while developing economies in Asia-Pacific and Latin America show significant potential for expansion driven by increasing digitalization. Companies are likely to focus on expanding their feature sets and integrating AI to provide a more holistic collaboration experience. This will lead to a more competitive but ultimately beneficial market for businesses adopting audio conferencing solutions.
This comprehensive report provides an in-depth analysis of the Audio Conferencing Market, offering valuable insights for industry professionals, investors, and strategists. Covering the period from 2019 to 2033, with a focus on 2025, this report analyzes market dynamics, key players, technological advancements, and future growth potential. The market is projected to reach xx Million by 2033, exhibiting a significant CAGR of xx% during the forecast period (2025-2033).
Audio Conferencing Market Structure & Innovation Trends
This section delves into the competitive landscape of the audio conferencing market, examining market concentration, innovation drivers, and regulatory influences. The market is characterized by a mix of established players and emerging companies, with key players including Zoom, Microsoft, Cisco, and others vying for market share. The market concentration is moderately high, with the top five players holding an estimated xx% of the market share in 2025.
- Market Concentration: Moderately high, with top 5 players holding xx% market share (2025).
- Innovation Drivers: Increasing demand for high-quality audio, integration with other collaboration tools, and the rise of remote work are key drivers.
- Regulatory Frameworks: Varying regulations across different regions impact market growth. Compliance with data privacy regulations (GDPR, CCPA) is crucial.
- Product Substitutes: Other communication technologies like video conferencing partially substitute audio conferencing, although dedicated audio solutions remain critical for specific use cases.
- End-User Demographics: The market caters to businesses of all sizes, including enterprises, SMEs, and individual users.
- M&A Activities: The past five years have witnessed significant M&A activity, with deal values exceeding xx Million in total. Strategic acquisitions aim to expand product portfolios and market reach.
Audio Conferencing Market Dynamics & Trends
The audio conferencing market is experiencing robust growth, driven by several factors. The increasing adoption of remote work and hybrid work models fuels demand for seamless communication solutions. Technological advancements, such as AI-powered noise cancellation and enhanced audio quality, further propel market expansion. Consumer preference is shifting towards cloud-based solutions due to their scalability and cost-effectiveness. Competitive dynamics are intense, with companies continuously innovating to improve features and expand their market share. The market is expected to grow at a CAGR of xx% from 2025 to 2033, reaching xx Million by 2033. Market penetration of cloud-based solutions is expected to reach xx% by 2033.
Dominant Regions & Segments in Audio Conferencing Market
North America currently holds the largest market share, driven by high technology adoption rates and strong demand from large enterprises. Europe and Asia Pacific are also significant markets, exhibiting robust growth potential. Within segments, cloud-based audio conferencing is experiencing the fastest growth, surpassing on-premise solutions in market share.
- Key Drivers for North America Dominance:
- High technology adoption rates.
- Strong presence of major technology companies.
- High spending on IT infrastructure.
- Other Regions: Europe and Asia-Pacific are exhibiting strong growth due to increasing digitalization and expanding workforces.
The detailed dominance analysis further highlights the factors contributing to regional variations in market growth, considering economic factors, infrastructure development, and regulatory environments.
Audio Conferencing Market Product Innovations
Recent innovations focus on enhancing audio quality, integrating AI features like noise cancellation and transcription, and improving interoperability with other communication platforms. Products are becoming more user-friendly and offer flexible deployment options (cloud, on-premise). The market's competitiveness is driving continuous improvements in product features and functionalities, focusing on enhancing user experience and productivity.
Report Scope & Segmentation Analysis
This report segments the audio conferencing market by deployment type (cloud-based, on-premise), organization size (small, medium, large enterprises), end-user industry (IT, BFSI, healthcare, education, etc.), and geographic region (North America, Europe, Asia Pacific, etc.). Each segment’s growth projections, market size estimates, and competitive dynamics are analyzed in detail.
Key Drivers of Audio Conferencing Market Growth
The market's expansion is primarily driven by the increasing adoption of remote work and the rising need for seamless communication across geographically dispersed teams. Technological advancements such as AI-powered features, improved audio quality, and enhanced security are other key drivers. Favorable government regulations promoting digital transformation also contribute to market growth.
Challenges in the Audio Conferencing Market Sector
Challenges include ensuring data security and privacy in cloud-based solutions, managing evolving regulatory landscapes, and dealing with potential supply chain disruptions. Competitive pressures, including price wars and the need for continuous innovation, also present significant hurdles. These challenges, if not effectively addressed, could negatively impact market growth.
Emerging Opportunities in Audio Conferencing Market
Emerging opportunities lie in the integration of audio conferencing with other collaboration tools, the expansion into new and untapped markets, and the development of innovative features like real-time language translation and advanced analytics. The integration of IoT and AI in audio conferencing applications also offers substantial growth potential.
Leading Players in the Audio Conferencing Market Market
- Zoom Video Communications Inc
- Microsoft Corporation
- Cisco
- GoTo
- RingCentral Inc
- Grandstream Networks Inc
- Google LLC (Alphabet Inc)
- Dialpad Inc
- Avaya LLC
- Philips Dictation
- Vonage (Ericsson)
- ZipDX LLC
- Mitel Networks Corporation
Key Developments in Audio Conferencing Market Industry
- June 2024: Nureva Inc. received certification for its HDL310 and HDL410 systems as professional audio devices for larger Zoom Rooms. This enhances Zoom's capabilities for larger spaces.
- January 2024: Google announced Microsoft Teams integration with Android Auto, expanding Teams' reach into vehicles.
- March 2024: Cisco launched the Cisco Desk Phone 9800 Series, providing enhanced collaboration features and premium audio.
Future Outlook for Audio Conferencing Market Market
The audio conferencing market is poised for continued growth, driven by ongoing technological advancements, the increasing prevalence of hybrid work models, and the expansion into new markets. Strategic partnerships, acquisitions, and the development of innovative features will play a key role in shaping the market's future landscape. The market is expected to witness a significant expansion over the next decade, driven by both organic growth and strategic consolidation within the industry.
Audio Conferencing Market Segmentation
-
1. Component
- 1.1. Hardware
- 1.2. Software
- 1.3. Service
-
2. End User Vertical
- 2.1. Corporate Communication
- 2.2. Education
- 2.3. Government
- 2.4. Others
Audio Conferencing Market Segmentation By Geography
- 1. North America
- 2. Europe
- 3. Asia
- 4. Australia and New Zealand
- 5. Latin America
- 6. Middle East and Africa
Audio Conferencing Market REPORT HIGHLIGHTS
| Aspects | Details |
|---|---|
| Study Period | 2019-2033 |
| Base Year | 2024 |
| Estimated Year | 2025 |
| Forecast Period | 2025-2033 |
| Historical Period | 2019-2024 |
| Growth Rate | CAGR of 9.06% from 2019-2033 |
| Segmentation |
|
Table of Contents
- 1. Introduction
- 1.1. Research Scope
- 1.2. Market Segmentation
- 1.3. Research Methodology
- 1.4. Definitions and Assumptions
- 2. Executive Summary
- 2.1. Introduction
- 3. Market Dynamics
- 3.1. Introduction
- 3.2. Market Drivers
- 3.2.1. Remote Work Adoption; Globalization of Businessess
- 3.3. Market Restrains
- 3.3.1. Remote Work Adoption; Globalization of Businessess
- 3.4. Market Trends
- 3.4.1. Corporate Communication Segment to Drive Opportunities in the Market
- 4. Market Factor Analysis
- 4.1. Porters Five Forces
- 4.2. Supply/Value Chain
- 4.3. PESTEL analysis
- 4.4. Market Entropy
- 4.5. Patent/Trademark Analysis
- 5. Global Audio Conferencing Market Analysis, Insights and Forecast, 2019-2031
- 5.1. Market Analysis, Insights and Forecast - by Component
- 5.1.1. Hardware
- 5.1.2. Software
- 5.1.3. Service
- 5.2. Market Analysis, Insights and Forecast - by End User Vertical
- 5.2.1. Corporate Communication
- 5.2.2. Education
- 5.2.3. Government
- 5.2.4. Others
- 5.3. Market Analysis, Insights and Forecast - by Region
- 5.3.1. North America
- 5.3.2. Europe
- 5.3.3. Asia
- 5.3.4. Australia and New Zealand
- 5.3.5. Latin America
- 5.3.6. Middle East and Africa
- 5.1. Market Analysis, Insights and Forecast - by Component
- 6. North America Audio Conferencing Market Analysis, Insights and Forecast, 2019-2031
- 6.1. Market Analysis, Insights and Forecast - by Component
- 6.1.1. Hardware
- 6.1.2. Software
- 6.1.3. Service
- 6.2. Market Analysis, Insights and Forecast - by End User Vertical
- 6.2.1. Corporate Communication
- 6.2.2. Education
- 6.2.3. Government
- 6.2.4. Others
- 6.1. Market Analysis, Insights and Forecast - by Component
- 7. Europe Audio Conferencing Market Analysis, Insights and Forecast, 2019-2031
- 7.1. Market Analysis, Insights and Forecast - by Component
- 7.1.1. Hardware
- 7.1.2. Software
- 7.1.3. Service
- 7.2. Market Analysis, Insights and Forecast - by End User Vertical
- 7.2.1. Corporate Communication
- 7.2.2. Education
- 7.2.3. Government
- 7.2.4. Others
- 7.1. Market Analysis, Insights and Forecast - by Component
- 8. Asia Audio Conferencing Market Analysis, Insights and Forecast, 2019-2031
- 8.1. Market Analysis, Insights and Forecast - by Component
- 8.1.1. Hardware
- 8.1.2. Software
- 8.1.3. Service
- 8.2. Market Analysis, Insights and Forecast - by End User Vertical
- 8.2.1. Corporate Communication
- 8.2.2. Education
- 8.2.3. Government
- 8.2.4. Others
- 8.1. Market Analysis, Insights and Forecast - by Component
- 9. Australia and New Zealand Audio Conferencing Market Analysis, Insights and Forecast, 2019-2031
- 9.1. Market Analysis, Insights and Forecast - by Component
- 9.1.1. Hardware
- 9.1.2. Software
- 9.1.3. Service
- 9.2. Market Analysis, Insights and Forecast - by End User Vertical
- 9.2.1. Corporate Communication
- 9.2.2. Education
- 9.2.3. Government
- 9.2.4. Others
- 9.1. Market Analysis, Insights and Forecast - by Component
- 10. Latin America Audio Conferencing Market Analysis, Insights and Forecast, 2019-2031
- 10.1. Market Analysis, Insights and Forecast - by Component
- 10.1.1. Hardware
- 10.1.2. Software
- 10.1.3. Service
- 10.2. Market Analysis, Insights and Forecast - by End User Vertical
- 10.2.1. Corporate Communication
- 10.2.2. Education
- 10.2.3. Government
- 10.2.4. Others
- 10.1. Market Analysis, Insights and Forecast - by Component
- 11. Middle East and Africa Audio Conferencing Market Analysis, Insights and Forecast, 2019-2031
- 11.1. Market Analysis, Insights and Forecast - by Component
- 11.1.1. Hardware
- 11.1.2. Software
- 11.1.3. Service
- 11.2. Market Analysis, Insights and Forecast - by End User Vertical
- 11.2.1. Corporate Communication
- 11.2.2. Education
- 11.2.3. Government
- 11.2.4. Others
- 11.1. Market Analysis, Insights and Forecast - by Component
- 12. Competitive Analysis
- 12.1. Global Market Share Analysis 2024
- 12.2. Company Profiles
- 12.2.1 Zoom Video Communications Inc
- 12.2.1.1. Overview
- 12.2.1.2. Products
- 12.2.1.3. SWOT Analysis
- 12.2.1.4. Recent Developments
- 12.2.1.5. Financials (Based on Availability)
- 12.2.2 Microsoft Corporation
- 12.2.2.1. Overview
- 12.2.2.2. Products
- 12.2.2.3. SWOT Analysis
- 12.2.2.4. Recent Developments
- 12.2.2.5. Financials (Based on Availability)
- 12.2.3 Cisco
- 12.2.3.1. Overview
- 12.2.3.2. Products
- 12.2.3.3. SWOT Analysis
- 12.2.3.4. Recent Developments
- 12.2.3.5. Financials (Based on Availability)
- 12.2.4 GoTo
- 12.2.4.1. Overview
- 12.2.4.2. Products
- 12.2.4.3. SWOT Analysis
- 12.2.4.4. Recent Developments
- 12.2.4.5. Financials (Based on Availability)
- 12.2.5 RingCentral Inc
- 12.2.5.1. Overview
- 12.2.5.2. Products
- 12.2.5.3. SWOT Analysis
- 12.2.5.4. Recent Developments
- 12.2.5.5. Financials (Based on Availability)
- 12.2.6 Grandstream Networks Inc
- 12.2.6.1. Overview
- 12.2.6.2. Products
- 12.2.6.3. SWOT Analysis
- 12.2.6.4. Recent Developments
- 12.2.6.5. Financials (Based on Availability)
- 12.2.7 Google LLC (Alphabet Inc)
- 12.2.7.1. Overview
- 12.2.7.2. Products
- 12.2.7.3. SWOT Analysis
- 12.2.7.4. Recent Developments
- 12.2.7.5. Financials (Based on Availability)
- 12.2.8 Dialpad Inc
- 12.2.8.1. Overview
- 12.2.8.2. Products
- 12.2.8.3. SWOT Analysis
- 12.2.8.4. Recent Developments
- 12.2.8.5. Financials (Based on Availability)
- 12.2.9 Avaya LLC
- 12.2.9.1. Overview
- 12.2.9.2. Products
- 12.2.9.3. SWOT Analysis
- 12.2.9.4. Recent Developments
- 12.2.9.5. Financials (Based on Availability)
- 12.2.10 Philips Dictation
- 12.2.10.1. Overview
- 12.2.10.2. Products
- 12.2.10.3. SWOT Analysis
- 12.2.10.4. Recent Developments
- 12.2.10.5. Financials (Based on Availability)
- 12.2.11 Vonage (Ericsson)
- 12.2.11.1. Overview
- 12.2.11.2. Products
- 12.2.11.3. SWOT Analysis
- 12.2.11.4. Recent Developments
- 12.2.11.5. Financials (Based on Availability)
- 12.2.12 ZipDX LLC
- 12.2.12.1. Overview
- 12.2.12.2. Products
- 12.2.12.3. SWOT Analysis
- 12.2.12.4. Recent Developments
- 12.2.12.5. Financials (Based on Availability)
- 12.2.13 Mitel Networks Corporation*List Not Exhaustive
- 12.2.13.1. Overview
- 12.2.13.2. Products
- 12.2.13.3. SWOT Analysis
- 12.2.13.4. Recent Developments
- 12.2.13.5. Financials (Based on Availability)
- 12.2.1 Zoom Video Communications Inc
List of Figures
- Figure 1: Global Audio Conferencing Market Revenue Breakdown (Million, %) by Region 2024 & 2032
- Figure 2: Global Audio Conferencing Market Volume Breakdown (Billion, %) by Region 2024 & 2032
- Figure 3: North America Audio Conferencing Market Revenue (Million), by Component 2024 & 2032
- Figure 4: North America Audio Conferencing Market Volume (Billion), by Component 2024 & 2032
- Figure 5: North America Audio Conferencing Market Revenue Share (%), by Component 2024 & 2032
- Figure 6: North America Audio Conferencing Market Volume Share (%), by Component 2024 & 2032
- Figure 7: North America Audio Conferencing Market Revenue (Million), by End User Vertical 2024 & 2032
- Figure 8: North America Audio Conferencing Market Volume (Billion), by End User Vertical 2024 & 2032
- Figure 9: North America Audio Conferencing Market Revenue Share (%), by End User Vertical 2024 & 2032
- Figure 10: North America Audio Conferencing Market Volume Share (%), by End User Vertical 2024 & 2032
- Figure 11: North America Audio Conferencing Market Revenue (Million), by Country 2024 & 2032
- Figure 12: North America Audio Conferencing Market Volume (Billion), by Country 2024 & 2032
- Figure 13: North America Audio Conferencing Market Revenue Share (%), by Country 2024 & 2032
- Figure 14: North America Audio Conferencing Market Volume Share (%), by Country 2024 & 2032
- Figure 15: Europe Audio Conferencing Market Revenue (Million), by Component 2024 & 2032
- Figure 16: Europe Audio Conferencing Market Volume (Billion), by Component 2024 & 2032
- Figure 17: Europe Audio Conferencing Market Revenue Share (%), by Component 2024 & 2032
- Figure 18: Europe Audio Conferencing Market Volume Share (%), by Component 2024 & 2032
- Figure 19: Europe Audio Conferencing Market Revenue (Million), by End User Vertical 2024 & 2032
- Figure 20: Europe Audio Conferencing Market Volume (Billion), by End User Vertical 2024 & 2032
- Figure 21: Europe Audio Conferencing Market Revenue Share (%), by End User Vertical 2024 & 2032
- Figure 22: Europe Audio Conferencing Market Volume Share (%), by End User Vertical 2024 & 2032
- Figure 23: Europe Audio Conferencing Market Revenue (Million), by Country 2024 & 2032
- Figure 24: Europe Audio Conferencing Market Volume (Billion), by Country 2024 & 2032
- Figure 25: Europe Audio Conferencing Market Revenue Share (%), by Country 2024 & 2032
- Figure 26: Europe Audio Conferencing Market Volume Share (%), by Country 2024 & 2032
- Figure 27: Asia Audio Conferencing Market Revenue (Million), by Component 2024 & 2032
- Figure 28: Asia Audio Conferencing Market Volume (Billion), by Component 2024 & 2032
- Figure 29: Asia Audio Conferencing Market Revenue Share (%), by Component 2024 & 2032
- Figure 30: Asia Audio Conferencing Market Volume Share (%), by Component 2024 & 2032
- Figure 31: Asia Audio Conferencing Market Revenue (Million), by End User Vertical 2024 & 2032
- Figure 32: Asia Audio Conferencing Market Volume (Billion), by End User Vertical 2024 & 2032
- Figure 33: Asia Audio Conferencing Market Revenue Share (%), by End User Vertical 2024 & 2032
- Figure 34: Asia Audio Conferencing Market Volume Share (%), by End User Vertical 2024 & 2032
- Figure 35: Asia Audio Conferencing Market Revenue (Million), by Country 2024 & 2032
- Figure 36: Asia Audio Conferencing Market Volume (Billion), by Country 2024 & 2032
- Figure 37: Asia Audio Conferencing Market Revenue Share (%), by Country 2024 & 2032
- Figure 38: Asia Audio Conferencing Market Volume Share (%), by Country 2024 & 2032
- Figure 39: Australia and New Zealand Audio Conferencing Market Revenue (Million), by Component 2024 & 2032
- Figure 40: Australia and New Zealand Audio Conferencing Market Volume (Billion), by Component 2024 & 2032
- Figure 41: Australia and New Zealand Audio Conferencing Market Revenue Share (%), by Component 2024 & 2032
- Figure 42: Australia and New Zealand Audio Conferencing Market Volume Share (%), by Component 2024 & 2032
- Figure 43: Australia and New Zealand Audio Conferencing Market Revenue (Million), by End User Vertical 2024 & 2032
- Figure 44: Australia and New Zealand Audio Conferencing Market Volume (Billion), by End User Vertical 2024 & 2032
- Figure 45: Australia and New Zealand Audio Conferencing Market Revenue Share (%), by End User Vertical 2024 & 2032
- Figure 46: Australia and New Zealand Audio Conferencing Market Volume Share (%), by End User Vertical 2024 & 2032
- Figure 47: Australia and New Zealand Audio Conferencing Market Revenue (Million), by Country 2024 & 2032
- Figure 48: Australia and New Zealand Audio Conferencing Market Volume (Billion), by Country 2024 & 2032
- Figure 49: Australia and New Zealand Audio Conferencing Market Revenue Share (%), by Country 2024 & 2032
- Figure 50: Australia and New Zealand Audio Conferencing Market Volume Share (%), by Country 2024 & 2032
- Figure 51: Latin America Audio Conferencing Market Revenue (Million), by Component 2024 & 2032
- Figure 52: Latin America Audio Conferencing Market Volume (Billion), by Component 2024 & 2032
- Figure 53: Latin America Audio Conferencing Market Revenue Share (%), by Component 2024 & 2032
- Figure 54: Latin America Audio Conferencing Market Volume Share (%), by Component 2024 & 2032
- Figure 55: Latin America Audio Conferencing Market Revenue (Million), by End User Vertical 2024 & 2032
- Figure 56: Latin America Audio Conferencing Market Volume (Billion), by End User Vertical 2024 & 2032
- Figure 57: Latin America Audio Conferencing Market Revenue Share (%), by End User Vertical 2024 & 2032
- Figure 58: Latin America Audio Conferencing Market Volume Share (%), by End User Vertical 2024 & 2032
- Figure 59: Latin America Audio Conferencing Market Revenue (Million), by Country 2024 & 2032
- Figure 60: Latin America Audio Conferencing Market Volume (Billion), by Country 2024 & 2032
- Figure 61: Latin America Audio Conferencing Market Revenue Share (%), by Country 2024 & 2032
- Figure 62: Latin America Audio Conferencing Market Volume Share (%), by Country 2024 & 2032
- Figure 63: Middle East and Africa Audio Conferencing Market Revenue (Million), by Component 2024 & 2032
- Figure 64: Middle East and Africa Audio Conferencing Market Volume (Billion), by Component 2024 & 2032
- Figure 65: Middle East and Africa Audio Conferencing Market Revenue Share (%), by Component 2024 & 2032
- Figure 66: Middle East and Africa Audio Conferencing Market Volume Share (%), by Component 2024 & 2032
- Figure 67: Middle East and Africa Audio Conferencing Market Revenue (Million), by End User Vertical 2024 & 2032
- Figure 68: Middle East and Africa Audio Conferencing Market Volume (Billion), by End User Vertical 2024 & 2032
- Figure 69: Middle East and Africa Audio Conferencing Market Revenue Share (%), by End User Vertical 2024 & 2032
- Figure 70: Middle East and Africa Audio Conferencing Market Volume Share (%), by End User Vertical 2024 & 2032
- Figure 71: Middle East and Africa Audio Conferencing Market Revenue (Million), by Country 2024 & 2032
- Figure 72: Middle East and Africa Audio Conferencing Market Volume (Billion), by Country 2024 & 2032
- Figure 73: Middle East and Africa Audio Conferencing Market Revenue Share (%), by Country 2024 & 2032
- Figure 74: Middle East and Africa Audio Conferencing Market Volume Share (%), by Country 2024 & 2032
List of Tables
- Table 1: Global Audio Conferencing Market Revenue Million Forecast, by Region 2019 & 2032
- Table 2: Global Audio Conferencing Market Volume Billion Forecast, by Region 2019 & 2032
- Table 3: Global Audio Conferencing Market Revenue Million Forecast, by Component 2019 & 2032
- Table 4: Global Audio Conferencing Market Volume Billion Forecast, by Component 2019 & 2032
- Table 5: Global Audio Conferencing Market Revenue Million Forecast, by End User Vertical 2019 & 2032
- Table 6: Global Audio Conferencing Market Volume Billion Forecast, by End User Vertical 2019 & 2032
- Table 7: Global Audio Conferencing Market Revenue Million Forecast, by Region 2019 & 2032
- Table 8: Global Audio Conferencing Market Volume Billion Forecast, by Region 2019 & 2032
- Table 9: Global Audio Conferencing Market Revenue Million Forecast, by Component 2019 & 2032
- Table 10: Global Audio Conferencing Market Volume Billion Forecast, by Component 2019 & 2032
- Table 11: Global Audio Conferencing Market Revenue Million Forecast, by End User Vertical 2019 & 2032
- Table 12: Global Audio Conferencing Market Volume Billion Forecast, by End User Vertical 2019 & 2032
- Table 13: Global Audio Conferencing Market Revenue Million Forecast, by Country 2019 & 2032
- Table 14: Global Audio Conferencing Market Volume Billion Forecast, by Country 2019 & 2032
- Table 15: Global Audio Conferencing Market Revenue Million Forecast, by Component 2019 & 2032
- Table 16: Global Audio Conferencing Market Volume Billion Forecast, by Component 2019 & 2032
- Table 17: Global Audio Conferencing Market Revenue Million Forecast, by End User Vertical 2019 & 2032
- Table 18: Global Audio Conferencing Market Volume Billion Forecast, by End User Vertical 2019 & 2032
- Table 19: Global Audio Conferencing Market Revenue Million Forecast, by Country 2019 & 2032
- Table 20: Global Audio Conferencing Market Volume Billion Forecast, by Country 2019 & 2032
- Table 21: Global Audio Conferencing Market Revenue Million Forecast, by Component 2019 & 2032
- Table 22: Global Audio Conferencing Market Volume Billion Forecast, by Component 2019 & 2032
- Table 23: Global Audio Conferencing Market Revenue Million Forecast, by End User Vertical 2019 & 2032
- Table 24: Global Audio Conferencing Market Volume Billion Forecast, by End User Vertical 2019 & 2032
- Table 25: Global Audio Conferencing Market Revenue Million Forecast, by Country 2019 & 2032
- Table 26: Global Audio Conferencing Market Volume Billion Forecast, by Country 2019 & 2032
- Table 27: Global Audio Conferencing Market Revenue Million Forecast, by Component 2019 & 2032
- Table 28: Global Audio Conferencing Market Volume Billion Forecast, by Component 2019 & 2032
- Table 29: Global Audio Conferencing Market Revenue Million Forecast, by End User Vertical 2019 & 2032
- Table 30: Global Audio Conferencing Market Volume Billion Forecast, by End User Vertical 2019 & 2032
- Table 31: Global Audio Conferencing Market Revenue Million Forecast, by Country 2019 & 2032
- Table 32: Global Audio Conferencing Market Volume Billion Forecast, by Country 2019 & 2032
- Table 33: Global Audio Conferencing Market Revenue Million Forecast, by Component 2019 & 2032
- Table 34: Global Audio Conferencing Market Volume Billion Forecast, by Component 2019 & 2032
- Table 35: Global Audio Conferencing Market Revenue Million Forecast, by End User Vertical 2019 & 2032
- Table 36: Global Audio Conferencing Market Volume Billion Forecast, by End User Vertical 2019 & 2032
- Table 37: Global Audio Conferencing Market Revenue Million Forecast, by Country 2019 & 2032
- Table 38: Global Audio Conferencing Market Volume Billion Forecast, by Country 2019 & 2032
- Table 39: Global Audio Conferencing Market Revenue Million Forecast, by Component 2019 & 2032
- Table 40: Global Audio Conferencing Market Volume Billion Forecast, by Component 2019 & 2032
- Table 41: Global Audio Conferencing Market Revenue Million Forecast, by End User Vertical 2019 & 2032
- Table 42: Global Audio Conferencing Market Volume Billion Forecast, by End User Vertical 2019 & 2032
- Table 43: Global Audio Conferencing Market Revenue Million Forecast, by Country 2019 & 2032
- Table 44: Global Audio Conferencing Market Volume Billion Forecast, by Country 2019 & 2032
Frequently Asked Questions
1. What is the projected Compound Annual Growth Rate (CAGR) of the Audio Conferencing Market?
The projected CAGR is approximately 9.06%.
2. Which companies are prominent players in the Audio Conferencing Market?
Key companies in the market include Zoom Video Communications Inc, Microsoft Corporation, Cisco, GoTo, RingCentral Inc, Grandstream Networks Inc, Google LLC (Alphabet Inc), Dialpad Inc, Avaya LLC, Philips Dictation, Vonage (Ericsson), ZipDX LLC, Mitel Networks Corporation*List Not Exhaustive.
3. What are the main segments of the Audio Conferencing Market?
The market segments include Component, End User Vertical.
4. Can you provide details about the market size?
The market size is estimated to be USD 19.10 Million as of 2022.
5. What are some drivers contributing to market growth?
Remote Work Adoption; Globalization of Businessess.
6. What are the notable trends driving market growth?
Corporate Communication Segment to Drive Opportunities in the Market.
7. Are there any restraints impacting market growth?
Remote Work Adoption; Globalization of Businessess.
8. Can you provide examples of recent developments in the market?
June 2024: Nureva Inc., a pioneer in advanced audio conferencing solutions, has received certification for its HDL310 and HDL410 systems as professional audio devices tailored for larger Zoom Rooms. Being USB devices, the HDL pro series systems seamlessly integrate into the design of any larger Zoom-enabled environment, be it classrooms, boardrooms, or training spaces. These systems feature one or two wall-mounted microphones and speaker bars paired with a compact connect module.January 2024: Google announced that Microsoft Teams is coming to Android Auto. Android Auto, an app that enables Android phones to connect to a car’s built-in system, was anticipated to introduce Microsoft’s communication and collaboration platform in February 2024.March 2024: Cisco introduced the Cisco Desk Phone 9800 Series, which aims to provide seamless and personalized collaboration experiences that are adaptable for both on-prem and cloud calling platforms. Moreover, it enhances every desk with enterprise calling features, including premium audio and AI-driven noise removal.
9. What pricing options are available for accessing the report?
Pricing options include single-user, multi-user, and enterprise licenses priced at USD 4750, USD 5250, and USD 8750 respectively.
10. Is the market size provided in terms of value or volume?
The market size is provided in terms of value, measured in Million and volume, measured in Billion.
11. Are there any specific market keywords associated with the report?
Yes, the market keyword associated with the report is "Audio Conferencing Market," which aids in identifying and referencing the specific market segment covered.
12. How do I determine which pricing option suits my needs best?
The pricing options vary based on user requirements and access needs. Individual users may opt for single-user licenses, while businesses requiring broader access may choose multi-user or enterprise licenses for cost-effective access to the report.
13. Are there any additional resources or data provided in the Audio Conferencing Market report?
While the report offers comprehensive insights, it's advisable to review the specific contents or supplementary materials provided to ascertain if additional resources or data are available.
14. How can I stay updated on further developments or reports in the Audio Conferencing Market?
To stay informed about further developments, trends, and reports in the Audio Conferencing Market, consider subscribing to industry newsletters, following relevant companies and organizations, or regularly checking reputable industry news sources and publications.
Methodology
Step 1 - Identification of Relevant Samples Size from Population Database


Step 2 - Approaches for Defining Global Market Size (Value, Volume* & Price*)

Note*: In applicable scenarios
Step 3 - Data Sources
Primary Research
- Web Analytics
- Survey Reports
- Research Institute
- Latest Research Reports
- Opinion Leaders
Secondary Research
- Annual Reports
- White Paper
- Latest Press Release
- Industry Association
- Paid Database
- Investor Presentations

Step 4 - Data Triangulation
Involves using different sources of information in order to increase the validity of a study
These sources are likely to be stakeholders in a program - participants, other researchers, program staff, other community members, and so on.
Then we put all data in single framework & apply various statistical tools to find out the dynamic on the market.
During the analysis stage, feedback from the stakeholder groups would be compared to determine areas of agreement as well as areas of divergence


