
Key Insights
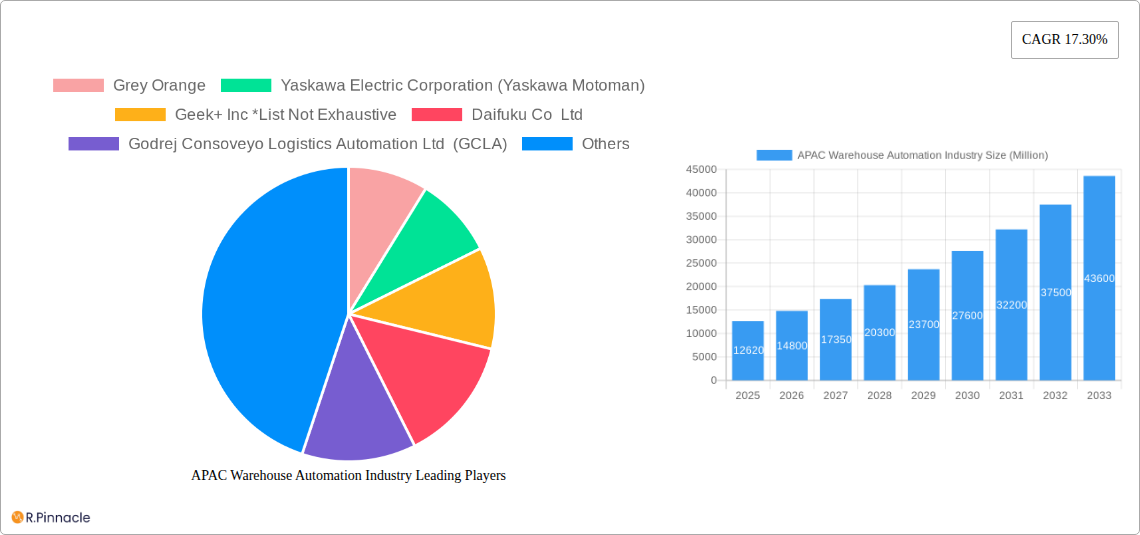
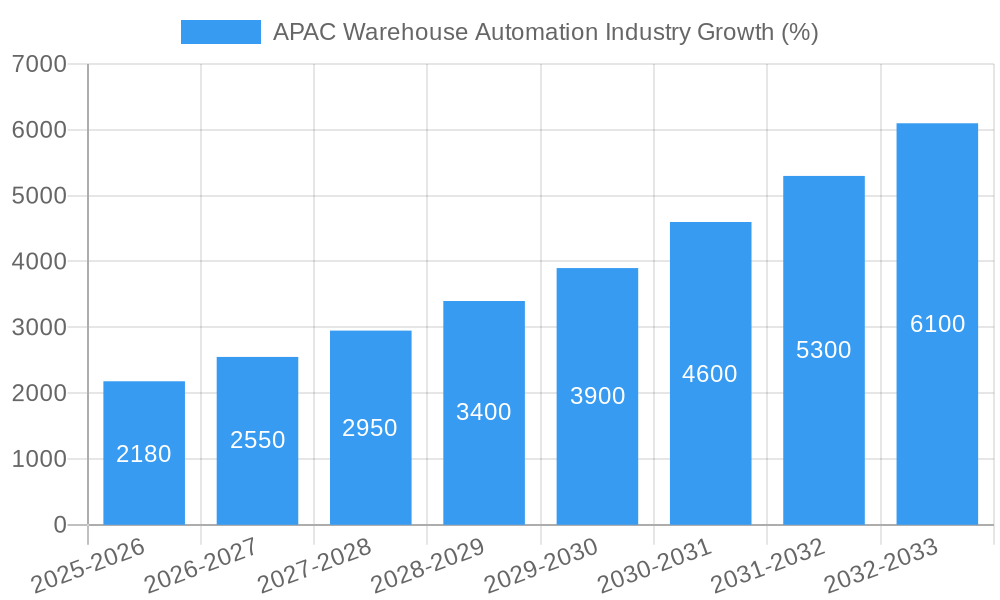
The Asia-Pacific (APAC) warehouse automation market is experiencing robust growth, driven by the burgeoning e-commerce sector, increasing labor costs, and the need for enhanced supply chain efficiency. The market, valued at $12.62 billion in 2025, is projected to witness a Compound Annual Growth Rate (CAGR) of 17.30% from 2025 to 2033. Key drivers include the rising adoption of automated guided vehicles (AGVs), autonomous mobile robots (AMRs), and advanced warehouse management systems (WMS) across various end-user industries. China and India are significant contributors to this growth, fueled by their expanding manufacturing and logistics sectors. The increasing demand for faster delivery times and improved order fulfillment accuracy further propels market expansion. Hardware components, particularly piece-picking robots, constitute a substantial portion of the market, followed by software solutions like WMS and WES, and supporting services. The food and beverage, post and parcel, and e-commerce sectors are prominent end-users. While challenges such as high initial investment costs and integration complexities exist, the long-term benefits of increased productivity, reduced operational costs, and improved accuracy outweigh these concerns, ensuring sustained market growth.
The segmentation within APAC reveals significant regional disparities. While China and India dominate the market, Japan and other nations in the region are also witnessing increasing adoption of warehouse automation technologies. The component-wise segmentation highlights the importance of software and services alongside hardware. The substantial growth in e-commerce and the expanding need for efficient last-mile delivery solutions are further strengthening the market's trajectory. Competitive intensity is high, with both global and regional players vying for market share. This competitive landscape fosters innovation and drives down costs, benefiting end-users. Future growth will likely be shaped by advancements in artificial intelligence (AI), machine learning (ML), and the Internet of Things (IoT), leading to more sophisticated and integrated warehouse automation solutions. The focus will likely shift towards enhancing flexibility and scalability of systems to meet evolving business needs.
APAC Warehouse Automation Industry: Market Analysis & Forecast 2019-2033
This comprehensive report provides an in-depth analysis of the Asia-Pacific (APAC) warehouse automation industry, offering invaluable insights for industry professionals, investors, and strategists. With a study period spanning 2019-2033, a base year of 2025, and a forecast period of 2025-2033, this report delivers a precise outlook on this rapidly evolving market, encompassing key trends, challenges, and opportunities. The market is valued at xx Million in 2025 and is projected to reach xx Million by 2033, exhibiting a robust CAGR of xx%.
APAC Warehouse Automation Industry Market Structure & Innovation Trends
The APAC warehouse automation market is characterized by a dynamic interplay of established players and emerging innovators. Market concentration is moderate, with several key players holding significant shares, but a fragmented landscape with numerous smaller companies. Grey Orange, Yaskawa Electric Corporation (Yaskawa Motoman), and Geek+ Inc. are prominent examples, alongside Daifuku Co Ltd, Godrej Consoveyo Logistics Automation Ltd (GCLA), Bastian Solution Private Limited, Murata Manufacturing Co Ltd, ABB Limited, ST Engineering, and Toshiba Global. However, the exact market share for each company is xx%. The industry is driven by increasing e-commerce penetration, rising labor costs, and the need for improved efficiency and supply chain resilience. Regulatory frameworks vary across countries, influencing adoption rates. Product substitutes include manual labor and legacy systems, but their competitiveness is diminishing due to automation's cost-effectiveness and efficiency gains. The end-user demographics are expanding to encompass diverse sectors, fueling market growth. M&A activity has been moderate, with deal values ranging from xx Million to xx Million, signifying consolidation and strategic expansion among players.
- Market Concentration: Moderate, with several major players and numerous smaller firms.
- Innovation Drivers: E-commerce growth, rising labor costs, need for efficiency.
- Regulatory Frameworks: Vary across APAC countries, influencing adoption.
- Product Substitutes: Manual labor, legacy systems (decreasing competitiveness).
- End-User Demographics: Expanding across diverse industries.
- M&A Activity: Moderate, with deal values ranging from xx Million to xx Million.
APAC Warehouse Automation Industry Market Dynamics & Trends
The APAC warehouse automation market is experiencing robust growth, fueled by several key factors. E-commerce expansion and the subsequent surge in demand for faster and more efficient order fulfillment are significant drivers. Technological advancements, particularly in robotics, AI, and IoT, are revolutionizing warehouse operations, enabling greater automation and optimization. Consumer preferences are shifting towards faster delivery times and increased transparency, putting pressure on businesses to adopt automation solutions. Competitive dynamics are characterized by intense innovation and strategic partnerships, as companies strive to gain a competitive edge. The market penetration of warehouse automation solutions is steadily increasing, driven by cost savings and improved efficiency. The market is anticipated to witness a CAGR of xx% during the forecast period.
Dominant Regions & Segments in APAC Warehouse Automation Industry
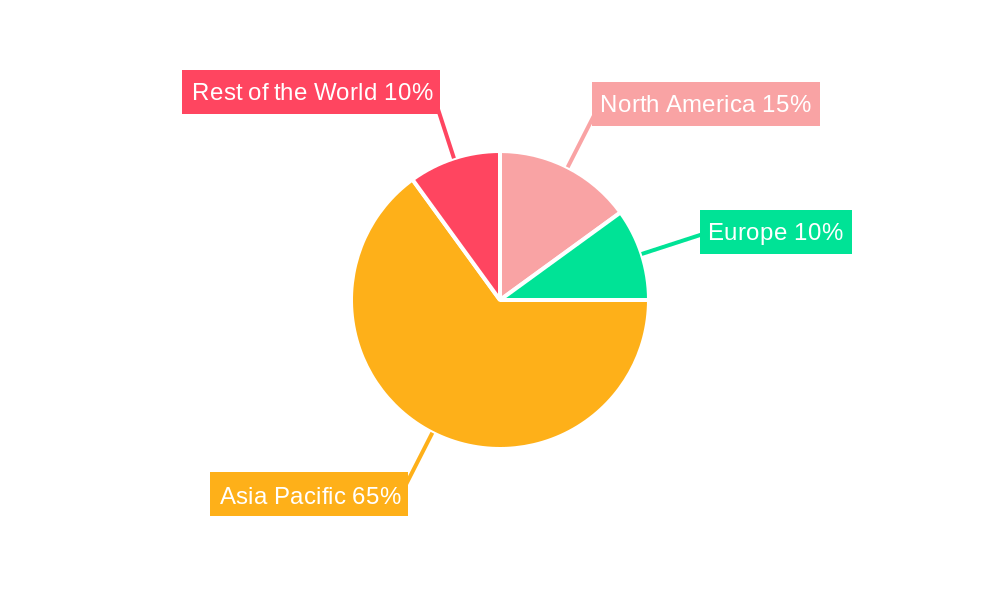
China remains the dominant region in the APAC warehouse automation market, followed by India and Japan. This dominance is attributed to several factors.
- China: Large e-commerce market, robust manufacturing sector, government support for technological advancement.
- India: Growing e-commerce penetration, rising labor costs, favorable government policies.
- Japan: Highly advanced manufacturing sector, focus on automation and efficiency.
- Rest of APAC: Growing adoption rates driven by increasing e-commerce and logistics expansion.
Within the segments:
- Hardware: This segment holds the largest market share due to the fundamental role of automated equipment in warehouse operations.
- Software (WMS & WES): Essential for managing and optimizing warehouse processes, growing rapidly.
- Services (Value-added & Maintenance): Crucial for ensuring the smooth operation and longevity of automated systems; experiencing a steady rise in demand.
- End-users: Food and beverage, post and parcel, and groceries are leading end-user segments, driven by increasing demand for efficient handling of large volumes of goods.
APAC Warehouse Automation Industry Product Innovations
The APAC warehouse automation industry is witnessing rapid innovation in robotics, AI-powered solutions, and cloud-based software. Autonomous mobile robots (AMRs) are gaining traction, enhancing warehouse efficiency and flexibility. Advanced warehouse management systems (WMS) and warehouse execution systems (WES) are providing enhanced visibility and control over warehouse operations. These innovations are improving accuracy, speed, and cost-effectiveness, catering to the growing demand for faster and more efficient logistics. The market fit for these innovations is strong, with companies actively adopting them to improve their supply chain operations.
Report Scope & Segmentation Analysis
This report segments the APAC warehouse automation market across multiple dimensions:
- Country: China, India, Japan, and Rest of APAC. Growth projections vary by country based on economic factors and adoption rates.
- Component: Hardware, Software (WMS, WES), and Services. Market sizes and competitive dynamics differ across components.
- End-User: Food & Beverage, Post & Parcel, Groceries, General Merchandise, Apparel, Manufacturing (Durable & Non-Durable), Other. Each end-user segment exhibits unique automation needs and adoption patterns. Market size varies based on the specific industry and its automation requirements.
Key Drivers of APAC Warehouse Automation Industry Growth
The APAC warehouse automation market's growth is driven by factors such as the burgeoning e-commerce sector, a rising need to improve supply chain efficiency, and increasing labor costs. Government initiatives promoting automation and technological advancements in robotics, AI, and IoT further fuel market expansion. The growing demand for faster delivery times and improved order fulfillment accuracy also contributes to the adoption of automation technologies across the region.
Challenges in the APAC Warehouse Automation Industry Sector
Challenges include high initial investment costs, the need for skilled labor to operate and maintain automated systems, and concerns about job displacement due to automation. Integration complexities and the cybersecurity risks associated with interconnected systems pose additional hurdles. Variations in regulatory frameworks across different countries also add to the complexities of market penetration.
Emerging Opportunities in APAC Warehouse Automation Industry
Emerging opportunities include the integration of advanced technologies such as AI, machine learning, and blockchain for enhanced warehouse operations. The expansion of automation solutions into new market segments, such as healthcare and pharmaceuticals, offers significant growth potential. The increasing demand for sustainable and environmentally friendly warehousing solutions also presents opportunities for innovative technologies.
Leading Players in the APAC Warehouse Automation Industry Market
- Grey Orange (Grey Orange)
- Yaskawa Electric Corporation (Yaskawa Motoman) (Yaskawa)
- Geek+ Inc (Geek+)
- Daifuku Co Ltd (Daifuku)
- Godrej Consoveyo Logistics Automation Ltd (GCLA)
- Bastian Solution Private Limited
- Murata Manufacturing Co Ltd (Murata)
- ABB Limited (ABB)
- ST Engineering (ST Engineering)
- Toshiba Global (Toshiba)
Key Developments in APAC Warehouse Automation Industry
- October 2021: DHL launched the Asia Pacific Innovation Center in Singapore, showcasing Geek+’s robotic automation solutions.
- June 2020: Cohesio Group partnered with Fetch Robotics to deliver advanced automation solutions for retailers and logistics providers in APAC, promising productivity gains of over 200%.
- March 2020: Aurionpro Solutions Ltd. onboarded ColdrushLogistics to enhance warehouse procedures and management within the Indian cold chain sector.
Future Outlook for APAC Warehouse Automation Industry Market
The APAC warehouse automation market is poised for significant growth, driven by continuous technological advancements, rising e-commerce penetration, and increasing demand for efficient supply chain solutions. Strategic partnerships, investments in R&D, and the expansion into new market segments will shape the industry's future. The focus on sustainability and the integration of advanced technologies will further drive market expansion and innovation in the coming years.
APAC Warehouse Automation Industry Segmentation
-
1. Component
-
1.1. Hardware
- 1.1.1. Mobile Robots (AGV, AMR)
- 1.1.2. Automated Storage and Retrieval Systems (AS/RS)
- 1.1.3. Automated Conveyor & Sorting Systems
- 1.1.4. De-palletizing/Palletizing Systems
- 1.1.5. Automati
- 1.1.6. Piece Picking Robots
- 1.2. Software
- 1.3. Services (Value Added Services, Maintenance, etc.)
-
1.1. Hardware
-
2. End-User
- 2.1. Food and
- 2.2. Post and Parcel
- 2.3. Groceries
- 2.4. General Merchandise
- 2.5. Apparel
- 2.6. Manufacturing (Durable and Non-Durable)
- 2.7. Other End-user Industries
APAC Warehouse Automation Industry Segmentation By Geography
-
1. North America
- 1.1. United States
- 1.2. Canada
- 1.3. Mexico
-
2. South America
- 2.1. Brazil
- 2.2. Argentina
- 2.3. Rest of South America
-
3. Europe
- 3.1. United Kingdom
- 3.2. Germany
- 3.3. France
- 3.4. Italy
- 3.5. Spain
- 3.6. Russia
- 3.7. Benelux
- 3.8. Nordics
- 3.9. Rest of Europe
-
4. Middle East & Africa
- 4.1. Turkey
- 4.2. Israel
- 4.3. GCC
- 4.4. North Africa
- 4.5. South Africa
- 4.6. Rest of Middle East & Africa
-
5. Asia Pacific
- 5.1. China
- 5.2. India
- 5.3. Japan
- 5.4. South Korea
- 5.5. ASEAN
- 5.6. Oceania
- 5.7. Rest of Asia Pacific
APAC Warehouse Automation Industry REPORT HIGHLIGHTS
| Aspects | Details |
|---|---|
| Study Period | 2019-2033 |
| Base Year | 2024 |
| Estimated Year | 2025 |
| Forecast Period | 2025-2033 |
| Historical Period | 2019-2024 |
| Growth Rate | CAGR of 17.30% from 2019-2033 |
| Segmentation |
|
Table of Contents
- 1. Introduction
- 1.1. Research Scope
- 1.2. Market Segmentation
- 1.3. Research Methodology
- 1.4. Definitions and Assumptions
- 2. Executive Summary
- 2.1. Introduction
- 3. Market Dynamics
- 3.1. Introduction
- 3.2. Market Drivers
- 3.2.1. Exponential Growth of the E-commerce Industry and Customer Expectation; Increasing Need for Better Inventory Management and Control
- 3.3. Market Restrains
- 3.3.1. ; High Cost of Implementation
- 3.4. Market Trends
- 3.4.1. Automated Guided Vehicles (AGVs) is Expected to Have a Significant Growth
- 4. Market Factor Analysis
- 4.1. Porters Five Forces
- 4.2. Supply/Value Chain
- 4.3. PESTEL analysis
- 4.4. Market Entropy
- 4.5. Patent/Trademark Analysis
- 5. Global APAC Warehouse Automation Industry Analysis, Insights and Forecast, 2019-2031
- 5.1. Market Analysis, Insights and Forecast - by Component
- 5.1.1. Hardware
- 5.1.1.1. Mobile Robots (AGV, AMR)
- 5.1.1.2. Automated Storage and Retrieval Systems (AS/RS)
- 5.1.1.3. Automated Conveyor & Sorting Systems
- 5.1.1.4. De-palletizing/Palletizing Systems
- 5.1.1.5. Automati
- 5.1.1.6. Piece Picking Robots
- 5.1.2. Software
- 5.1.3. Services (Value Added Services, Maintenance, etc.)
- 5.1.1. Hardware
- 5.2. Market Analysis, Insights and Forecast - by End-User
- 5.2.1. Food and
- 5.2.2. Post and Parcel
- 5.2.3. Groceries
- 5.2.4. General Merchandise
- 5.2.5. Apparel
- 5.2.6. Manufacturing (Durable and Non-Durable)
- 5.2.7. Other End-user Industries
- 5.3. Market Analysis, Insights and Forecast - by Region
- 5.3.1. North America
- 5.3.2. South America
- 5.3.3. Europe
- 5.3.4. Middle East & Africa
- 5.3.5. Asia Pacific
- 5.1. Market Analysis, Insights and Forecast - by Component
- 6. North America APAC Warehouse Automation Industry Analysis, Insights and Forecast, 2019-2031
- 6.1. Market Analysis, Insights and Forecast - by Component
- 6.1.1. Hardware
- 6.1.1.1. Mobile Robots (AGV, AMR)
- 6.1.1.2. Automated Storage and Retrieval Systems (AS/RS)
- 6.1.1.3. Automated Conveyor & Sorting Systems
- 6.1.1.4. De-palletizing/Palletizing Systems
- 6.1.1.5. Automati
- 6.1.1.6. Piece Picking Robots
- 6.1.2. Software
- 6.1.3. Services (Value Added Services, Maintenance, etc.)
- 6.1.1. Hardware
- 6.2. Market Analysis, Insights and Forecast - by End-User
- 6.2.1. Food and
- 6.2.2. Post and Parcel
- 6.2.3. Groceries
- 6.2.4. General Merchandise
- 6.2.5. Apparel
- 6.2.6. Manufacturing (Durable and Non-Durable)
- 6.2.7. Other End-user Industries
- 6.1. Market Analysis, Insights and Forecast - by Component
- 7. South America APAC Warehouse Automation Industry Analysis, Insights and Forecast, 2019-2031
- 7.1. Market Analysis, Insights and Forecast - by Component
- 7.1.1. Hardware
- 7.1.1.1. Mobile Robots (AGV, AMR)
- 7.1.1.2. Automated Storage and Retrieval Systems (AS/RS)
- 7.1.1.3. Automated Conveyor & Sorting Systems
- 7.1.1.4. De-palletizing/Palletizing Systems
- 7.1.1.5. Automati
- 7.1.1.6. Piece Picking Robots
- 7.1.2. Software
- 7.1.3. Services (Value Added Services, Maintenance, etc.)
- 7.1.1. Hardware
- 7.2. Market Analysis, Insights and Forecast - by End-User
- 7.2.1. Food and
- 7.2.2. Post and Parcel
- 7.2.3. Groceries
- 7.2.4. General Merchandise
- 7.2.5. Apparel
- 7.2.6. Manufacturing (Durable and Non-Durable)
- 7.2.7. Other End-user Industries
- 7.1. Market Analysis, Insights and Forecast - by Component
- 8. Europe APAC Warehouse Automation Industry Analysis, Insights and Forecast, 2019-2031
- 8.1. Market Analysis, Insights and Forecast - by Component
- 8.1.1. Hardware
- 8.1.1.1. Mobile Robots (AGV, AMR)
- 8.1.1.2. Automated Storage and Retrieval Systems (AS/RS)
- 8.1.1.3. Automated Conveyor & Sorting Systems
- 8.1.1.4. De-palletizing/Palletizing Systems
- 8.1.1.5. Automati
- 8.1.1.6. Piece Picking Robots
- 8.1.2. Software
- 8.1.3. Services (Value Added Services, Maintenance, etc.)
- 8.1.1. Hardware
- 8.2. Market Analysis, Insights and Forecast - by End-User
- 8.2.1. Food and
- 8.2.2. Post and Parcel
- 8.2.3. Groceries
- 8.2.4. General Merchandise
- 8.2.5. Apparel
- 8.2.6. Manufacturing (Durable and Non-Durable)
- 8.2.7. Other End-user Industries
- 8.1. Market Analysis, Insights and Forecast - by Component
- 9. Middle East & Africa APAC Warehouse Automation Industry Analysis, Insights and Forecast, 2019-2031
- 9.1. Market Analysis, Insights and Forecast - by Component
- 9.1.1. Hardware
- 9.1.1.1. Mobile Robots (AGV, AMR)
- 9.1.1.2. Automated Storage and Retrieval Systems (AS/RS)
- 9.1.1.3. Automated Conveyor & Sorting Systems
- 9.1.1.4. De-palletizing/Palletizing Systems
- 9.1.1.5. Automati
- 9.1.1.6. Piece Picking Robots
- 9.1.2. Software
- 9.1.3. Services (Value Added Services, Maintenance, etc.)
- 9.1.1. Hardware
- 9.2. Market Analysis, Insights and Forecast - by End-User
- 9.2.1. Food and
- 9.2.2. Post and Parcel
- 9.2.3. Groceries
- 9.2.4. General Merchandise
- 9.2.5. Apparel
- 9.2.6. Manufacturing (Durable and Non-Durable)
- 9.2.7. Other End-user Industries
- 9.1. Market Analysis, Insights and Forecast - by Component
- 10. Asia Pacific APAC Warehouse Automation Industry Analysis, Insights and Forecast, 2019-2031
- 10.1. Market Analysis, Insights and Forecast - by Component
- 10.1.1. Hardware
- 10.1.1.1. Mobile Robots (AGV, AMR)
- 10.1.1.2. Automated Storage and Retrieval Systems (AS/RS)
- 10.1.1.3. Automated Conveyor & Sorting Systems
- 10.1.1.4. De-palletizing/Palletizing Systems
- 10.1.1.5. Automati
- 10.1.1.6. Piece Picking Robots
- 10.1.2. Software
- 10.1.3. Services (Value Added Services, Maintenance, etc.)
- 10.1.1. Hardware
- 10.2. Market Analysis, Insights and Forecast - by End-User
- 10.2.1. Food and
- 10.2.2. Post and Parcel
- 10.2.3. Groceries
- 10.2.4. General Merchandise
- 10.2.5. Apparel
- 10.2.6. Manufacturing (Durable and Non-Durable)
- 10.2.7. Other End-user Industries
- 10.1. Market Analysis, Insights and Forecast - by Component
- 11. North America APAC Warehouse Automation Industry Analysis, Insights and Forecast, 2019-2031
- 11.1. Market Analysis, Insights and Forecast - By Country/Sub-region
- 11.1.1.
- 12. Europe APAC Warehouse Automation Industry Analysis, Insights and Forecast, 2019-2031
- 12.1. Market Analysis, Insights and Forecast - By Country/Sub-region
- 12.1.1.
- 13. Asia Pacific APAC Warehouse Automation Industry Analysis, Insights and Forecast, 2019-2031
- 13.1. Market Analysis, Insights and Forecast - By Country/Sub-region
- 13.1.1.
- 14. Rest of the World APAC Warehouse Automation Industry Analysis, Insights and Forecast, 2019-2031
- 14.1. Market Analysis, Insights and Forecast - By Country/Sub-region
- 14.1.1.
- 15. Competitive Analysis
- 15.1. Global Market Share Analysis 2024
- 15.2. Company Profiles
- 15.2.1 Grey Orange
- 15.2.1.1. Overview
- 15.2.1.2. Products
- 15.2.1.3. SWOT Analysis
- 15.2.1.4. Recent Developments
- 15.2.1.5. Financials (Based on Availability)
- 15.2.2 Yaskawa Electric Corporation (Yaskawa Motoman)
- 15.2.2.1. Overview
- 15.2.2.2. Products
- 15.2.2.3. SWOT Analysis
- 15.2.2.4. Recent Developments
- 15.2.2.5. Financials (Based on Availability)
- 15.2.3 Geek+ Inc *List Not Exhaustive
- 15.2.3.1. Overview
- 15.2.3.2. Products
- 15.2.3.3. SWOT Analysis
- 15.2.3.4. Recent Developments
- 15.2.3.5. Financials (Based on Availability)
- 15.2.4 Daifuku Co Ltd
- 15.2.4.1. Overview
- 15.2.4.2. Products
- 15.2.4.3. SWOT Analysis
- 15.2.4.4. Recent Developments
- 15.2.4.5. Financials (Based on Availability)
- 15.2.5 Godrej Consoveyo Logistics Automation Ltd (GCLA)
- 15.2.5.1. Overview
- 15.2.5.2. Products
- 15.2.5.3. SWOT Analysis
- 15.2.5.4. Recent Developments
- 15.2.5.5. Financials (Based on Availability)
- 15.2.6 Bastian Solution Private Limited
- 15.2.6.1. Overview
- 15.2.6.2. Products
- 15.2.6.3. SWOT Analysis
- 15.2.6.4. Recent Developments
- 15.2.6.5. Financials (Based on Availability)
- 15.2.7 Murata Manufacturing Co Ltd
- 15.2.7.1. Overview
- 15.2.7.2. Products
- 15.2.7.3. SWOT Analysis
- 15.2.7.4. Recent Developments
- 15.2.7.5. Financials (Based on Availability)
- 15.2.8 ABB Limited
- 15.2.8.1. Overview
- 15.2.8.2. Products
- 15.2.8.3. SWOT Analysis
- 15.2.8.4. Recent Developments
- 15.2.8.5. Financials (Based on Availability)
- 15.2.9 ST Engineering
- 15.2.9.1. Overview
- 15.2.9.2. Products
- 15.2.9.3. SWOT Analysis
- 15.2.9.4. Recent Developments
- 15.2.9.5. Financials (Based on Availability)
- 15.2.10 Toshiba Global
- 15.2.10.1. Overview
- 15.2.10.2. Products
- 15.2.10.3. SWOT Analysis
- 15.2.10.4. Recent Developments
- 15.2.10.5. Financials (Based on Availability)
- 15.2.1 Grey Orange
List of Figures
- Figure 1: Global APAC Warehouse Automation Industry Revenue Breakdown (Million, %) by Region 2024 & 2032
- Figure 2: North America APAC Warehouse Automation Industry Revenue (Million), by Country 2024 & 2032
- Figure 3: North America APAC Warehouse Automation Industry Revenue Share (%), by Country 2024 & 2032
- Figure 4: Europe APAC Warehouse Automation Industry Revenue (Million), by Country 2024 & 2032
- Figure 5: Europe APAC Warehouse Automation Industry Revenue Share (%), by Country 2024 & 2032
- Figure 6: Asia Pacific APAC Warehouse Automation Industry Revenue (Million), by Country 2024 & 2032
- Figure 7: Asia Pacific APAC Warehouse Automation Industry Revenue Share (%), by Country 2024 & 2032
- Figure 8: Rest of the World APAC Warehouse Automation Industry Revenue (Million), by Country 2024 & 2032
- Figure 9: Rest of the World APAC Warehouse Automation Industry Revenue Share (%), by Country 2024 & 2032
- Figure 10: North America APAC Warehouse Automation Industry Revenue (Million), by Component 2024 & 2032
- Figure 11: North America APAC Warehouse Automation Industry Revenue Share (%), by Component 2024 & 2032
- Figure 12: North America APAC Warehouse Automation Industry Revenue (Million), by End-User 2024 & 2032
- Figure 13: North America APAC Warehouse Automation Industry Revenue Share (%), by End-User 2024 & 2032
- Figure 14: North America APAC Warehouse Automation Industry Revenue (Million), by Country 2024 & 2032
- Figure 15: North America APAC Warehouse Automation Industry Revenue Share (%), by Country 2024 & 2032
- Figure 16: South America APAC Warehouse Automation Industry Revenue (Million), by Component 2024 & 2032
- Figure 17: South America APAC Warehouse Automation Industry Revenue Share (%), by Component 2024 & 2032
- Figure 18: South America APAC Warehouse Automation Industry Revenue (Million), by End-User 2024 & 2032
- Figure 19: South America APAC Warehouse Automation Industry Revenue Share (%), by End-User 2024 & 2032
- Figure 20: South America APAC Warehouse Automation Industry Revenue (Million), by Country 2024 & 2032
- Figure 21: South America APAC Warehouse Automation Industry Revenue Share (%), by Country 2024 & 2032
- Figure 22: Europe APAC Warehouse Automation Industry Revenue (Million), by Component 2024 & 2032
- Figure 23: Europe APAC Warehouse Automation Industry Revenue Share (%), by Component 2024 & 2032
- Figure 24: Europe APAC Warehouse Automation Industry Revenue (Million), by End-User 2024 & 2032
- Figure 25: Europe APAC Warehouse Automation Industry Revenue Share (%), by End-User 2024 & 2032
- Figure 26: Europe APAC Warehouse Automation Industry Revenue (Million), by Country 2024 & 2032
- Figure 27: Europe APAC Warehouse Automation Industry Revenue Share (%), by Country 2024 & 2032
- Figure 28: Middle East & Africa APAC Warehouse Automation Industry Revenue (Million), by Component 2024 & 2032
- Figure 29: Middle East & Africa APAC Warehouse Automation Industry Revenue Share (%), by Component 2024 & 2032
- Figure 30: Middle East & Africa APAC Warehouse Automation Industry Revenue (Million), by End-User 2024 & 2032
- Figure 31: Middle East & Africa APAC Warehouse Automation Industry Revenue Share (%), by End-User 2024 & 2032
- Figure 32: Middle East & Africa APAC Warehouse Automation Industry Revenue (Million), by Country 2024 & 2032
- Figure 33: Middle East & Africa APAC Warehouse Automation Industry Revenue Share (%), by Country 2024 & 2032
- Figure 34: Asia Pacific APAC Warehouse Automation Industry Revenue (Million), by Component 2024 & 2032
- Figure 35: Asia Pacific APAC Warehouse Automation Industry Revenue Share (%), by Component 2024 & 2032
- Figure 36: Asia Pacific APAC Warehouse Automation Industry Revenue (Million), by End-User 2024 & 2032
- Figure 37: Asia Pacific APAC Warehouse Automation Industry Revenue Share (%), by End-User 2024 & 2032
- Figure 38: Asia Pacific APAC Warehouse Automation Industry Revenue (Million), by Country 2024 & 2032
- Figure 39: Asia Pacific APAC Warehouse Automation Industry Revenue Share (%), by Country 2024 & 2032
List of Tables
- Table 1: Global APAC Warehouse Automation Industry Revenue Million Forecast, by Region 2019 & 2032
- Table 2: Global APAC Warehouse Automation Industry Revenue Million Forecast, by Component 2019 & 2032
- Table 3: Global APAC Warehouse Automation Industry Revenue Million Forecast, by End-User 2019 & 2032
- Table 4: Global APAC Warehouse Automation Industry Revenue Million Forecast, by Region 2019 & 2032
- Table 5: Global APAC Warehouse Automation Industry Revenue Million Forecast, by Country 2019 & 2032
- Table 6: APAC Warehouse Automation Industry Revenue (Million) Forecast, by Application 2019 & 2032
- Table 7: Global APAC Warehouse Automation Industry Revenue Million Forecast, by Country 2019 & 2032
- Table 8: APAC Warehouse Automation Industry Revenue (Million) Forecast, by Application 2019 & 2032
- Table 9: Global APAC Warehouse Automation Industry Revenue Million Forecast, by Country 2019 & 2032
- Table 10: APAC Warehouse Automation Industry Revenue (Million) Forecast, by Application 2019 & 2032
- Table 11: Global APAC Warehouse Automation Industry Revenue Million Forecast, by Country 2019 & 2032
- Table 12: APAC Warehouse Automation Industry Revenue (Million) Forecast, by Application 2019 & 2032
- Table 13: Global APAC Warehouse Automation Industry Revenue Million Forecast, by Component 2019 & 2032
- Table 14: Global APAC Warehouse Automation Industry Revenue Million Forecast, by End-User 2019 & 2032
- Table 15: Global APAC Warehouse Automation Industry Revenue Million Forecast, by Country 2019 & 2032
- Table 16: United States APAC Warehouse Automation Industry Revenue (Million) Forecast, by Application 2019 & 2032
- Table 17: Canada APAC Warehouse Automation Industry Revenue (Million) Forecast, by Application 2019 & 2032
- Table 18: Mexico APAC Warehouse Automation Industry Revenue (Million) Forecast, by Application 2019 & 2032
- Table 19: Global APAC Warehouse Automation Industry Revenue Million Forecast, by Component 2019 & 2032
- Table 20: Global APAC Warehouse Automation Industry Revenue Million Forecast, by End-User 2019 & 2032
- Table 21: Global APAC Warehouse Automation Industry Revenue Million Forecast, by Country 2019 & 2032
- Table 22: Brazil APAC Warehouse Automation Industry Revenue (Million) Forecast, by Application 2019 & 2032
- Table 23: Argentina APAC Warehouse Automation Industry Revenue (Million) Forecast, by Application 2019 & 2032
- Table 24: Rest of South America APAC Warehouse Automation Industry Revenue (Million) Forecast, by Application 2019 & 2032
- Table 25: Global APAC Warehouse Automation Industry Revenue Million Forecast, by Component 2019 & 2032
- Table 26: Global APAC Warehouse Automation Industry Revenue Million Forecast, by End-User 2019 & 2032
- Table 27: Global APAC Warehouse Automation Industry Revenue Million Forecast, by Country 2019 & 2032
- Table 28: United Kingdom APAC Warehouse Automation Industry Revenue (Million) Forecast, by Application 2019 & 2032
- Table 29: Germany APAC Warehouse Automation Industry Revenue (Million) Forecast, by Application 2019 & 2032
- Table 30: France APAC Warehouse Automation Industry Revenue (Million) Forecast, by Application 2019 & 2032
- Table 31: Italy APAC Warehouse Automation Industry Revenue (Million) Forecast, by Application 2019 & 2032
- Table 32: Spain APAC Warehouse Automation Industry Revenue (Million) Forecast, by Application 2019 & 2032
- Table 33: Russia APAC Warehouse Automation Industry Revenue (Million) Forecast, by Application 2019 & 2032
- Table 34: Benelux APAC Warehouse Automation Industry Revenue (Million) Forecast, by Application 2019 & 2032
- Table 35: Nordics APAC Warehouse Automation Industry Revenue (Million) Forecast, by Application 2019 & 2032
- Table 36: Rest of Europe APAC Warehouse Automation Industry Revenue (Million) Forecast, by Application 2019 & 2032
- Table 37: Global APAC Warehouse Automation Industry Revenue Million Forecast, by Component 2019 & 2032
- Table 38: Global APAC Warehouse Automation Industry Revenue Million Forecast, by End-User 2019 & 2032
- Table 39: Global APAC Warehouse Automation Industry Revenue Million Forecast, by Country 2019 & 2032
- Table 40: Turkey APAC Warehouse Automation Industry Revenue (Million) Forecast, by Application 2019 & 2032
- Table 41: Israel APAC Warehouse Automation Industry Revenue (Million) Forecast, by Application 2019 & 2032
- Table 42: GCC APAC Warehouse Automation Industry Revenue (Million) Forecast, by Application 2019 & 2032
- Table 43: North Africa APAC Warehouse Automation Industry Revenue (Million) Forecast, by Application 2019 & 2032
- Table 44: South Africa APAC Warehouse Automation Industry Revenue (Million) Forecast, by Application 2019 & 2032
- Table 45: Rest of Middle East & Africa APAC Warehouse Automation Industry Revenue (Million) Forecast, by Application 2019 & 2032
- Table 46: Global APAC Warehouse Automation Industry Revenue Million Forecast, by Component 2019 & 2032
- Table 47: Global APAC Warehouse Automation Industry Revenue Million Forecast, by End-User 2019 & 2032
- Table 48: Global APAC Warehouse Automation Industry Revenue Million Forecast, by Country 2019 & 2032
- Table 49: China APAC Warehouse Automation Industry Revenue (Million) Forecast, by Application 2019 & 2032
- Table 50: India APAC Warehouse Automation Industry Revenue (Million) Forecast, by Application 2019 & 2032
- Table 51: Japan APAC Warehouse Automation Industry Revenue (Million) Forecast, by Application 2019 & 2032
- Table 52: South Korea APAC Warehouse Automation Industry Revenue (Million) Forecast, by Application 2019 & 2032
- Table 53: ASEAN APAC Warehouse Automation Industry Revenue (Million) Forecast, by Application 2019 & 2032
- Table 54: Oceania APAC Warehouse Automation Industry Revenue (Million) Forecast, by Application 2019 & 2032
- Table 55: Rest of Asia Pacific APAC Warehouse Automation Industry Revenue (Million) Forecast, by Application 2019 & 2032
Frequently Asked Questions
1. What is the projected Compound Annual Growth Rate (CAGR) of the APAC Warehouse Automation Industry?
The projected CAGR is approximately 17.30%.
2. Which companies are prominent players in the APAC Warehouse Automation Industry?
Key companies in the market include Grey Orange, Yaskawa Electric Corporation (Yaskawa Motoman), Geek+ Inc *List Not Exhaustive, Daifuku Co Ltd, Godrej Consoveyo Logistics Automation Ltd (GCLA), Bastian Solution Private Limited, Murata Manufacturing Co Ltd, ABB Limited, ST Engineering, Toshiba Global.
3. What are the main segments of the APAC Warehouse Automation Industry?
The market segments include Component, End-User.
4. Can you provide details about the market size?
The market size is estimated to be USD 12.62 Million as of 2022.
5. What are some drivers contributing to market growth?
Exponential Growth of the E-commerce Industry and Customer Expectation; Increasing Need for Better Inventory Management and Control.
6. What are the notable trends driving market growth?
Automated Guided Vehicles (AGVs) is Expected to Have a Significant Growth.
7. Are there any restraints impacting market growth?
; High Cost of Implementation.
8. Can you provide examples of recent developments in the market?
October 2021 - DHL created the Asia Pacific Innovation Center in Singapore as a home for new exhibits that showcase a cutting-edge, automated, and completely integrated e-commerce solution. At the Asia Pacific Innovation Center, Geek+ announced a collaboration with DHL to exhibit some of the latest innovations from Geek+. Geek+ and DHL will showcase the future of robotics automation in warehouses.
9. What pricing options are available for accessing the report?
Pricing options include single-user, multi-user, and enterprise licenses priced at USD 4750, USD 4950, and USD 6800 respectively.
10. Is the market size provided in terms of value or volume?
The market size is provided in terms of value, measured in Million.
11. Are there any specific market keywords associated with the report?
Yes, the market keyword associated with the report is "APAC Warehouse Automation Industry," which aids in identifying and referencing the specific market segment covered.
12. How do I determine which pricing option suits my needs best?
The pricing options vary based on user requirements and access needs. Individual users may opt for single-user licenses, while businesses requiring broader access may choose multi-user or enterprise licenses for cost-effective access to the report.
13. Are there any additional resources or data provided in the APAC Warehouse Automation Industry report?
While the report offers comprehensive insights, it's advisable to review the specific contents or supplementary materials provided to ascertain if additional resources or data are available.
14. How can I stay updated on further developments or reports in the APAC Warehouse Automation Industry?
To stay informed about further developments, trends, and reports in the APAC Warehouse Automation Industry, consider subscribing to industry newsletters, following relevant companies and organizations, or regularly checking reputable industry news sources and publications.
Methodology
Step 1 - Identification of Relevant Samples Size from Population Database


Step 2 - Approaches for Defining Global Market Size (Value, Volume* & Price*)

Note*: In applicable scenarios
Step 3 - Data Sources
Primary Research
- Web Analytics
- Survey Reports
- Research Institute
- Latest Research Reports
- Opinion Leaders
Secondary Research
- Annual Reports
- White Paper
- Latest Press Release
- Industry Association
- Paid Database
- Investor Presentations

Step 4 - Data Triangulation
Involves using different sources of information in order to increase the validity of a study
These sources are likely to be stakeholders in a program - participants, other researchers, program staff, other community members, and so on.
Then we put all data in single framework & apply various statistical tools to find out the dynamic on the market.
During the analysis stage, feedback from the stakeholder groups would be compared to determine areas of agreement as well as areas of divergence


