
Key Insights
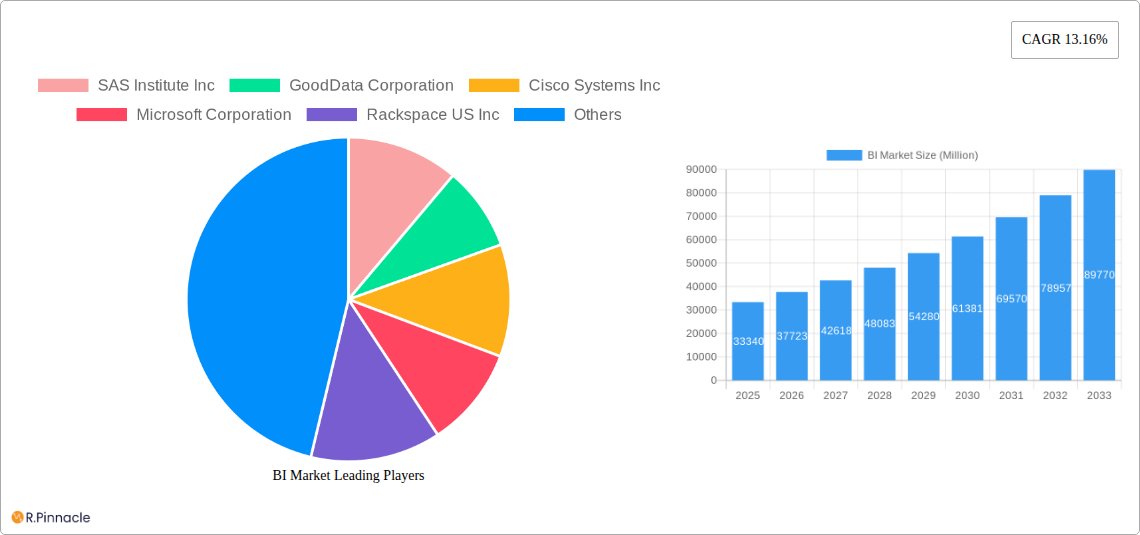
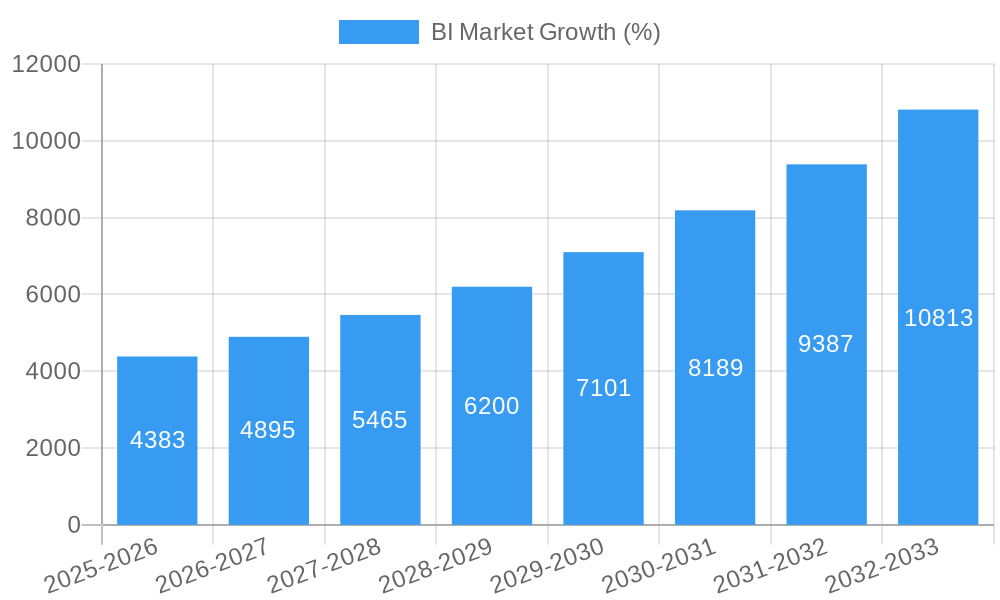
The Business Intelligence (BI) market is experiencing robust growth, projected to reach a market size of $33.34 billion in 2025, expanding at a Compound Annual Growth Rate (CAGR) of 13.16%. This significant expansion is driven by several key factors. The increasing adoption of cloud-based BI solutions offers scalability, cost-effectiveness, and accessibility, fueling market growth across various end-user industries. Furthermore, the rising need for data-driven decision-making across sectors like BFSI (Banking, Financial Services, and Insurance), IT and Telecommunications, and Retail is a major catalyst. Organizations are increasingly leveraging BI tools to gain valuable insights from their data, optimize operations, enhance customer experiences, and improve overall business outcomes. The demand for advanced analytics capabilities, including predictive modeling and machine learning integration within BI platforms, is also contributing to this growth trajectory. Competitive pressures and the need to gain a competitive edge are further compelling organizations to invest in sophisticated BI solutions.
However, certain restraints exist within the BI market. The complexity of implementing and integrating BI solutions, particularly in large and complex organizations, can be a significant challenge. Data security and privacy concerns, coupled with the need for robust data governance frameworks, also pose hurdles to wider adoption. Despite these challenges, the long-term outlook for the BI market remains positive, with continued growth expected through 2033. The market's segmentation across components (software and platform, services), deployment (on-premise, cloud), and end-user industries reflects the diverse needs and applications of BI across various sectors. Key players like SAS Institute, GoodData, Cisco, Microsoft, and others are actively competing to capture market share, fostering innovation and driving down costs, ultimately benefiting end-users. The continued evolution of technology and the increasing accessibility of BI tools are expected to further propel market growth in the coming years.
BI Market: A Comprehensive Report (2019-2033)
This in-depth report provides a comprehensive analysis of the Business Intelligence (BI) market, offering actionable insights for industry professionals and strategic decision-makers. The report covers the period from 2019 to 2033, with a focus on the estimated year 2025 and a forecast period from 2025 to 2033. The study encompasses various segments, leading players, and emerging trends, ultimately shaping a clear vision of the BI market's future. The market is projected to reach xx Million by 2033, showcasing significant growth potential.
BI Market Market Structure & Innovation Trends
This section analyzes the competitive landscape of the BI market, highlighting key trends and developments that shape its evolution. The market exhibits a moderately concentrated structure with several major players holding significant market share. Companies like SAS Institute Inc, GoodData Corporation, Cisco Systems Inc, Microsoft Corporation, Rackspace US Inc, International Business Machines Corporation, Tableau Software Inc (Salesforce), Oracle Corporation, Targit AS, VMware Inc, and SAP SE dominate the market, driving innovation and competition. However, the market also features numerous smaller players and niche providers.
- Market Concentration: The top 5 players hold an estimated xx% market share in 2025.
- Innovation Drivers: Advancements in cloud computing, big data analytics, and artificial intelligence (AI) are major drivers of innovation.
- Regulatory Frameworks: Data privacy regulations (e.g., GDPR, CCPA) significantly impact BI market operations and data handling practices.
- Product Substitutes: Open-source BI tools and cloud-based alternatives pose a competitive threat to established vendors.
- End-User Demographics: The demand for BI solutions is driven primarily by large enterprises and government organizations across various industries.
- M&A Activities: The BI market has witnessed significant M&A activity in recent years, with deal values exceeding xx Million in 2024.
BI Market Market Dynamics & Trends
The BI market is characterized by robust growth, driven by factors like the increasing volume and complexity of data, the need for data-driven decision-making, and the adoption of cloud-based solutions. The Compound Annual Growth Rate (CAGR) during the forecast period (2025-2033) is projected to be xx%. Market penetration is expected to increase by xx% by 2033. Technological disruptions, such as the rise of AI and machine learning in BI, are transforming the landscape. Consumer preferences are shifting towards self-service BI tools and user-friendly dashboards. Competitive dynamics are marked by intense innovation and the emergence of new players, particularly in the cloud-based BI segment. The market is highly competitive with companies constantly striving for differentiation through innovative features and strategic partnerships.
Dominant Regions & Segments in BI Market
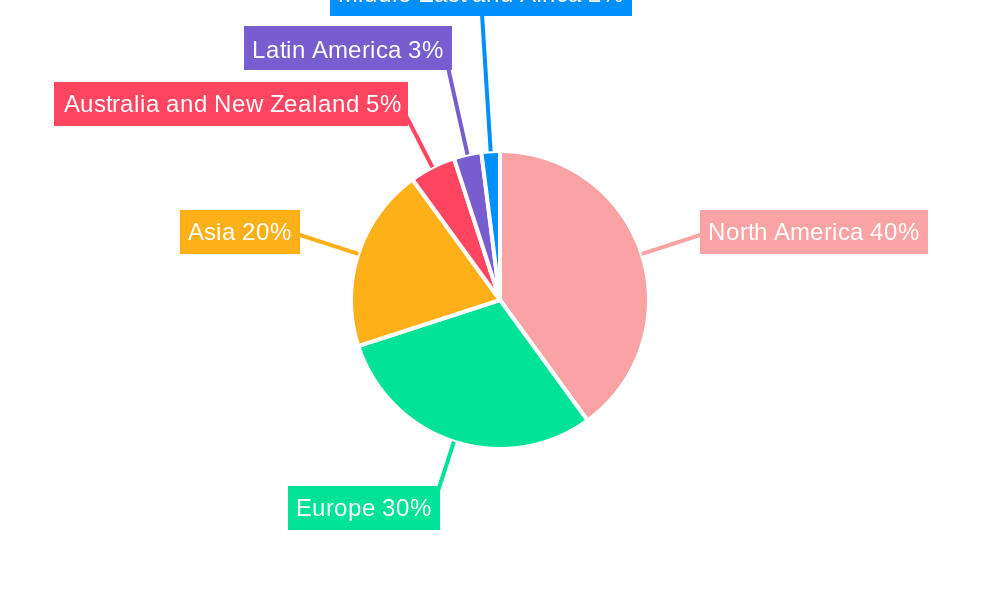
The North American region is currently the dominant market for BI solutions, followed by Europe and Asia-Pacific. This dominance is attributable to high technological adoption rates, the presence of major BI vendors, and robust economic growth.
By Component:
- Software and Platform: This segment holds the largest market share, driven by the increasing demand for advanced analytics and data visualization tools.
- Services: The services segment is experiencing strong growth, with increasing demand for consulting, implementation, and support services for BI solutions.
By Deployment:
- Cloud: The cloud-based BI segment is experiencing the fastest growth, owing to its scalability, cost-effectiveness, and accessibility.
- On-Premise: While on-premise deployments still account for a substantial share, their growth is relatively slower compared to cloud-based solutions.
By End-User Industry:
- BFSI (Banking, Financial Services, and Insurance): This industry is a major consumer of BI solutions due to its need for risk management, fraud detection, and customer relationship management.
- IT and Telecommunication: This industry utilizes BI to analyze network performance, customer usage patterns, and optimize operational efficiency.
- Retail: Retailers leverage BI for sales forecasting, inventory management, and customer segmentation.
- Healthcare: The healthcare industry is increasingly adopting BI for patient care, disease management, and operational improvements.
- Other End-User Industries: Other industries like manufacturing, energy, and government also show significant adoption of BI solutions.
BI Market Product Innovations
Recent product innovations in the BI market are focused on enhancing data visualization capabilities, improving user experience, and integrating advanced analytics techniques such as AI and machine learning. The integration of these technologies allows for more precise predictions, streamlined data processing, and automated insight generation. This trend is fueling the market's growth and creating new opportunities for vendors.
Report Scope & Segmentation Analysis
This report segments the BI market by component (Software and Platform, Services), deployment (On-Premise, Cloud), and end-user industry (BFSI, IT and Telecommunication, Retail, Healthcare, Other End-User Industries). Each segment is analyzed in terms of its growth projections, market size, and competitive dynamics. Detailed market size estimations are provided for each segment throughout the historical, base, and forecast periods. Competitive landscapes are analyzed with market share assessments and projections.
Key Drivers of BI Market Growth
The BI market is driven by several key factors, including the exponential growth of data volume, the increasing need for data-driven decision-making, the adoption of cloud computing and big data analytics, and government initiatives to promote data-driven governance. The demand for real-time data analytics and predictive modeling is also a major growth driver.
Challenges in the BI Market Sector
The BI market faces challenges such as the complexity of data integration, the need for skilled professionals to handle BI solutions, high initial investment costs, and concerns about data security and privacy. These challenges can hinder the adoption of BI solutions, especially in smaller organizations.
Emerging Opportunities in BI Market
Emerging opportunities in the BI market include the growing adoption of AI and machine learning in BI, the rise of self-service BI tools, and the expansion of BI solutions into new industries and markets. The integration of IoT data into BI systems presents significant growth potential.
Leading Players in the BI Market Market
- SAS Institute Inc
- GoodData Corporation
- Cisco Systems Inc
- Microsoft Corporation
- Rackspace US Inc
- International Business Machines Corporation
- Tableau Software Inc (Salesforce)
- Oracle Corporation
- Targit AS
- VMware Inc
- SAP SE
Key Developments in BI Market Industry
- May 2023: Rackspace US Inc announced Object Storage, significantly reducing storage costs for multi-cloud customers. This innovation improves performance and lowers costs for data-intensive applications.
- May 2023: GoodData Corporation launched its Last Mile ETL feature, streamlining data management processes and improving data velocity for clients. This enhances efficiency and resource allocation.
Future Outlook for BI Market Market
The BI market is poised for continued growth, driven by technological advancements, increasing data volumes, and the growing need for data-driven insights. Strategic opportunities exist for vendors to innovate in areas such as AI-powered analytics, self-service BI tools, and cloud-based solutions. The market's future looks bright, with substantial growth potential across various segments and geographies.
BI Market Segmentation
-
1. Component
- 1.1. Software and Platform
- 1.2. Services
-
2. Deployment
- 2.1. On-Premise
- 2.2. Cloud
-
3. End-User Industry
- 3.1. BFSI
- 3.2. IT and Telecommunication
- 3.3. Retail
- 3.4. Healthcare
- 3.5. Other End-User Industries
BI Market Segmentation By Geography
- 1. North America
- 2. Europe
- 3. Asia
- 4. Australia and New Zealand
- 5. Latin America
- 6. Middle East and Africa
BI Market REPORT HIGHLIGHTS
| Aspects | Details |
|---|---|
| Study Period | 2019-2033 |
| Base Year | 2024 |
| Estimated Year | 2025 |
| Forecast Period | 2025-2033 |
| Historical Period | 2019-2024 |
| Growth Rate | CAGR of 13.16% from 2019-2033 |
| Segmentation |
|
Table of Contents
- 1. Introduction
- 1.1. Research Scope
- 1.2. Market Segmentation
- 1.3. Research Methodology
- 1.4. Definitions and Assumptions
- 2. Executive Summary
- 2.1. Introduction
- 3. Market Dynamics
- 3.1. Introduction
- 3.2. Market Drivers
- 3.2.1. Increasing Adoption of Data Analytics by Enterprises; Emergence of IoT-Enabled Technologies
- 3.3. Market Restrains
- 3.3.1. High Investment Costs for On-Premise Solutions; Lack of Skilled Professionals
- 3.4. Market Trends
- 3.4.1. BFSI Industry is Expected to Drive the Market Growth
- 4. Market Factor Analysis
- 4.1. Porters Five Forces
- 4.2. Supply/Value Chain
- 4.3. PESTEL analysis
- 4.4. Market Entropy
- 4.5. Patent/Trademark Analysis
- 5. Global BI Market Analysis, Insights and Forecast, 2019-2031
- 5.1. Market Analysis, Insights and Forecast - by Component
- 5.1.1. Software and Platform
- 5.1.2. Services
- 5.2. Market Analysis, Insights and Forecast - by Deployment
- 5.2.1. On-Premise
- 5.2.2. Cloud
- 5.3. Market Analysis, Insights and Forecast - by End-User Industry
- 5.3.1. BFSI
- 5.3.2. IT and Telecommunication
- 5.3.3. Retail
- 5.3.4. Healthcare
- 5.3.5. Other End-User Industries
- 5.4. Market Analysis, Insights and Forecast - by Region
- 5.4.1. North America
- 5.4.2. Europe
- 5.4.3. Asia
- 5.4.4. Australia and New Zealand
- 5.4.5. Latin America
- 5.4.6. Middle East and Africa
- 5.1. Market Analysis, Insights and Forecast - by Component
- 6. North America BI Market Analysis, Insights and Forecast, 2019-2031
- 6.1. Market Analysis, Insights and Forecast - by Component
- 6.1.1. Software and Platform
- 6.1.2. Services
- 6.2. Market Analysis, Insights and Forecast - by Deployment
- 6.2.1. On-Premise
- 6.2.2. Cloud
- 6.3. Market Analysis, Insights and Forecast - by End-User Industry
- 6.3.1. BFSI
- 6.3.2. IT and Telecommunication
- 6.3.3. Retail
- 6.3.4. Healthcare
- 6.3.5. Other End-User Industries
- 6.1. Market Analysis, Insights and Forecast - by Component
- 7. Europe BI Market Analysis, Insights and Forecast, 2019-2031
- 7.1. Market Analysis, Insights and Forecast - by Component
- 7.1.1. Software and Platform
- 7.1.2. Services
- 7.2. Market Analysis, Insights and Forecast - by Deployment
- 7.2.1. On-Premise
- 7.2.2. Cloud
- 7.3. Market Analysis, Insights and Forecast - by End-User Industry
- 7.3.1. BFSI
- 7.3.2. IT and Telecommunication
- 7.3.3. Retail
- 7.3.4. Healthcare
- 7.3.5. Other End-User Industries
- 7.1. Market Analysis, Insights and Forecast - by Component
- 8. Asia BI Market Analysis, Insights and Forecast, 2019-2031
- 8.1. Market Analysis, Insights and Forecast - by Component
- 8.1.1. Software and Platform
- 8.1.2. Services
- 8.2. Market Analysis, Insights and Forecast - by Deployment
- 8.2.1. On-Premise
- 8.2.2. Cloud
- 8.3. Market Analysis, Insights and Forecast - by End-User Industry
- 8.3.1. BFSI
- 8.3.2. IT and Telecommunication
- 8.3.3. Retail
- 8.3.4. Healthcare
- 8.3.5. Other End-User Industries
- 8.1. Market Analysis, Insights and Forecast - by Component
- 9. Australia and New Zealand BI Market Analysis, Insights and Forecast, 2019-2031
- 9.1. Market Analysis, Insights and Forecast - by Component
- 9.1.1. Software and Platform
- 9.1.2. Services
- 9.2. Market Analysis, Insights and Forecast - by Deployment
- 9.2.1. On-Premise
- 9.2.2. Cloud
- 9.3. Market Analysis, Insights and Forecast - by End-User Industry
- 9.3.1. BFSI
- 9.3.2. IT and Telecommunication
- 9.3.3. Retail
- 9.3.4. Healthcare
- 9.3.5. Other End-User Industries
- 9.1. Market Analysis, Insights and Forecast - by Component
- 10. Latin America BI Market Analysis, Insights and Forecast, 2019-2031
- 10.1. Market Analysis, Insights and Forecast - by Component
- 10.1.1. Software and Platform
- 10.1.2. Services
- 10.2. Market Analysis, Insights and Forecast - by Deployment
- 10.2.1. On-Premise
- 10.2.2. Cloud
- 10.3. Market Analysis, Insights and Forecast - by End-User Industry
- 10.3.1. BFSI
- 10.3.2. IT and Telecommunication
- 10.3.3. Retail
- 10.3.4. Healthcare
- 10.3.5. Other End-User Industries
- 10.1. Market Analysis, Insights and Forecast - by Component
- 11. Middle East and Africa BI Market Analysis, Insights and Forecast, 2019-2031
- 11.1. Market Analysis, Insights and Forecast - by Component
- 11.1.1. Software and Platform
- 11.1.2. Services
- 11.2. Market Analysis, Insights and Forecast - by Deployment
- 11.2.1. On-Premise
- 11.2.2. Cloud
- 11.3. Market Analysis, Insights and Forecast - by End-User Industry
- 11.3.1. BFSI
- 11.3.2. IT and Telecommunication
- 11.3.3. Retail
- 11.3.4. Healthcare
- 11.3.5. Other End-User Industries
- 11.1. Market Analysis, Insights and Forecast - by Component
- 12. North America BI Market Analysis, Insights and Forecast, 2019-2031
- 12.1. Market Analysis, Insights and Forecast - By Country/Sub-region
- 12.1.1.
- 13. Europe BI Market Analysis, Insights and Forecast, 2019-2031
- 13.1. Market Analysis, Insights and Forecast - By Country/Sub-region
- 13.1.1.
- 14. Asia BI Market Analysis, Insights and Forecast, 2019-2031
- 14.1. Market Analysis, Insights and Forecast - By Country/Sub-region
- 14.1.1.
- 15. Australia and New Zealand BI Market Analysis, Insights and Forecast, 2019-2031
- 15.1. Market Analysis, Insights and Forecast - By Country/Sub-region
- 15.1.1.
- 16. Latin America BI Market Analysis, Insights and Forecast, 2019-2031
- 16.1. Market Analysis, Insights and Forecast - By Country/Sub-region
- 16.1.1.
- 17. Middle East and Africa BI Market Analysis, Insights and Forecast, 2019-2031
- 17.1. Market Analysis, Insights and Forecast - By Country/Sub-region
- 17.1.1.
- 18. Competitive Analysis
- 18.1. Global Market Share Analysis 2024
- 18.2. Company Profiles
- 18.2.1 SAS Institute Inc
- 18.2.1.1. Overview
- 18.2.1.2. Products
- 18.2.1.3. SWOT Analysis
- 18.2.1.4. Recent Developments
- 18.2.1.5. Financials (Based on Availability)
- 18.2.2 GoodData Corporation
- 18.2.2.1. Overview
- 18.2.2.2. Products
- 18.2.2.3. SWOT Analysis
- 18.2.2.4. Recent Developments
- 18.2.2.5. Financials (Based on Availability)
- 18.2.3 Cisco Systems Inc
- 18.2.3.1. Overview
- 18.2.3.2. Products
- 18.2.3.3. SWOT Analysis
- 18.2.3.4. Recent Developments
- 18.2.3.5. Financials (Based on Availability)
- 18.2.4 Microsoft Corporation
- 18.2.4.1. Overview
- 18.2.4.2. Products
- 18.2.4.3. SWOT Analysis
- 18.2.4.4. Recent Developments
- 18.2.4.5. Financials (Based on Availability)
- 18.2.5 Rackspace US Inc
- 18.2.5.1. Overview
- 18.2.5.2. Products
- 18.2.5.3. SWOT Analysis
- 18.2.5.4. Recent Developments
- 18.2.5.5. Financials (Based on Availability)
- 18.2.6 International Business Machines Corporation
- 18.2.6.1. Overview
- 18.2.6.2. Products
- 18.2.6.3. SWOT Analysis
- 18.2.6.4. Recent Developments
- 18.2.6.5. Financials (Based on Availability)
- 18.2.7 Tableau Software Inc (Salesforce)*List Not Exhaustive
- 18.2.7.1. Overview
- 18.2.7.2. Products
- 18.2.7.3. SWOT Analysis
- 18.2.7.4. Recent Developments
- 18.2.7.5. Financials (Based on Availability)
- 18.2.8 Oracle Corporation
- 18.2.8.1. Overview
- 18.2.8.2. Products
- 18.2.8.3. SWOT Analysis
- 18.2.8.4. Recent Developments
- 18.2.8.5. Financials (Based on Availability)
- 18.2.9 Targit AS
- 18.2.9.1. Overview
- 18.2.9.2. Products
- 18.2.9.3. SWOT Analysis
- 18.2.9.4. Recent Developments
- 18.2.9.5. Financials (Based on Availability)
- 18.2.10 VMware Inc
- 18.2.10.1. Overview
- 18.2.10.2. Products
- 18.2.10.3. SWOT Analysis
- 18.2.10.4. Recent Developments
- 18.2.10.5. Financials (Based on Availability)
- 18.2.11 SAP SE
- 18.2.11.1. Overview
- 18.2.11.2. Products
- 18.2.11.3. SWOT Analysis
- 18.2.11.4. Recent Developments
- 18.2.11.5. Financials (Based on Availability)
- 18.2.1 SAS Institute Inc
List of Figures
- Figure 1: Global BI Market Revenue Breakdown (Million, %) by Region 2024 & 2032
- Figure 2: North America BI Market Revenue (Million), by Country 2024 & 2032
- Figure 3: North America BI Market Revenue Share (%), by Country 2024 & 2032
- Figure 4: Europe BI Market Revenue (Million), by Country 2024 & 2032
- Figure 5: Europe BI Market Revenue Share (%), by Country 2024 & 2032
- Figure 6: Asia BI Market Revenue (Million), by Country 2024 & 2032
- Figure 7: Asia BI Market Revenue Share (%), by Country 2024 & 2032
- Figure 8: Australia and New Zealand BI Market Revenue (Million), by Country 2024 & 2032
- Figure 9: Australia and New Zealand BI Market Revenue Share (%), by Country 2024 & 2032
- Figure 10: Latin America BI Market Revenue (Million), by Country 2024 & 2032
- Figure 11: Latin America BI Market Revenue Share (%), by Country 2024 & 2032
- Figure 12: Middle East and Africa BI Market Revenue (Million), by Country 2024 & 2032
- Figure 13: Middle East and Africa BI Market Revenue Share (%), by Country 2024 & 2032
- Figure 14: North America BI Market Revenue (Million), by Component 2024 & 2032
- Figure 15: North America BI Market Revenue Share (%), by Component 2024 & 2032
- Figure 16: North America BI Market Revenue (Million), by Deployment 2024 & 2032
- Figure 17: North America BI Market Revenue Share (%), by Deployment 2024 & 2032
- Figure 18: North America BI Market Revenue (Million), by End-User Industry 2024 & 2032
- Figure 19: North America BI Market Revenue Share (%), by End-User Industry 2024 & 2032
- Figure 20: North America BI Market Revenue (Million), by Country 2024 & 2032
- Figure 21: North America BI Market Revenue Share (%), by Country 2024 & 2032
- Figure 22: Europe BI Market Revenue (Million), by Component 2024 & 2032
- Figure 23: Europe BI Market Revenue Share (%), by Component 2024 & 2032
- Figure 24: Europe BI Market Revenue (Million), by Deployment 2024 & 2032
- Figure 25: Europe BI Market Revenue Share (%), by Deployment 2024 & 2032
- Figure 26: Europe BI Market Revenue (Million), by End-User Industry 2024 & 2032
- Figure 27: Europe BI Market Revenue Share (%), by End-User Industry 2024 & 2032
- Figure 28: Europe BI Market Revenue (Million), by Country 2024 & 2032
- Figure 29: Europe BI Market Revenue Share (%), by Country 2024 & 2032
- Figure 30: Asia BI Market Revenue (Million), by Component 2024 & 2032
- Figure 31: Asia BI Market Revenue Share (%), by Component 2024 & 2032
- Figure 32: Asia BI Market Revenue (Million), by Deployment 2024 & 2032
- Figure 33: Asia BI Market Revenue Share (%), by Deployment 2024 & 2032
- Figure 34: Asia BI Market Revenue (Million), by End-User Industry 2024 & 2032
- Figure 35: Asia BI Market Revenue Share (%), by End-User Industry 2024 & 2032
- Figure 36: Asia BI Market Revenue (Million), by Country 2024 & 2032
- Figure 37: Asia BI Market Revenue Share (%), by Country 2024 & 2032
- Figure 38: Australia and New Zealand BI Market Revenue (Million), by Component 2024 & 2032
- Figure 39: Australia and New Zealand BI Market Revenue Share (%), by Component 2024 & 2032
- Figure 40: Australia and New Zealand BI Market Revenue (Million), by Deployment 2024 & 2032
- Figure 41: Australia and New Zealand BI Market Revenue Share (%), by Deployment 2024 & 2032
- Figure 42: Australia and New Zealand BI Market Revenue (Million), by End-User Industry 2024 & 2032
- Figure 43: Australia and New Zealand BI Market Revenue Share (%), by End-User Industry 2024 & 2032
- Figure 44: Australia and New Zealand BI Market Revenue (Million), by Country 2024 & 2032
- Figure 45: Australia and New Zealand BI Market Revenue Share (%), by Country 2024 & 2032
- Figure 46: Latin America BI Market Revenue (Million), by Component 2024 & 2032
- Figure 47: Latin America BI Market Revenue Share (%), by Component 2024 & 2032
- Figure 48: Latin America BI Market Revenue (Million), by Deployment 2024 & 2032
- Figure 49: Latin America BI Market Revenue Share (%), by Deployment 2024 & 2032
- Figure 50: Latin America BI Market Revenue (Million), by End-User Industry 2024 & 2032
- Figure 51: Latin America BI Market Revenue Share (%), by End-User Industry 2024 & 2032
- Figure 52: Latin America BI Market Revenue (Million), by Country 2024 & 2032
- Figure 53: Latin America BI Market Revenue Share (%), by Country 2024 & 2032
- Figure 54: Middle East and Africa BI Market Revenue (Million), by Component 2024 & 2032
- Figure 55: Middle East and Africa BI Market Revenue Share (%), by Component 2024 & 2032
- Figure 56: Middle East and Africa BI Market Revenue (Million), by Deployment 2024 & 2032
- Figure 57: Middle East and Africa BI Market Revenue Share (%), by Deployment 2024 & 2032
- Figure 58: Middle East and Africa BI Market Revenue (Million), by End-User Industry 2024 & 2032
- Figure 59: Middle East and Africa BI Market Revenue Share (%), by End-User Industry 2024 & 2032
- Figure 60: Middle East and Africa BI Market Revenue (Million), by Country 2024 & 2032
- Figure 61: Middle East and Africa BI Market Revenue Share (%), by Country 2024 & 2032
List of Tables
- Table 1: Global BI Market Revenue Million Forecast, by Region 2019 & 2032
- Table 2: Global BI Market Revenue Million Forecast, by Component 2019 & 2032
- Table 3: Global BI Market Revenue Million Forecast, by Deployment 2019 & 2032
- Table 4: Global BI Market Revenue Million Forecast, by End-User Industry 2019 & 2032
- Table 5: Global BI Market Revenue Million Forecast, by Region 2019 & 2032
- Table 6: Global BI Market Revenue Million Forecast, by Country 2019 & 2032
- Table 7: BI Market Revenue (Million) Forecast, by Application 2019 & 2032
- Table 8: Global BI Market Revenue Million Forecast, by Country 2019 & 2032
- Table 9: BI Market Revenue (Million) Forecast, by Application 2019 & 2032
- Table 10: Global BI Market Revenue Million Forecast, by Country 2019 & 2032
- Table 11: BI Market Revenue (Million) Forecast, by Application 2019 & 2032
- Table 12: Global BI Market Revenue Million Forecast, by Country 2019 & 2032
- Table 13: BI Market Revenue (Million) Forecast, by Application 2019 & 2032
- Table 14: Global BI Market Revenue Million Forecast, by Country 2019 & 2032
- Table 15: BI Market Revenue (Million) Forecast, by Application 2019 & 2032
- Table 16: Global BI Market Revenue Million Forecast, by Country 2019 & 2032
- Table 17: BI Market Revenue (Million) Forecast, by Application 2019 & 2032
- Table 18: Global BI Market Revenue Million Forecast, by Component 2019 & 2032
- Table 19: Global BI Market Revenue Million Forecast, by Deployment 2019 & 2032
- Table 20: Global BI Market Revenue Million Forecast, by End-User Industry 2019 & 2032
- Table 21: Global BI Market Revenue Million Forecast, by Country 2019 & 2032
- Table 22: Global BI Market Revenue Million Forecast, by Component 2019 & 2032
- Table 23: Global BI Market Revenue Million Forecast, by Deployment 2019 & 2032
- Table 24: Global BI Market Revenue Million Forecast, by End-User Industry 2019 & 2032
- Table 25: Global BI Market Revenue Million Forecast, by Country 2019 & 2032
- Table 26: Global BI Market Revenue Million Forecast, by Component 2019 & 2032
- Table 27: Global BI Market Revenue Million Forecast, by Deployment 2019 & 2032
- Table 28: Global BI Market Revenue Million Forecast, by End-User Industry 2019 & 2032
- Table 29: Global BI Market Revenue Million Forecast, by Country 2019 & 2032
- Table 30: Global BI Market Revenue Million Forecast, by Component 2019 & 2032
- Table 31: Global BI Market Revenue Million Forecast, by Deployment 2019 & 2032
- Table 32: Global BI Market Revenue Million Forecast, by End-User Industry 2019 & 2032
- Table 33: Global BI Market Revenue Million Forecast, by Country 2019 & 2032
- Table 34: Global BI Market Revenue Million Forecast, by Component 2019 & 2032
- Table 35: Global BI Market Revenue Million Forecast, by Deployment 2019 & 2032
- Table 36: Global BI Market Revenue Million Forecast, by End-User Industry 2019 & 2032
- Table 37: Global BI Market Revenue Million Forecast, by Country 2019 & 2032
- Table 38: Global BI Market Revenue Million Forecast, by Component 2019 & 2032
- Table 39: Global BI Market Revenue Million Forecast, by Deployment 2019 & 2032
- Table 40: Global BI Market Revenue Million Forecast, by End-User Industry 2019 & 2032
- Table 41: Global BI Market Revenue Million Forecast, by Country 2019 & 2032
Frequently Asked Questions
1. What is the projected Compound Annual Growth Rate (CAGR) of the BI Market?
The projected CAGR is approximately 13.16%.
2. Which companies are prominent players in the BI Market?
Key companies in the market include SAS Institute Inc, GoodData Corporation, Cisco Systems Inc, Microsoft Corporation, Rackspace US Inc, International Business Machines Corporation, Tableau Software Inc (Salesforce)*List Not Exhaustive, Oracle Corporation, Targit AS, VMware Inc, SAP SE.
3. What are the main segments of the BI Market?
The market segments include Component, Deployment, End-User Industry.
4. Can you provide details about the market size?
The market size is estimated to be USD 33.34 Million as of 2022.
5. What are some drivers contributing to market growth?
Increasing Adoption of Data Analytics by Enterprises; Emergence of IoT-Enabled Technologies.
6. What are the notable trends driving market growth?
BFSI Industry is Expected to Drive the Market Growth.
7. Are there any restraints impacting market growth?
High Investment Costs for On-Premise Solutions; Lack of Skilled Professionals.
8. Can you provide examples of recent developments in the market?
May 2023: Rackspace US Inc announced Object Storage which enables organizations securely store and utilize large pools of unstructured data, where Rackspace Object Storage saves substantial costs by eliminating data egress, retrieval, and transaction charges. In many cases, the Rackspace Object Storage solution can save more than 80% over hyper-scale cloud storage options. For multi-cloud customers operating modern S3-enabled applications, this is a new paradigm that facilitates better performance and lower costs, even as data-intensive applications continue to drive up the need for storage,
9. What pricing options are available for accessing the report?
Pricing options include single-user, multi-user, and enterprise licenses priced at USD 4750, USD 5250, and USD 8750 respectively.
10. Is the market size provided in terms of value or volume?
The market size is provided in terms of value, measured in Million.
11. Are there any specific market keywords associated with the report?
Yes, the market keyword associated with the report is "BI Market," which aids in identifying and referencing the specific market segment covered.
12. How do I determine which pricing option suits my needs best?
The pricing options vary based on user requirements and access needs. Individual users may opt for single-user licenses, while businesses requiring broader access may choose multi-user or enterprise licenses for cost-effective access to the report.
13. Are there any additional resources or data provided in the BI Market report?
While the report offers comprehensive insights, it's advisable to review the specific contents or supplementary materials provided to ascertain if additional resources or data are available.
14. How can I stay updated on further developments or reports in the BI Market?
To stay informed about further developments, trends, and reports in the BI Market, consider subscribing to industry newsletters, following relevant companies and organizations, or regularly checking reputable industry news sources and publications.
Methodology
Step 1 - Identification of Relevant Samples Size from Population Database


Step 2 - Approaches for Defining Global Market Size (Value, Volume* & Price*)

Note*: In applicable scenarios
Step 3 - Data Sources
Primary Research
- Web Analytics
- Survey Reports
- Research Institute
- Latest Research Reports
- Opinion Leaders
Secondary Research
- Annual Reports
- White Paper
- Latest Press Release
- Industry Association
- Paid Database
- Investor Presentations

Step 4 - Data Triangulation
Involves using different sources of information in order to increase the validity of a study
These sources are likely to be stakeholders in a program - participants, other researchers, program staff, other community members, and so on.
Then we put all data in single framework & apply various statistical tools to find out the dynamic on the market.
During the analysis stage, feedback from the stakeholder groups would be compared to determine areas of agreement as well as areas of divergence


