

Key Insights
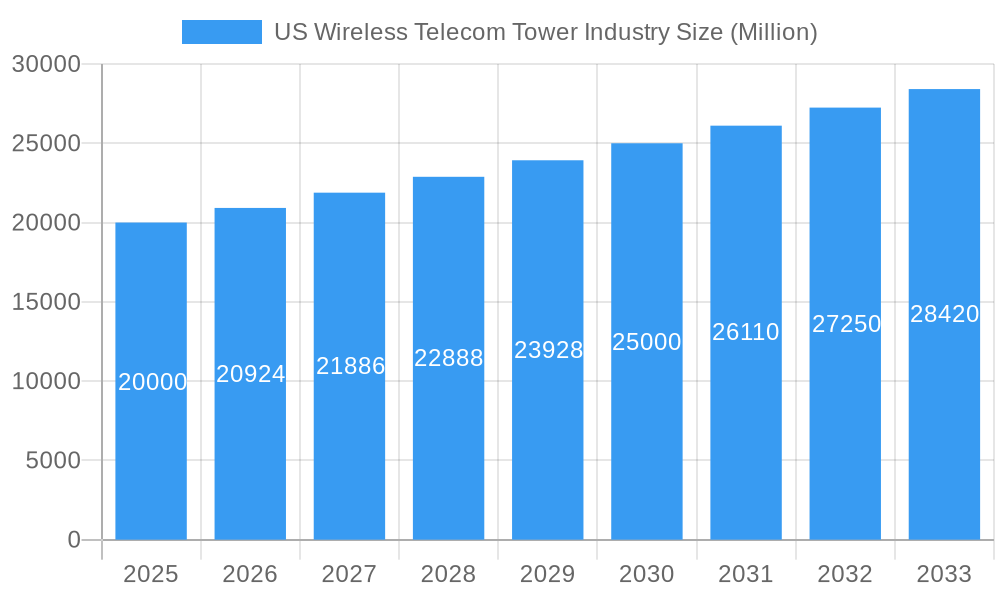
The US wireless telecom tower industry is experiencing significant expansion, driven by escalating demand for enhanced bandwidth and improved network coverage, largely attributable to the widespread adoption of 5G technology and the Internet of Things (IoT). The market, currently valued at 14.1 billion, is projected to achieve a Compound Annual Growth Rate (CAGR) of 4.7% from the base year of 2025 through 2033. Key growth drivers include the ongoing deployment of 5G networks necessitating denser tower infrastructure, the increasing integration of small cells for superior capacity, and substantial investments from both mobile network operators (MNOs) and independent tower companies. Segment analysis highlights the significant role of energy sources powering towers, with rooftop installations demonstrating robust growth due to their cost-effectiveness and straightforward deployment. Ownership models are varied, encompassing operator-owned, joint ventures, and privately-owned towers, underscoring the industry's complexity. Competitive dynamics are intense, with leading entities such as SBA Communications, Crown Castle, and American Tower Corporation actively pursuing market share. Regional demand is expected to be higher in densely populated areas like the Northeast and West compared to less populated regions such as the Midwest and Southwest.
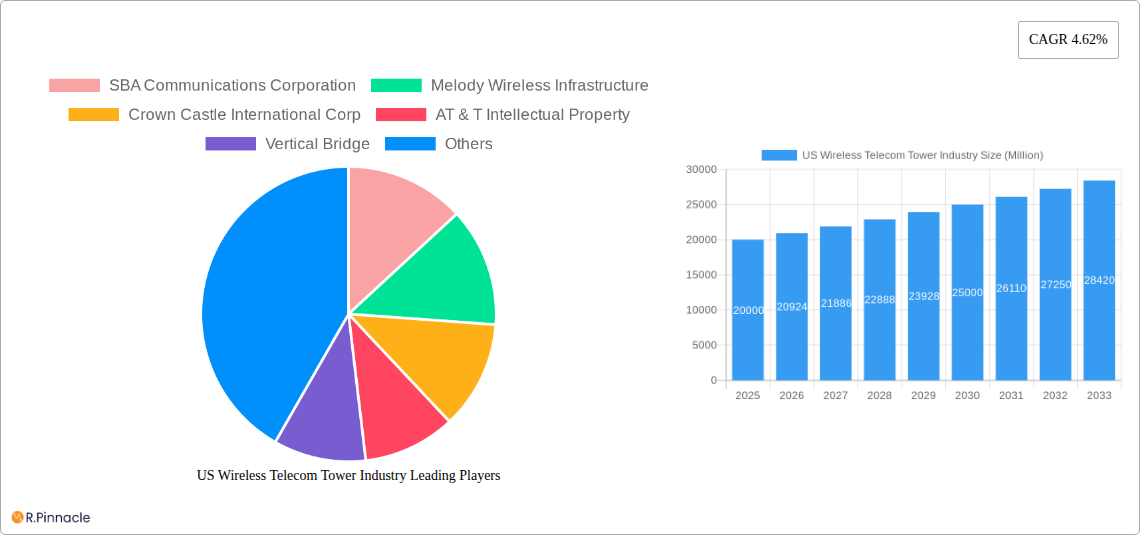
US Wireless Telecom Tower Industry Market Size (In Billion)
The sector confronts certain challenges, including evolving regulatory landscapes concerning tower construction and placement, the capital expenditure required for upgrading existing infrastructure to support new technologies, and environmental considerations associated with tower development and operation. Nevertheless, the long-term market trajectory remains optimistic, supported by persistent demand for wireless connectivity. The increasing dependence on wireless communication for diverse applications, including smart city initiatives, autonomous vehicles, and industrial automation, forecasts continued growth for the US wireless telecom tower sector, presenting considerable investment prospects and reshaping telecommunications infrastructure. Strategic alliances and technological advancements, such as the incorporation of renewable energy solutions in tower operations, are anticipated to define the market's future.
US Wireless Telecom Tower Industry Company Market Share
US Wireless Telecom Tower Industry Market Report: 2019-2033
This comprehensive report provides an in-depth analysis of the US Wireless Telecom Tower Industry, covering market size, segmentation, key players, growth drivers, challenges, and future outlook. The study period spans from 2019 to 2033, with 2025 as the base and estimated year. This report is essential for industry professionals, investors, and anyone seeking to understand the dynamics of this rapidly evolving sector.
US Wireless Telecom Tower Industry Market Structure & Innovation Trends
This section analyzes the competitive landscape, focusing on market concentration, innovation drivers, regulatory influences, and M&A activity within the US wireless telecom tower industry from 2019-2024. The report examines the market share of key players such as SBA Communications Corporation, Crown Castle International Corp, American Tower Corporation, and Vertical Bridge, quantifying their influence on market dynamics. Furthermore, it delves into recent mergers and acquisitions (M&A) deals, analyzing their impact on market consolidation and innovation. The analysis includes a detailed examination of the regulatory framework governing tower deployment and operations, highlighting its influence on market growth and investment decisions. The report also discusses the role of technological advancements, such as the adoption of 5G and the increasing demand for small cells, driving innovation within the industry. Finally, it considers the impact of substitute technologies and evolving end-user demographics on the future trajectory of the market. The total value of M&A deals in the period 2019-2024 is estimated at $xx Million.
US Wireless Telecom Tower Industry Market Dynamics & Trends
This section explores the market's growth trajectory from 2019 to 2033, analyzing key drivers, technological disruptions, consumer preferences, and competitive dynamics. The report projects a Compound Annual Growth Rate (CAGR) of xx% for the forecast period (2025-2033), driven by factors such as the widespread adoption of 5G technology, the increasing demand for enhanced mobile broadband services, and the growth of the Internet of Things (IoT). The analysis includes a detailed examination of market penetration rates for different tower technologies, as well as an assessment of the competitive landscape, including pricing strategies, market share, and technological innovations implemented by major players. The report also examines the impact of consumer preferences, such as demand for faster and more reliable mobile connectivity, on market growth. Furthermore, it investigates technological disruptions such as the emergence of new tower technologies and the integration of other infrastructure like data centers.
Dominant Regions & Segments in US Wireless Telecom Tower Industry
This section identifies the leading regions and segments within the US wireless telecom tower industry. The analysis considers segmentation by fuel type (renewable and non-renewable), installation type (rooftop and ground-based), and ownership structure (operator-owned, joint venture, private-owned, and MNO captive).
Key Drivers of Segment Dominance:
- By Fuel Type: The report details the market share of renewable energy sources in powering telecom towers, analyzing the drivers behind its growth such as environmental regulations and cost savings.
- By Installation: The analysis will highlight whether rooftop or ground-based installations dominate and why. Factors like land availability, zoning regulations, and cost-effectiveness are explored.
- By Ownership: The report examines which ownership structure (operator-owned, joint venture, private-owned, MNO captive) holds the largest market share and analyzes the factors influencing this dominance, such as regulatory incentives and investment strategies.
The dominant region is expected to be [Region Name], driven by factors such as [Specific factors, e.g., high population density, robust economic growth, favorable government policies]. This section provides a comprehensive analysis of each segment’s market size, growth rate, and competitive dynamics.
US Wireless Telecom Tower Industry Product Innovations
This section summarizes the latest product developments, applications, and competitive advantages in the US wireless telecom tower industry. Recent innovations focus on enhancing tower capacity to meet the demands of 5G and IoT deployments. This includes advanced antenna technologies, improved power efficiency, and innovative tower designs that optimize space and infrastructure integration. These innovations provide key competitive advantages by offering improved network performance, cost efficiencies, and faster deployment times. The integration of smart tower technologies and the increasing use of renewable energy sources are also noted.
Report Scope & Segmentation Analysis
This report segments the US wireless telecom tower market based on fuel type (renewable, non-renewable), installation (rooftop, ground-based), and ownership (operator-owned, joint venture, private-owned, MNO captive). Each segment’s market size, growth projections, and competitive landscape are analyzed. For instance, the renewable fuel type segment is projected to witness significant growth due to rising environmental concerns. The ground-based installation segment enjoys a larger share due to its capacity and stability. Operator-owned towers hold a considerable market share due to direct control over infrastructure.
Key Drivers of US Wireless Telecom Tower Industry Growth
Growth in the US wireless telecom tower industry is driven by several key factors. The expansion of 5G networks necessitates a significant increase in tower infrastructure, creating substantial demand. The rise of IoT devices also contributes to the need for more towers to support increased data traffic. Favorable government policies and regulations supporting infrastructure development further fuel industry growth. Additionally, increasing mobile data consumption and the need for better network coverage are major drivers.
Challenges in the US Wireless Telecom Tower Industry Sector
The US wireless telecom tower industry faces challenges including regulatory hurdles in obtaining permits and approvals for tower construction, leading to project delays and increased costs. Supply chain disruptions affecting materials and equipment availability impact construction timelines and profitability. Intense competition among tower companies results in pricing pressures and necessitates innovation to maintain market share. These factors collectively impede industry growth and profitability.
Emerging Opportunities in US Wireless Telecom Tower Industry
Emerging opportunities include the deployment of private 5G networks, particularly in industries such as manufacturing and healthcare, creating new demand for tower infrastructure. The integration of edge computing into tower infrastructure offers enhanced network performance and improved service latency. Additionally, the growth of small cells and distributed antenna systems (DAS) presents significant expansion opportunities. These developments will further accelerate industry growth in the coming years.
Leading Players in the US Wireless Telecom Tower Industry Market
- SBA Communications Corporation
- Melody Wireless Infrastructure
- Crown Castle International Corp
- AT&T Intellectual Property
- Vertical Bridge
- Helios Towers plc
- Tillman Infrastructure LLC
- United States Cellular Co
- ATC IP LLC
- Insite Wireless Group
- BNSF Railroad
Key Developments in US Wireless Telecom Tower Industry
- January 2022: T-Mobile US, Inc. and Crown Castle International Corp. announced a 12-year collaboration to expand T-Mobile's 5G network access.
- January 2022: American Tower Corporation acquired CoreSite Realty Corporation, integrating data center capabilities into its tower infrastructure.
Future Outlook for US Wireless Telecom Tower Industry Market
The future outlook for the US wireless telecom tower industry remains positive, driven by continued 5G deployment, expanding IoT applications, and the growing demand for robust mobile connectivity. Strategic investments in infrastructure modernization, including the adoption of renewable energy sources and innovative tower technologies, will further fuel market growth. The industry is poised for sustained expansion, presenting significant opportunities for both established players and new entrants.
US Wireless Telecom Tower Industry Segmentation
-
1. Fuel Type
- 1.1. Renewable
- 1.2. Non-renewable
-
2. Installation
- 2.1. Rooftop
- 2.2. Ground-based
-
3. Ownership
- 3.1. Operator-owned
- 3.2. Joint Venture
- 3.3. Private-owned
- 3.4. MNO Captive
US Wireless Telecom Tower Industry Segmentation By Geography
-
1. North America
- 1.1. United States
- 1.2. Canada
- 1.3. Mexico
-
2. South America
- 2.1. Brazil
- 2.2. Argentina
- 2.3. Rest of South America
-
3. Europe
- 3.1. United Kingdom
- 3.2. Germany
- 3.3. France
- 3.4. Italy
- 3.5. Spain
- 3.6. Russia
- 3.7. Benelux
- 3.8. Nordics
- 3.9. Rest of Europe
-
4. Middle East & Africa
- 4.1. Turkey
- 4.2. Israel
- 4.3. GCC
- 4.4. North Africa
- 4.5. South Africa
- 4.6. Rest of Middle East & Africa
-
5. Asia Pacific
- 5.1. China
- 5.2. India
- 5.3. Japan
- 5.4. South Korea
- 5.5. ASEAN
- 5.6. Oceania
- 5.7. Rest of Asia Pacific
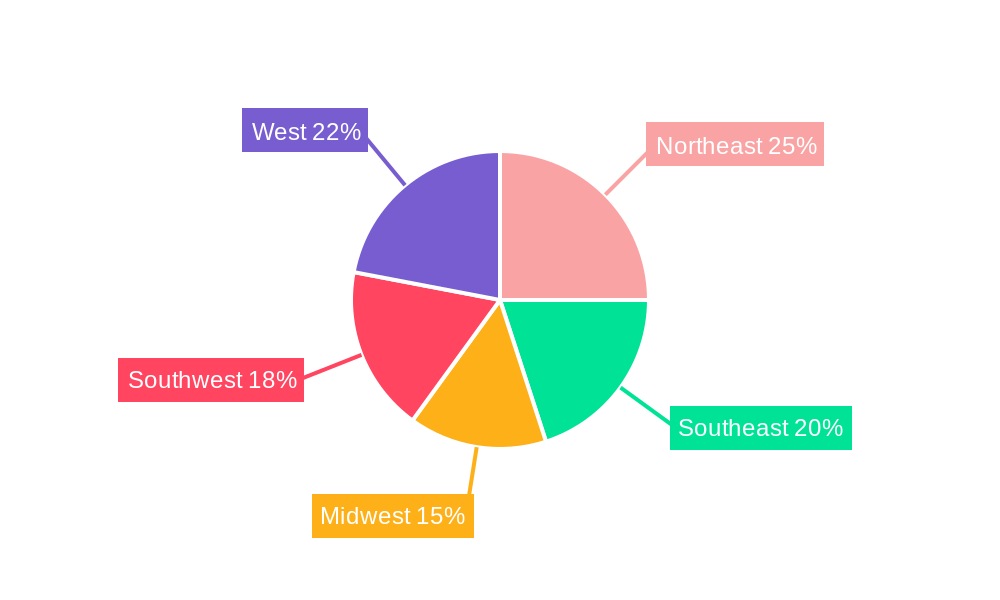
US Wireless Telecom Tower Industry Regional Market Share
Geographic Coverage of US Wireless Telecom Tower Industry
US Wireless Telecom Tower Industry REPORT HIGHLIGHTS
| Aspects | Details |
|---|---|
| Study Period | 2020-2034 |
| Base Year | 2025 |
| Estimated Year | 2026 |
| Forecast Period | 2026-2034 |
| Historical Period | 2020-2025 |
| Growth Rate | CAGR of 4.7% from 2020-2034 |
| Segmentation |
|
Table of Contents
- 1. Introduction
- 1.1. Research Scope
- 1.2. Market Segmentation
- 1.3. Research Objective
- 1.4. Definitions and Assumptions
- 2. Executive Summary
- 2.1. Market Snapshot
- 3. Market Dynamics
- 3.1. Market Drivers
- 3.2. Market Restrains
- 3.3. Market Trends
- 3.4. Market Opportunities
- 4. Market Factor Analysis
- 4.1. Porters Five Forces
- 4.1.1. Bargaining Power of Suppliers
- 4.1.2. Bargaining Power of Buyers
- 4.1.3. Threat of New Entrants
- 4.1.4. Threat of Substitutes
- 4.1.5. Competitive Rivalry
- 4.2. PESTEL analysis
- 4.3. BCG Analysis
- 4.3.1. Stars (High Growth, High Market Share)
- 4.3.2. Cash Cows (Low Growth, High Market Share)
- 4.3.3. Question Mark (High Growth, Low Market Share)
- 4.3.4. Dogs (Low Growth, Low Market Share)
- 4.4. Ansoff Matrix Analysis
- 4.5. Supply Chain Analysis
- 4.6. Regulatory Landscape
- 4.7. Current Market Potential and Opportunity Assessment (TAM–SAM–SOM Framework)
- 4.8. PRI Analyst Note
- 4.1. Porters Five Forces
- 5. Market Analysis, Insights and Forecast 2021-2033
- 5.1. Market Analysis, Insights and Forecast - by Fuel Type
- 5.1.1. Renewable
- 5.1.2. Non-renewable
- 5.2. Market Analysis, Insights and Forecast - by Installation
- 5.2.1. Rooftop
- 5.2.2. Ground-based
- 5.3. Market Analysis, Insights and Forecast - by Ownership
- 5.3.1. Operator-owned
- 5.3.2. Joint Venture
- 5.3.3. Private-owned
- 5.3.4. MNO Captive
- 5.4. Market Analysis, Insights and Forecast - by Region
- 5.4.1. North America
- 5.4.2. South America
- 5.4.3. Europe
- 5.4.4. Middle East & Africa
- 5.4.5. Asia Pacific
- 5.1. Market Analysis, Insights and Forecast - by Fuel Type
- 6. Global US Wireless Telecom Tower Industry Analysis, Insights and Forecast, 2021-2033
- 6.1. Market Analysis, Insights and Forecast - by Fuel Type
- 6.1.1. Renewable
- 6.1.2. Non-renewable
- 6.2. Market Analysis, Insights and Forecast - by Installation
- 6.2.1. Rooftop
- 6.2.2. Ground-based
- 6.3. Market Analysis, Insights and Forecast - by Ownership
- 6.3.1. Operator-owned
- 6.3.2. Joint Venture
- 6.3.3. Private-owned
- 6.3.4. MNO Captive
- 6.1. Market Analysis, Insights and Forecast - by Fuel Type
- 7. North America US Wireless Telecom Tower Industry Analysis, Insights and Forecast, 2020-2032
- 7.1. Market Analysis, Insights and Forecast - by Fuel Type
- 7.1.1. Renewable
- 7.1.2. Non-renewable
- 7.2. Market Analysis, Insights and Forecast - by Installation
- 7.2.1. Rooftop
- 7.2.2. Ground-based
- 7.3. Market Analysis, Insights and Forecast - by Ownership
- 7.3.1. Operator-owned
- 7.3.2. Joint Venture
- 7.3.3. Private-owned
- 7.3.4. MNO Captive
- 7.1. Market Analysis, Insights and Forecast - by Fuel Type
- 8. South America US Wireless Telecom Tower Industry Analysis, Insights and Forecast, 2020-2032
- 8.1. Market Analysis, Insights and Forecast - by Fuel Type
- 8.1.1. Renewable
- 8.1.2. Non-renewable
- 8.2. Market Analysis, Insights and Forecast - by Installation
- 8.2.1. Rooftop
- 8.2.2. Ground-based
- 8.3. Market Analysis, Insights and Forecast - by Ownership
- 8.3.1. Operator-owned
- 8.3.2. Joint Venture
- 8.3.3. Private-owned
- 8.3.4. MNO Captive
- 8.1. Market Analysis, Insights and Forecast - by Fuel Type
- 9. Europe US Wireless Telecom Tower Industry Analysis, Insights and Forecast, 2020-2032
- 9.1. Market Analysis, Insights and Forecast - by Fuel Type
- 9.1.1. Renewable
- 9.1.2. Non-renewable
- 9.2. Market Analysis, Insights and Forecast - by Installation
- 9.2.1. Rooftop
- 9.2.2. Ground-based
- 9.3. Market Analysis, Insights and Forecast - by Ownership
- 9.3.1. Operator-owned
- 9.3.2. Joint Venture
- 9.3.3. Private-owned
- 9.3.4. MNO Captive
- 9.1. Market Analysis, Insights and Forecast - by Fuel Type
- 10. Middle East & Africa US Wireless Telecom Tower Industry Analysis, Insights and Forecast, 2020-2032
- 10.1. Market Analysis, Insights and Forecast - by Fuel Type
- 10.1.1. Renewable
- 10.1.2. Non-renewable
- 10.2. Market Analysis, Insights and Forecast - by Installation
- 10.2.1. Rooftop
- 10.2.2. Ground-based
- 10.3. Market Analysis, Insights and Forecast - by Ownership
- 10.3.1. Operator-owned
- 10.3.2. Joint Venture
- 10.3.3. Private-owned
- 10.3.4. MNO Captive
- 10.1. Market Analysis, Insights and Forecast - by Fuel Type
- 11. Asia Pacific US Wireless Telecom Tower Industry Analysis, Insights and Forecast, 2020-2032
- 11.1. Market Analysis, Insights and Forecast - by Fuel Type
- 11.1.1. Renewable
- 11.1.2. Non-renewable
- 11.2. Market Analysis, Insights and Forecast - by Installation
- 11.2.1. Rooftop
- 11.2.2. Ground-based
- 11.3. Market Analysis, Insights and Forecast - by Ownership
- 11.3.1. Operator-owned
- 11.3.2. Joint Venture
- 11.3.3. Private-owned
- 11.3.4. MNO Captive
- 11.1. Market Analysis, Insights and Forecast - by Fuel Type
- 12. Competitive Analysis
- 12.1. Company Profiles
- 12.1.1 SBA Communications Corporation
- 12.1.1.1. Company Overview
- 12.1.1.2. Products
- 12.1.1.3. Company Financials
- 12.1.1.4. SWOT Analysis
- 12.1.2 Melody Wireless Infrastructure
- 12.1.2.1. Company Overview
- 12.1.2.2. Products
- 12.1.2.3. Company Financials
- 12.1.2.4. SWOT Analysis
- 12.1.3 Crown Castle International Corp
- 12.1.3.1. Company Overview
- 12.1.3.2. Products
- 12.1.3.3. Company Financials
- 12.1.3.4. SWOT Analysis
- 12.1.4 AT & T Intellectual Property
- 12.1.4.1. Company Overview
- 12.1.4.2. Products
- 12.1.4.3. Company Financials
- 12.1.4.4. SWOT Analysis
- 12.1.5 Vertical Bridge
- 12.1.5.1. Company Overview
- 12.1.5.2. Products
- 12.1.5.3. Company Financials
- 12.1.5.4. SWOT Analysis
- 12.1.6 Helios Towers plc
- 12.1.6.1. Company Overview
- 12.1.6.2. Products
- 12.1.6.3. Company Financials
- 12.1.6.4. SWOT Analysis
- 12.1.7 Tillman Infrastructure LLC
- 12.1.7.1. Company Overview
- 12.1.7.2. Products
- 12.1.7.3. Company Financials
- 12.1.7.4. SWOT Analysis
- 12.1.8 United States Cellular Co
- 12.1.8.1. Company Overview
- 12.1.8.2. Products
- 12.1.8.3. Company Financials
- 12.1.8.4. SWOT Analysis
- 12.1.9 ATC IP LLC
- 12.1.9.1. Company Overview
- 12.1.9.2. Products
- 12.1.9.3. Company Financials
- 12.1.9.4. SWOT Analysis
- 12.1.10 Insite Wireless Group
- 12.1.10.1. Company Overview
- 12.1.10.2. Products
- 12.1.10.3. Company Financials
- 12.1.10.4. SWOT Analysis
- 12.1.11 BNSF Railroad
- 12.1.11.1. Company Overview
- 12.1.11.2. Products
- 12.1.11.3. Company Financials
- 12.1.11.4. SWOT Analysis
- 12.1.1 SBA Communications Corporation
- 12.2. Market Entropy
- 12.2.1 Company's Key Areas Served
- 12.2.2 Recent Developments
- 12.3. Company Market Share Analysis 2025
- 12.3.1 Top 5 Companies Market Share Analysis
- 12.3.2 Top 3 Companies Market Share Analysis
- 12.4. List of Potential Customers
- 13. Research Methodology
List of Figures
- Figure 1: Global US Wireless Telecom Tower Industry Revenue Breakdown (billion, %) by Region 2025 & 2033
- Figure 2: Global US Wireless Telecom Tower Industry Volume Breakdown (K Unit, %) by Region 2025 & 2033
- Figure 3: North America US Wireless Telecom Tower Industry Revenue (billion), by Fuel Type 2025 & 2033
- Figure 4: North America US Wireless Telecom Tower Industry Volume (K Unit), by Fuel Type 2025 & 2033
- Figure 5: North America US Wireless Telecom Tower Industry Revenue Share (%), by Fuel Type 2025 & 2033
- Figure 6: North America US Wireless Telecom Tower Industry Volume Share (%), by Fuel Type 2025 & 2033
- Figure 7: North America US Wireless Telecom Tower Industry Revenue (billion), by Installation 2025 & 2033
- Figure 8: North America US Wireless Telecom Tower Industry Volume (K Unit), by Installation 2025 & 2033
- Figure 9: North America US Wireless Telecom Tower Industry Revenue Share (%), by Installation 2025 & 2033
- Figure 10: North America US Wireless Telecom Tower Industry Volume Share (%), by Installation 2025 & 2033
- Figure 11: North America US Wireless Telecom Tower Industry Revenue (billion), by Ownership 2025 & 2033
- Figure 12: North America US Wireless Telecom Tower Industry Volume (K Unit), by Ownership 2025 & 2033
- Figure 13: North America US Wireless Telecom Tower Industry Revenue Share (%), by Ownership 2025 & 2033
- Figure 14: North America US Wireless Telecom Tower Industry Volume Share (%), by Ownership 2025 & 2033
- Figure 15: North America US Wireless Telecom Tower Industry Revenue (billion), by Country 2025 & 2033
- Figure 16: North America US Wireless Telecom Tower Industry Volume (K Unit), by Country 2025 & 2033
- Figure 17: North America US Wireless Telecom Tower Industry Revenue Share (%), by Country 2025 & 2033
- Figure 18: North America US Wireless Telecom Tower Industry Volume Share (%), by Country 2025 & 2033
- Figure 19: South America US Wireless Telecom Tower Industry Revenue (billion), by Fuel Type 2025 & 2033
- Figure 20: South America US Wireless Telecom Tower Industry Volume (K Unit), by Fuel Type 2025 & 2033
- Figure 21: South America US Wireless Telecom Tower Industry Revenue Share (%), by Fuel Type 2025 & 2033
- Figure 22: South America US Wireless Telecom Tower Industry Volume Share (%), by Fuel Type 2025 & 2033
- Figure 23: South America US Wireless Telecom Tower Industry Revenue (billion), by Installation 2025 & 2033
- Figure 24: South America US Wireless Telecom Tower Industry Volume (K Unit), by Installation 2025 & 2033
- Figure 25: South America US Wireless Telecom Tower Industry Revenue Share (%), by Installation 2025 & 2033
- Figure 26: South America US Wireless Telecom Tower Industry Volume Share (%), by Installation 2025 & 2033
- Figure 27: South America US Wireless Telecom Tower Industry Revenue (billion), by Ownership 2025 & 2033
- Figure 28: South America US Wireless Telecom Tower Industry Volume (K Unit), by Ownership 2025 & 2033
- Figure 29: South America US Wireless Telecom Tower Industry Revenue Share (%), by Ownership 2025 & 2033
- Figure 30: South America US Wireless Telecom Tower Industry Volume Share (%), by Ownership 2025 & 2033
- Figure 31: South America US Wireless Telecom Tower Industry Revenue (billion), by Country 2025 & 2033
- Figure 32: South America US Wireless Telecom Tower Industry Volume (K Unit), by Country 2025 & 2033
- Figure 33: South America US Wireless Telecom Tower Industry Revenue Share (%), by Country 2025 & 2033
- Figure 34: South America US Wireless Telecom Tower Industry Volume Share (%), by Country 2025 & 2033
- Figure 35: Europe US Wireless Telecom Tower Industry Revenue (billion), by Fuel Type 2025 & 2033
- Figure 36: Europe US Wireless Telecom Tower Industry Volume (K Unit), by Fuel Type 2025 & 2033
- Figure 37: Europe US Wireless Telecom Tower Industry Revenue Share (%), by Fuel Type 2025 & 2033
- Figure 38: Europe US Wireless Telecom Tower Industry Volume Share (%), by Fuel Type 2025 & 2033
- Figure 39: Europe US Wireless Telecom Tower Industry Revenue (billion), by Installation 2025 & 2033
- Figure 40: Europe US Wireless Telecom Tower Industry Volume (K Unit), by Installation 2025 & 2033
- Figure 41: Europe US Wireless Telecom Tower Industry Revenue Share (%), by Installation 2025 & 2033
- Figure 42: Europe US Wireless Telecom Tower Industry Volume Share (%), by Installation 2025 & 2033
- Figure 43: Europe US Wireless Telecom Tower Industry Revenue (billion), by Ownership 2025 & 2033
- Figure 44: Europe US Wireless Telecom Tower Industry Volume (K Unit), by Ownership 2025 & 2033
- Figure 45: Europe US Wireless Telecom Tower Industry Revenue Share (%), by Ownership 2025 & 2033
- Figure 46: Europe US Wireless Telecom Tower Industry Volume Share (%), by Ownership 2025 & 2033
- Figure 47: Europe US Wireless Telecom Tower Industry Revenue (billion), by Country 2025 & 2033
- Figure 48: Europe US Wireless Telecom Tower Industry Volume (K Unit), by Country 2025 & 2033
- Figure 49: Europe US Wireless Telecom Tower Industry Revenue Share (%), by Country 2025 & 2033
- Figure 50: Europe US Wireless Telecom Tower Industry Volume Share (%), by Country 2025 & 2033
- Figure 51: Middle East & Africa US Wireless Telecom Tower Industry Revenue (billion), by Fuel Type 2025 & 2033
- Figure 52: Middle East & Africa US Wireless Telecom Tower Industry Volume (K Unit), by Fuel Type 2025 & 2033
- Figure 53: Middle East & Africa US Wireless Telecom Tower Industry Revenue Share (%), by Fuel Type 2025 & 2033
- Figure 54: Middle East & Africa US Wireless Telecom Tower Industry Volume Share (%), by Fuel Type 2025 & 2033
- Figure 55: Middle East & Africa US Wireless Telecom Tower Industry Revenue (billion), by Installation 2025 & 2033
- Figure 56: Middle East & Africa US Wireless Telecom Tower Industry Volume (K Unit), by Installation 2025 & 2033
- Figure 57: Middle East & Africa US Wireless Telecom Tower Industry Revenue Share (%), by Installation 2025 & 2033
- Figure 58: Middle East & Africa US Wireless Telecom Tower Industry Volume Share (%), by Installation 2025 & 2033
- Figure 59: Middle East & Africa US Wireless Telecom Tower Industry Revenue (billion), by Ownership 2025 & 2033
- Figure 60: Middle East & Africa US Wireless Telecom Tower Industry Volume (K Unit), by Ownership 2025 & 2033
- Figure 61: Middle East & Africa US Wireless Telecom Tower Industry Revenue Share (%), by Ownership 2025 & 2033
- Figure 62: Middle East & Africa US Wireless Telecom Tower Industry Volume Share (%), by Ownership 2025 & 2033
- Figure 63: Middle East & Africa US Wireless Telecom Tower Industry Revenue (billion), by Country 2025 & 2033
- Figure 64: Middle East & Africa US Wireless Telecom Tower Industry Volume (K Unit), by Country 2025 & 2033
- Figure 65: Middle East & Africa US Wireless Telecom Tower Industry Revenue Share (%), by Country 2025 & 2033
- Figure 66: Middle East & Africa US Wireless Telecom Tower Industry Volume Share (%), by Country 2025 & 2033
- Figure 67: Asia Pacific US Wireless Telecom Tower Industry Revenue (billion), by Fuel Type 2025 & 2033
- Figure 68: Asia Pacific US Wireless Telecom Tower Industry Volume (K Unit), by Fuel Type 2025 & 2033
- Figure 69: Asia Pacific US Wireless Telecom Tower Industry Revenue Share (%), by Fuel Type 2025 & 2033
- Figure 70: Asia Pacific US Wireless Telecom Tower Industry Volume Share (%), by Fuel Type 2025 & 2033
- Figure 71: Asia Pacific US Wireless Telecom Tower Industry Revenue (billion), by Installation 2025 & 2033
- Figure 72: Asia Pacific US Wireless Telecom Tower Industry Volume (K Unit), by Installation 2025 & 2033
- Figure 73: Asia Pacific US Wireless Telecom Tower Industry Revenue Share (%), by Installation 2025 & 2033
- Figure 74: Asia Pacific US Wireless Telecom Tower Industry Volume Share (%), by Installation 2025 & 2033
- Figure 75: Asia Pacific US Wireless Telecom Tower Industry Revenue (billion), by Ownership 2025 & 2033
- Figure 76: Asia Pacific US Wireless Telecom Tower Industry Volume (K Unit), by Ownership 2025 & 2033
- Figure 77: Asia Pacific US Wireless Telecom Tower Industry Revenue Share (%), by Ownership 2025 & 2033
- Figure 78: Asia Pacific US Wireless Telecom Tower Industry Volume Share (%), by Ownership 2025 & 2033
- Figure 79: Asia Pacific US Wireless Telecom Tower Industry Revenue (billion), by Country 2025 & 2033
- Figure 80: Asia Pacific US Wireless Telecom Tower Industry Volume (K Unit), by Country 2025 & 2033
- Figure 81: Asia Pacific US Wireless Telecom Tower Industry Revenue Share (%), by Country 2025 & 2033
- Figure 82: Asia Pacific US Wireless Telecom Tower Industry Volume Share (%), by Country 2025 & 2033
List of Tables
- Table 1: Global US Wireless Telecom Tower Industry Revenue billion Forecast, by Fuel Type 2020 & 2033
- Table 2: Global US Wireless Telecom Tower Industry Volume K Unit Forecast, by Fuel Type 2020 & 2033
- Table 3: Global US Wireless Telecom Tower Industry Revenue billion Forecast, by Installation 2020 & 2033
- Table 4: Global US Wireless Telecom Tower Industry Volume K Unit Forecast, by Installation 2020 & 2033
- Table 5: Global US Wireless Telecom Tower Industry Revenue billion Forecast, by Ownership 2020 & 2033
- Table 6: Global US Wireless Telecom Tower Industry Volume K Unit Forecast, by Ownership 2020 & 2033
- Table 7: Global US Wireless Telecom Tower Industry Revenue billion Forecast, by Region 2020 & 2033
- Table 8: Global US Wireless Telecom Tower Industry Volume K Unit Forecast, by Region 2020 & 2033
- Table 9: Global US Wireless Telecom Tower Industry Revenue billion Forecast, by Fuel Type 2020 & 2033
- Table 10: Global US Wireless Telecom Tower Industry Volume K Unit Forecast, by Fuel Type 2020 & 2033
- Table 11: Global US Wireless Telecom Tower Industry Revenue billion Forecast, by Installation 2020 & 2033
- Table 12: Global US Wireless Telecom Tower Industry Volume K Unit Forecast, by Installation 2020 & 2033
- Table 13: Global US Wireless Telecom Tower Industry Revenue billion Forecast, by Ownership 2020 & 2033
- Table 14: Global US Wireless Telecom Tower Industry Volume K Unit Forecast, by Ownership 2020 & 2033
- Table 15: Global US Wireless Telecom Tower Industry Revenue billion Forecast, by Country 2020 & 2033
- Table 16: Global US Wireless Telecom Tower Industry Volume K Unit Forecast, by Country 2020 & 2033
- Table 17: United States US Wireless Telecom Tower Industry Revenue (billion) Forecast, by Application 2020 & 2033
- Table 18: United States US Wireless Telecom Tower Industry Volume (K Unit) Forecast, by Application 2020 & 2033
- Table 19: Canada US Wireless Telecom Tower Industry Revenue (billion) Forecast, by Application 2020 & 2033
- Table 20: Canada US Wireless Telecom Tower Industry Volume (K Unit) Forecast, by Application 2020 & 2033
- Table 21: Mexico US Wireless Telecom Tower Industry Revenue (billion) Forecast, by Application 2020 & 2033
- Table 22: Mexico US Wireless Telecom Tower Industry Volume (K Unit) Forecast, by Application 2020 & 2033
- Table 23: Global US Wireless Telecom Tower Industry Revenue billion Forecast, by Fuel Type 2020 & 2033
- Table 24: Global US Wireless Telecom Tower Industry Volume K Unit Forecast, by Fuel Type 2020 & 2033
- Table 25: Global US Wireless Telecom Tower Industry Revenue billion Forecast, by Installation 2020 & 2033
- Table 26: Global US Wireless Telecom Tower Industry Volume K Unit Forecast, by Installation 2020 & 2033
- Table 27: Global US Wireless Telecom Tower Industry Revenue billion Forecast, by Ownership 2020 & 2033
- Table 28: Global US Wireless Telecom Tower Industry Volume K Unit Forecast, by Ownership 2020 & 2033
- Table 29: Global US Wireless Telecom Tower Industry Revenue billion Forecast, by Country 2020 & 2033
- Table 30: Global US Wireless Telecom Tower Industry Volume K Unit Forecast, by Country 2020 & 2033
- Table 31: Brazil US Wireless Telecom Tower Industry Revenue (billion) Forecast, by Application 2020 & 2033
- Table 32: Brazil US Wireless Telecom Tower Industry Volume (K Unit) Forecast, by Application 2020 & 2033
- Table 33: Argentina US Wireless Telecom Tower Industry Revenue (billion) Forecast, by Application 2020 & 2033
- Table 34: Argentina US Wireless Telecom Tower Industry Volume (K Unit) Forecast, by Application 2020 & 2033
- Table 35: Rest of South America US Wireless Telecom Tower Industry Revenue (billion) Forecast, by Application 2020 & 2033
- Table 36: Rest of South America US Wireless Telecom Tower Industry Volume (K Unit) Forecast, by Application 2020 & 2033
- Table 37: Global US Wireless Telecom Tower Industry Revenue billion Forecast, by Fuel Type 2020 & 2033
- Table 38: Global US Wireless Telecom Tower Industry Volume K Unit Forecast, by Fuel Type 2020 & 2033
- Table 39: Global US Wireless Telecom Tower Industry Revenue billion Forecast, by Installation 2020 & 2033
- Table 40: Global US Wireless Telecom Tower Industry Volume K Unit Forecast, by Installation 2020 & 2033
- Table 41: Global US Wireless Telecom Tower Industry Revenue billion Forecast, by Ownership 2020 & 2033
- Table 42: Global US Wireless Telecom Tower Industry Volume K Unit Forecast, by Ownership 2020 & 2033
- Table 43: Global US Wireless Telecom Tower Industry Revenue billion Forecast, by Country 2020 & 2033
- Table 44: Global US Wireless Telecom Tower Industry Volume K Unit Forecast, by Country 2020 & 2033
- Table 45: United Kingdom US Wireless Telecom Tower Industry Revenue (billion) Forecast, by Application 2020 & 2033
- Table 46: United Kingdom US Wireless Telecom Tower Industry Volume (K Unit) Forecast, by Application 2020 & 2033
- Table 47: Germany US Wireless Telecom Tower Industry Revenue (billion) Forecast, by Application 2020 & 2033
- Table 48: Germany US Wireless Telecom Tower Industry Volume (K Unit) Forecast, by Application 2020 & 2033
- Table 49: France US Wireless Telecom Tower Industry Revenue (billion) Forecast, by Application 2020 & 2033
- Table 50: France US Wireless Telecom Tower Industry Volume (K Unit) Forecast, by Application 2020 & 2033
- Table 51: Italy US Wireless Telecom Tower Industry Revenue (billion) Forecast, by Application 2020 & 2033
- Table 52: Italy US Wireless Telecom Tower Industry Volume (K Unit) Forecast, by Application 2020 & 2033
- Table 53: Spain US Wireless Telecom Tower Industry Revenue (billion) Forecast, by Application 2020 & 2033
- Table 54: Spain US Wireless Telecom Tower Industry Volume (K Unit) Forecast, by Application 2020 & 2033
- Table 55: Russia US Wireless Telecom Tower Industry Revenue (billion) Forecast, by Application 2020 & 2033
- Table 56: Russia US Wireless Telecom Tower Industry Volume (K Unit) Forecast, by Application 2020 & 2033
- Table 57: Benelux US Wireless Telecom Tower Industry Revenue (billion) Forecast, by Application 2020 & 2033
- Table 58: Benelux US Wireless Telecom Tower Industry Volume (K Unit) Forecast, by Application 2020 & 2033
- Table 59: Nordics US Wireless Telecom Tower Industry Revenue (billion) Forecast, by Application 2020 & 2033
- Table 60: Nordics US Wireless Telecom Tower Industry Volume (K Unit) Forecast, by Application 2020 & 2033
- Table 61: Rest of Europe US Wireless Telecom Tower Industry Revenue (billion) Forecast, by Application 2020 & 2033
- Table 62: Rest of Europe US Wireless Telecom Tower Industry Volume (K Unit) Forecast, by Application 2020 & 2033
- Table 63: Global US Wireless Telecom Tower Industry Revenue billion Forecast, by Fuel Type 2020 & 2033
- Table 64: Global US Wireless Telecom Tower Industry Volume K Unit Forecast, by Fuel Type 2020 & 2033
- Table 65: Global US Wireless Telecom Tower Industry Revenue billion Forecast, by Installation 2020 & 2033
- Table 66: Global US Wireless Telecom Tower Industry Volume K Unit Forecast, by Installation 2020 & 2033
- Table 67: Global US Wireless Telecom Tower Industry Revenue billion Forecast, by Ownership 2020 & 2033
- Table 68: Global US Wireless Telecom Tower Industry Volume K Unit Forecast, by Ownership 2020 & 2033
- Table 69: Global US Wireless Telecom Tower Industry Revenue billion Forecast, by Country 2020 & 2033
- Table 70: Global US Wireless Telecom Tower Industry Volume K Unit Forecast, by Country 2020 & 2033
- Table 71: Turkey US Wireless Telecom Tower Industry Revenue (billion) Forecast, by Application 2020 & 2033
- Table 72: Turkey US Wireless Telecom Tower Industry Volume (K Unit) Forecast, by Application 2020 & 2033
- Table 73: Israel US Wireless Telecom Tower Industry Revenue (billion) Forecast, by Application 2020 & 2033
- Table 74: Israel US Wireless Telecom Tower Industry Volume (K Unit) Forecast, by Application 2020 & 2033
- Table 75: GCC US Wireless Telecom Tower Industry Revenue (billion) Forecast, by Application 2020 & 2033
- Table 76: GCC US Wireless Telecom Tower Industry Volume (K Unit) Forecast, by Application 2020 & 2033
- Table 77: North Africa US Wireless Telecom Tower Industry Revenue (billion) Forecast, by Application 2020 & 2033
- Table 78: North Africa US Wireless Telecom Tower Industry Volume (K Unit) Forecast, by Application 2020 & 2033
- Table 79: South Africa US Wireless Telecom Tower Industry Revenue (billion) Forecast, by Application 2020 & 2033
- Table 80: South Africa US Wireless Telecom Tower Industry Volume (K Unit) Forecast, by Application 2020 & 2033
- Table 81: Rest of Middle East & Africa US Wireless Telecom Tower Industry Revenue (billion) Forecast, by Application 2020 & 2033
- Table 82: Rest of Middle East & Africa US Wireless Telecom Tower Industry Volume (K Unit) Forecast, by Application 2020 & 2033
- Table 83: Global US Wireless Telecom Tower Industry Revenue billion Forecast, by Fuel Type 2020 & 2033
- Table 84: Global US Wireless Telecom Tower Industry Volume K Unit Forecast, by Fuel Type 2020 & 2033
- Table 85: Global US Wireless Telecom Tower Industry Revenue billion Forecast, by Installation 2020 & 2033
- Table 86: Global US Wireless Telecom Tower Industry Volume K Unit Forecast, by Installation 2020 & 2033
- Table 87: Global US Wireless Telecom Tower Industry Revenue billion Forecast, by Ownership 2020 & 2033
- Table 88: Global US Wireless Telecom Tower Industry Volume K Unit Forecast, by Ownership 2020 & 2033
- Table 89: Global US Wireless Telecom Tower Industry Revenue billion Forecast, by Country 2020 & 2033
- Table 90: Global US Wireless Telecom Tower Industry Volume K Unit Forecast, by Country 2020 & 2033
- Table 91: China US Wireless Telecom Tower Industry Revenue (billion) Forecast, by Application 2020 & 2033
- Table 92: China US Wireless Telecom Tower Industry Volume (K Unit) Forecast, by Application 2020 & 2033
- Table 93: India US Wireless Telecom Tower Industry Revenue (billion) Forecast, by Application 2020 & 2033
- Table 94: India US Wireless Telecom Tower Industry Volume (K Unit) Forecast, by Application 2020 & 2033
- Table 95: Japan US Wireless Telecom Tower Industry Revenue (billion) Forecast, by Application 2020 & 2033
- Table 96: Japan US Wireless Telecom Tower Industry Volume (K Unit) Forecast, by Application 2020 & 2033
- Table 97: South Korea US Wireless Telecom Tower Industry Revenue (billion) Forecast, by Application 2020 & 2033
- Table 98: South Korea US Wireless Telecom Tower Industry Volume (K Unit) Forecast, by Application 2020 & 2033
- Table 99: ASEAN US Wireless Telecom Tower Industry Revenue (billion) Forecast, by Application 2020 & 2033
- Table 100: ASEAN US Wireless Telecom Tower Industry Volume (K Unit) Forecast, by Application 2020 & 2033
- Table 101: Oceania US Wireless Telecom Tower Industry Revenue (billion) Forecast, by Application 2020 & 2033
- Table 102: Oceania US Wireless Telecom Tower Industry Volume (K Unit) Forecast, by Application 2020 & 2033
- Table 103: Rest of Asia Pacific US Wireless Telecom Tower Industry Revenue (billion) Forecast, by Application 2020 & 2033
- Table 104: Rest of Asia Pacific US Wireless Telecom Tower Industry Volume (K Unit) Forecast, by Application 2020 & 2033
Frequently Asked Questions
1. What is the projected Compound Annual Growth Rate (CAGR) of the US Wireless Telecom Tower Industry?
The projected CAGR is approximately 4.7%.
2. Which companies are prominent players in the US Wireless Telecom Tower Industry?
Key companies in the market include SBA Communications Corporation, Melody Wireless Infrastructure, Crown Castle International Corp, AT & T Intellectual Property, Vertical Bridge, Helios Towers plc, Tillman Infrastructure LLC, United States Cellular Co, ATC IP LLC, Insite Wireless Group, BNSF Railroad.
3. What are the main segments of the US Wireless Telecom Tower Industry?
The market segments include Fuel Type, Installation, Ownership.
4. Can you provide details about the market size?
The market size is estimated to be USD 14.1 billion as of 2022.
5. What are some drivers contributing to market growth?
5G deployments are a major catalyst for growth in the cell-tower leasing environment.
6. What are the notable trends driving market growth?
Adoption of 5G to Drive the Market.
7. Are there any restraints impacting market growth?
Availability of Limited Spectrum.
8. Can you provide examples of recent developments in the market?
January 2022 - The announcement of a new 12-year collaboration between T-Mobile US, Inc. and Crown Castle International Corp. would enable T-Mobile to have more access to Crown Castle's towers and small cell sites as the company expands its national 5G network. With the help of the deal, the Un-carrier may serve customers across the United States by further extending and broadening the coverage of the company's 5G network and generating financial synergies after its merger. Additionally, the deal assists Crown Castle in developing long-term income development from small cells and towers.
9. What pricing options are available for accessing the report?
Pricing options include single-user, multi-user, and enterprise licenses priced at USD 3800, USD 4500, and USD 5800 respectively.
10. Is the market size provided in terms of value or volume?
The market size is provided in terms of value, measured in billion and volume, measured in K Unit.
11. Are there any specific market keywords associated with the report?
Yes, the market keyword associated with the report is "US Wireless Telecom Tower Industry," which aids in identifying and referencing the specific market segment covered.
12. How do I determine which pricing option suits my needs best?
The pricing options vary based on user requirements and access needs. Individual users may opt for single-user licenses, while businesses requiring broader access may choose multi-user or enterprise licenses for cost-effective access to the report.
13. Are there any additional resources or data provided in the US Wireless Telecom Tower Industry report?
While the report offers comprehensive insights, it's advisable to review the specific contents or supplementary materials provided to ascertain if additional resources or data are available.
14. How can I stay updated on further developments or reports in the US Wireless Telecom Tower Industry?
To stay informed about further developments, trends, and reports in the US Wireless Telecom Tower Industry, consider subscribing to industry newsletters, following relevant companies and organizations, or regularly checking reputable industry news sources and publications.
Methodology
Step 1 - Identification of Relevant Samples Size from Population Database


Step 2 - Approaches for Defining Global Market Size (Value, Volume* & Price*)

Note*: In applicable scenarios
Step 3 - Data Sources
Primary Research
- Web Analytics
- Survey Reports
- Research Institute
- Latest Research Reports
- Opinion Leaders
Secondary Research
- Annual Reports
- White Paper
- Latest Press Release
- Industry Association
- Paid Database
- Investor Presentations

Step 4 - Data Triangulation
Involves using different sources of information in order to increase the validity of a study
These sources are likely to be stakeholders in a program - participants, other researchers, program staff, other community members, and so on.
Then we put all data in single framework & apply various statistical tools to find out the dynamic on the market.
During the analysis stage, feedback from the stakeholder groups would be compared to determine areas of agreement as well as areas of divergence