
Key Insights
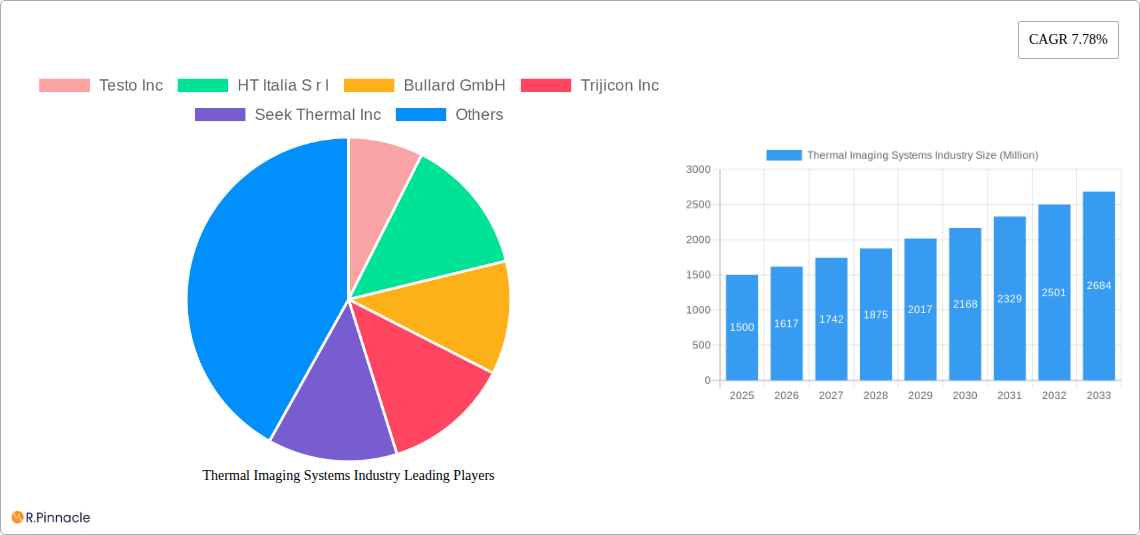
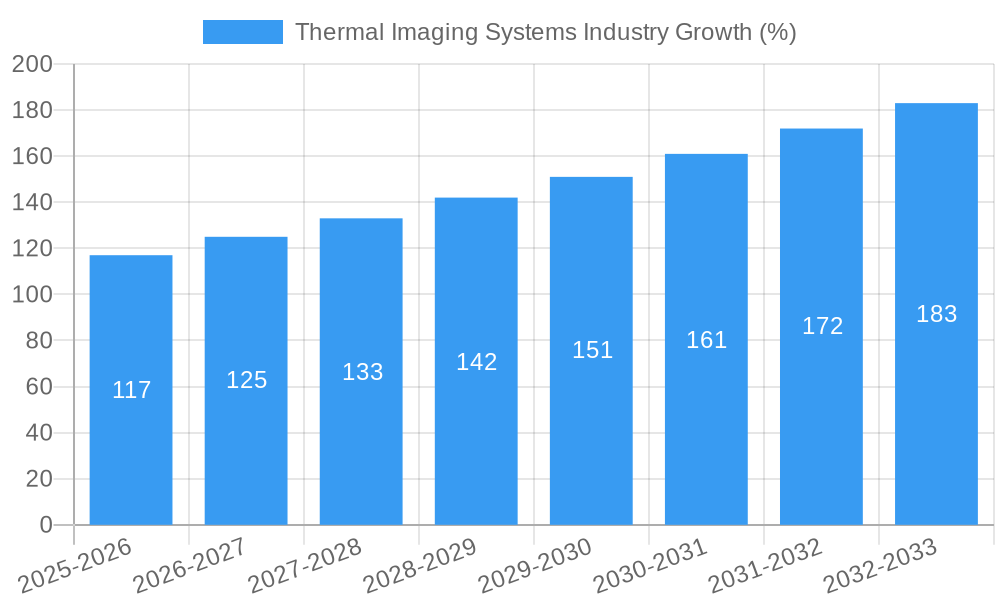
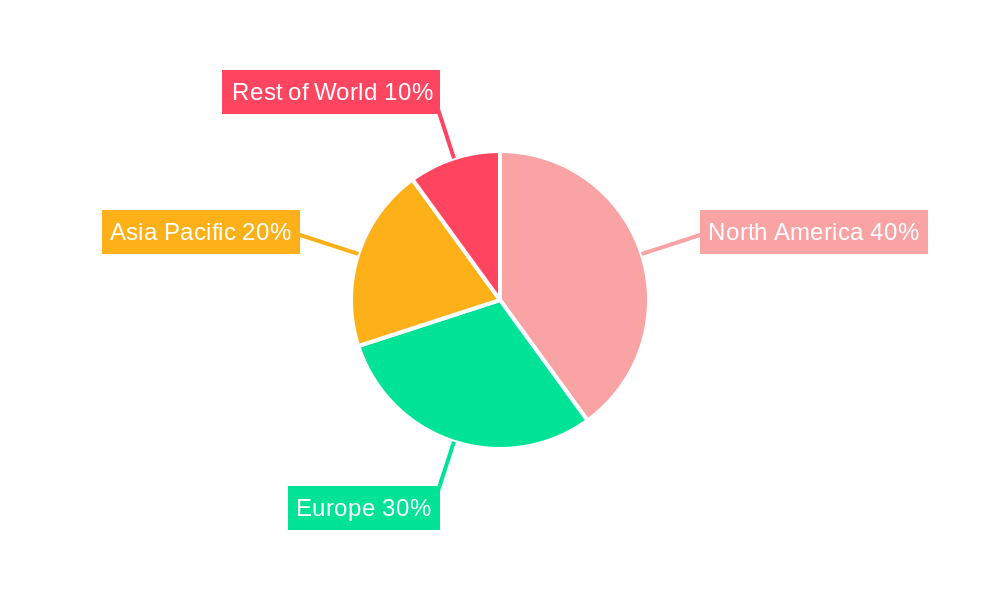
The global thermal imaging systems market is experiencing robust growth, driven by increasing demand across diverse sectors. A compound annual growth rate (CAGR) of 7.78% from 2019 to 2024 suggests a significant expansion, and this trajectory is projected to continue through 2033. Key drivers include advancements in sensor technology leading to improved image quality and reduced costs, miniaturization enabling integration into smaller devices like smartphones, and rising adoption in applications such as building inspection (thermography), defense and security (military and surveillance), and automotive safety. The market segmentation reveals strong growth in handheld imaging devices, reflecting the increasing need for portable and versatile solutions. The North American market currently holds a significant share, propelled by technological advancements and strong government investment in defense and security. However, Asia-Pacific is poised for rapid expansion due to increasing industrialization and infrastructure development, creating new opportunities for thermal imaging technology adoption across various sectors. While challenges such as high initial costs and the need for specialized expertise can act as restraints, ongoing technological innovation and decreasing prices are mitigating these factors, fostering market expansion.
The segmentation by application highlights the diverse usage of thermal imaging systems. Thermography for building inspection and predictive maintenance is a major segment, followed by military and surveillance applications, where these systems are crucial for night vision and target acquisition. The integration of thermal imaging into ruggedized smartphones is a rapidly growing sector, bringing thermal imaging technology to a broader consumer base. Growth in the automotive sector is expected, driven by the increasing need for advanced driver-assistance systems (ADAS) and autonomous vehicle development. The market's geographical distribution demonstrates a regional disparity, with North America and Europe currently dominating, but the Asia-Pacific region showing significant potential for future growth. Leading companies like FLIR Systems, Testo, and Raytheon are actively shaping market trends through continuous innovation and product diversification. The continued expansion of applications and technological advancements are anticipated to drive further market growth in the coming years. To illustrate, assuming a 2025 market size of $1.5 Billion (a reasonable estimation given the CAGR and market trends), we can extrapolate future market sizes using the CAGR, expecting substantial revenue increases in the forecast period.
Thermal Imaging Systems Industry Market Report: 2019-2033
This comprehensive report provides a detailed analysis of the Thermal Imaging Systems industry, offering invaluable insights for industry professionals, investors, and strategic decision-makers. Covering the period from 2019 to 2033, with a focus on 2025, this report dissects market dynamics, technological advancements, and competitive landscapes to illuminate future growth trajectories. The report leverages extensive data analysis to forecast market size and growth, providing actionable intelligence for informed strategic planning.
Thermal Imaging Systems Industry Market Structure & Innovation Trends
This section analyzes the market structure, examining aspects like market concentration, innovation drivers, regulatory landscapes, and competitive dynamics within the thermal imaging systems industry. The study period covers 2019-2033.
The market exhibits a moderately consolidated structure with key players such as FLIR Systems Inc., Teledyne FLIR, and Raytheon Co. holding significant market share. However, the presence of several smaller, specialized companies indicates a competitive landscape. Innovation is driven by advancements in sensor technology, improved image processing algorithms, and the integration of artificial intelligence. Regulatory frameworks, particularly in defense and security sectors, significantly influence market development. Product substitutes, such as high-resolution visible light cameras, exist but are limited in low-light or adverse weather conditions. End-user demographics are diverse, ranging from military and law enforcement to commercial and industrial applications. M&A activity has been moderate, with deal values averaging around USD xx Million in recent years. Examples include the USD 500.2 Million agreement between Teledyne FLIR Defense and the US Army (May 2022).
- Market Concentration: Moderately consolidated, with key players holding significant shares.
- Innovation Drivers: Advancements in sensor technology, AI integration, improved algorithms.
- Regulatory Frameworks: Significant influence, particularly in defense and security.
- Product Substitutes: Limited by performance limitations in challenging conditions.
- M&A Activity: Moderate, with average deal values of USD xx Million.
Thermal Imaging Systems Industry Market Dynamics & Trends
This section delves into the dynamic forces shaping the thermal imaging systems market. The analysis considers market growth drivers, technological advancements, consumer preferences, and competitive dynamics from 2019-2033.
The global thermal imaging systems market is experiencing robust growth, driven primarily by increasing demand from the military and security sectors, coupled with expanding commercial applications in industrial inspection, automotive safety, and building diagnostics. Technological advancements such as the development of higher-resolution sensors, improved thermal sensitivity, and smaller form factors are key growth catalysts. The market is witnessing increasing adoption of handheld devices and systems due to portability and ease of use. Consumer preferences are shifting towards systems offering enhanced image clarity, user-friendly interfaces, and advanced analytical capabilities. Competitive dynamics are characterized by ongoing innovation, strategic partnerships, and product diversification. The CAGR for the forecast period (2025-2033) is estimated to be xx%. Market penetration varies significantly across segments and regions, with higher penetration in developed markets like North America and Europe.
Dominant Regions & Segments in Thermal Imaging Systems Industry
This section identifies the leading regions and segments within the thermal imaging systems market, analyzing key drivers influencing their dominance. The analysis covers the period 2019-2033.
By Application:
- Military: Dominates the market due to high demand for surveillance, target acquisition, and night vision capabilities. Key drivers include increasing defense budgets and ongoing conflicts.
- Thermography: Significant growth is driven by rising demand for non-destructive testing and predictive maintenance in various industries.
- Surveillance: Strong growth due to increasing security concerns and advancements in video analytics.
- Other Applications (Automotive, Maritime, etc.): Show significant growth potential fueled by the increasing need for safety and efficiency improvements across industries.
By Form Factor:
- Handheld Imaging Devices & Systems: Largest segment due to its portability and ease of use. Growth is fueled by continuous improvement in image quality and functionality.
- Fixed Mounted (Rotary & Non-Rotary): Significant market share due to use in security, monitoring, and industrial applications.
By Country:
- North America: Holds the largest market share due to high defense spending and advanced technology adoption. Key drivers include strong economic growth and technological innovation.
- Europe: A substantial market driven by demand from security and industrial sectors.
- Asia-Pacific: Shows high growth potential owing to increasing infrastructural development and rising security awareness.
Other regions are predicted to experience slower yet consistent growth.
Thermal Imaging Systems Industry Product Innovations
Recent product innovations focus on improved image resolution, enhanced sensitivity, and miniaturization. Integration with AI and advanced analytics is a growing trend, enabling automatic target recognition and predictive maintenance functionalities. These innovations cater to evolving market demands for more efficient and user-friendly systems across various applications, from military and security to industrial inspection. The Trijicon Inc. launch of Q-LOC Technology (May 2022) exemplifies efforts to improve mounting systems.
Report Scope & Segmentation Analysis
This report segments the thermal imaging systems market by application (Thermography, Military, Surveillance, Personal Vision Systems, Fire Fighting, Smartphones (Ruggedized), Other Applications), form factor (Handheld, Fixed Mounted), and geography (North America, Europe, Asia-Pacific, Rest of the World). Each segment's growth projections, market size, and competitive dynamics are analyzed in detail for the period 2019-2033. The report provides granular insights into the market size and growth potential within each segment.
Key Drivers of Thermal Imaging Systems Industry Growth
The thermal imaging systems market is driven by several factors. Technological advancements, particularly in sensor technology and image processing, lead to improved image quality and functionality. Increased demand for security and surveillance solutions from government and commercial sectors contributes significantly. The rising need for predictive maintenance and non-destructive testing in industrial settings further fuels market growth. Favorable regulatory frameworks and supportive government policies in certain regions also boost adoption.
Challenges in the Thermal Imaging Systems Industry Sector
The industry faces challenges such as high initial investment costs for advanced systems, potential supply chain disruptions affecting component availability, and intense competition from established and emerging players. Regulatory hurdles in certain regions, particularly related to data privacy and security, also pose limitations to market expansion. These factors can influence overall market growth and profitability.
Emerging Opportunities in Thermal Imaging Systems Industry
The growing adoption of thermal imaging in various sectors such as smart cities, autonomous vehicles, and precision agriculture presents significant growth opportunities. Developments in AI and machine learning will enhance image analysis and automation capabilities, creating new market avenues. The increasing demand for energy-efficient and sustainable technologies offers opportunities for thermal imaging systems in building energy management and industrial process optimization.
Leading Players in the Thermal Imaging Systems Industry Market
- Testo Inc
- HT Italia S.r.l
- Bullard GmbH
- Trijicon Inc
- Seek Thermal Inc
- Raytheon Co
- Fluke Corporation
- Opgal Optronic Industries Ltd
- FLIR Systems Inc
Key Developments in Thermal Imaging Systems Industry
- May 2022: Teledyne FLIR System Inc. secured a USD 500.2 Million contract to supply thermal imaging systems to the United States Army.
- May 2022: Trijicon Inc. launched Q-LOC Technology Quick Release Mounts, enhancing compatibility across various optical platforms.
Future Outlook for Thermal Imaging Systems Industry Market
The thermal imaging systems market is poised for continued growth, driven by technological advancements, increasing demand across diverse sectors, and favorable regulatory support. Strategic partnerships, product diversification, and expansion into new applications will be key factors determining future market leadership. The market is expected to experience substantial expansion, particularly in developing economies and emerging applications.
Thermal Imaging Systems Industry Segmentation
-
1. Application
- 1.1. Thermography
- 1.2. Military
- 1.3. Surveillance
- 1.4. Personal Vision Systems
- 1.5. Fire Fighting
- 1.6. Smartphones (Ruggedized)
- 1.7. Other Ap
-
2. Form Factor
- 2.1. Handheld Imaging Devices and Systems
- 2.2. Fixed Mounted (Rotary and Non-Rotary)
Thermal Imaging Systems Industry Segmentation By Geography
-
1. North America
- 1.1. United States
- 1.2. Canada
- 1.3. Mexico
-
2. South America
- 2.1. Brazil
- 2.2. Argentina
- 2.3. Rest of South America
-
3. Europe
- 3.1. United Kingdom
- 3.2. Germany
- 3.3. France
- 3.4. Italy
- 3.5. Spain
- 3.6. Russia
- 3.7. Benelux
- 3.8. Nordics
- 3.9. Rest of Europe
-
4. Middle East & Africa
- 4.1. Turkey
- 4.2. Israel
- 4.3. GCC
- 4.4. North Africa
- 4.5. South Africa
- 4.6. Rest of Middle East & Africa
-
5. Asia Pacific
- 5.1. China
- 5.2. India
- 5.3. Japan
- 5.4. South Korea
- 5.5. ASEAN
- 5.6. Oceania
- 5.7. Rest of Asia Pacific
Thermal Imaging Systems Industry REPORT HIGHLIGHTS
| Aspects | Details |
|---|---|
| Study Period | 2019-2033 |
| Base Year | 2024 |
| Estimated Year | 2025 |
| Forecast Period | 2025-2033 |
| Historical Period | 2019-2024 |
| Growth Rate | CAGR of 7.78% from 2019-2033 |
| Segmentation |
|
Table of Contents
- 1. Introduction
- 1.1. Research Scope
- 1.2. Market Segmentation
- 1.3. Research Methodology
- 1.4. Definitions and Assumptions
- 2. Executive Summary
- 2.1. Introduction
- 3. Market Dynamics
- 3.1. Introduction
- 3.2. Market Drivers
- 3.2.1. Reducing Cost of Thermal Imaging Systems has Led to the Adoption Across various End Users; Increasing Spending by Government and Defense Activities
- 3.3. Market Restrains
- 3.3.1. Lack of Regular Support and Services
- 3.4. Market Trends
- 3.4.1. Applications in Military to Drive the Market Growth
- 4. Market Factor Analysis
- 4.1. Porters Five Forces
- 4.2. Supply/Value Chain
- 4.3. PESTEL analysis
- 4.4. Market Entropy
- 4.5. Patent/Trademark Analysis
- 5. Global Thermal Imaging Systems Industry Analysis, Insights and Forecast, 2019-2031
- 5.1. Market Analysis, Insights and Forecast - by Application
- 5.1.1. Thermography
- 5.1.2. Military
- 5.1.3. Surveillance
- 5.1.4. Personal Vision Systems
- 5.1.5. Fire Fighting
- 5.1.6. Smartphones (Ruggedized)
- 5.1.7. Other Ap
- 5.2. Market Analysis, Insights and Forecast - by Form Factor
- 5.2.1. Handheld Imaging Devices and Systems
- 5.2.2. Fixed Mounted (Rotary and Non-Rotary)
- 5.3. Market Analysis, Insights and Forecast - by Region
- 5.3.1. North America
- 5.3.2. South America
- 5.3.3. Europe
- 5.3.4. Middle East & Africa
- 5.3.5. Asia Pacific
- 5.1. Market Analysis, Insights and Forecast - by Application
- 6. North America Thermal Imaging Systems Industry Analysis, Insights and Forecast, 2019-2031
- 6.1. Market Analysis, Insights and Forecast - by Application
- 6.1.1. Thermography
- 6.1.2. Military
- 6.1.3. Surveillance
- 6.1.4. Personal Vision Systems
- 6.1.5. Fire Fighting
- 6.1.6. Smartphones (Ruggedized)
- 6.1.7. Other Ap
- 6.2. Market Analysis, Insights and Forecast - by Form Factor
- 6.2.1. Handheld Imaging Devices and Systems
- 6.2.2. Fixed Mounted (Rotary and Non-Rotary)
- 6.1. Market Analysis, Insights and Forecast - by Application
- 7. South America Thermal Imaging Systems Industry Analysis, Insights and Forecast, 2019-2031
- 7.1. Market Analysis, Insights and Forecast - by Application
- 7.1.1. Thermography
- 7.1.2. Military
- 7.1.3. Surveillance
- 7.1.4. Personal Vision Systems
- 7.1.5. Fire Fighting
- 7.1.6. Smartphones (Ruggedized)
- 7.1.7. Other Ap
- 7.2. Market Analysis, Insights and Forecast - by Form Factor
- 7.2.1. Handheld Imaging Devices and Systems
- 7.2.2. Fixed Mounted (Rotary and Non-Rotary)
- 7.1. Market Analysis, Insights and Forecast - by Application
- 8. Europe Thermal Imaging Systems Industry Analysis, Insights and Forecast, 2019-2031
- 8.1. Market Analysis, Insights and Forecast - by Application
- 8.1.1. Thermography
- 8.1.2. Military
- 8.1.3. Surveillance
- 8.1.4. Personal Vision Systems
- 8.1.5. Fire Fighting
- 8.1.6. Smartphones (Ruggedized)
- 8.1.7. Other Ap
- 8.2. Market Analysis, Insights and Forecast - by Form Factor
- 8.2.1. Handheld Imaging Devices and Systems
- 8.2.2. Fixed Mounted (Rotary and Non-Rotary)
- 8.1. Market Analysis, Insights and Forecast - by Application
- 9. Middle East & Africa Thermal Imaging Systems Industry Analysis, Insights and Forecast, 2019-2031
- 9.1. Market Analysis, Insights and Forecast - by Application
- 9.1.1. Thermography
- 9.1.2. Military
- 9.1.3. Surveillance
- 9.1.4. Personal Vision Systems
- 9.1.5. Fire Fighting
- 9.1.6. Smartphones (Ruggedized)
- 9.1.7. Other Ap
- 9.2. Market Analysis, Insights and Forecast - by Form Factor
- 9.2.1. Handheld Imaging Devices and Systems
- 9.2.2. Fixed Mounted (Rotary and Non-Rotary)
- 9.1. Market Analysis, Insights and Forecast - by Application
- 10. Asia Pacific Thermal Imaging Systems Industry Analysis, Insights and Forecast, 2019-2031
- 10.1. Market Analysis, Insights and Forecast - by Application
- 10.1.1. Thermography
- 10.1.2. Military
- 10.1.3. Surveillance
- 10.1.4. Personal Vision Systems
- 10.1.5. Fire Fighting
- 10.1.6. Smartphones (Ruggedized)
- 10.1.7. Other Ap
- 10.2. Market Analysis, Insights and Forecast - by Form Factor
- 10.2.1. Handheld Imaging Devices and Systems
- 10.2.2. Fixed Mounted (Rotary and Non-Rotary)
- 10.1. Market Analysis, Insights and Forecast - by Application
- 11. North America Thermal Imaging Systems Industry Analysis, Insights and Forecast, 2019-2031
- 11.1. Market Analysis, Insights and Forecast - By Country/Sub-region
- 11.1.1.
- 12. Europe Thermal Imaging Systems Industry Analysis, Insights and Forecast, 2019-2031
- 12.1. Market Analysis, Insights and Forecast - By Country/Sub-region
- 12.1.1.
- 13. Asia Pacific Thermal Imaging Systems Industry Analysis, Insights and Forecast, 2019-2031
- 13.1. Market Analysis, Insights and Forecast - By Country/Sub-region
- 13.1.1.
- 14. Latin America Thermal Imaging Systems Industry Analysis, Insights and Forecast, 2019-2031
- 14.1. Market Analysis, Insights and Forecast - By Country/Sub-region
- 14.1.1.
- 15. Middle East and Africa Thermal Imaging Systems Industry Analysis, Insights and Forecast, 2019-2031
- 15.1. Market Analysis, Insights and Forecast - By Country/Sub-region
- 15.1.1.
- 16. Competitive Analysis
- 16.1. Global Market Share Analysis 2024
- 16.2. Company Profiles
- 16.2.1 Testo Inc
- 16.2.1.1. Overview
- 16.2.1.2. Products
- 16.2.1.3. SWOT Analysis
- 16.2.1.4. Recent Developments
- 16.2.1.5. Financials (Based on Availability)
- 16.2.2 HT Italia S r l
- 16.2.2.1. Overview
- 16.2.2.2. Products
- 16.2.2.3. SWOT Analysis
- 16.2.2.4. Recent Developments
- 16.2.2.5. Financials (Based on Availability)
- 16.2.3 Bullard GmbH
- 16.2.3.1. Overview
- 16.2.3.2. Products
- 16.2.3.3. SWOT Analysis
- 16.2.3.4. Recent Developments
- 16.2.3.5. Financials (Based on Availability)
- 16.2.4 Trijicon Inc
- 16.2.4.1. Overview
- 16.2.4.2. Products
- 16.2.4.3. SWOT Analysis
- 16.2.4.4. Recent Developments
- 16.2.4.5. Financials (Based on Availability)
- 16.2.5 Seek Thermal Inc
- 16.2.5.1. Overview
- 16.2.5.2. Products
- 16.2.5.3. SWOT Analysis
- 16.2.5.4. Recent Developments
- 16.2.5.5. Financials (Based on Availability)
- 16.2.6 Raytheon Co *List Not Exhaustive
- 16.2.6.1. Overview
- 16.2.6.2. Products
- 16.2.6.3. SWOT Analysis
- 16.2.6.4. Recent Developments
- 16.2.6.5. Financials (Based on Availability)
- 16.2.7 Fluke Corporation
- 16.2.7.1. Overview
- 16.2.7.2. Products
- 16.2.7.3. SWOT Analysis
- 16.2.7.4. Recent Developments
- 16.2.7.5. Financials (Based on Availability)
- 16.2.8 Opgal Optronic Industries Ltd
- 16.2.8.1. Overview
- 16.2.8.2. Products
- 16.2.8.3. SWOT Analysis
- 16.2.8.4. Recent Developments
- 16.2.8.5. Financials (Based on Availability)
- 16.2.9 Flir Systems Inc
- 16.2.9.1. Overview
- 16.2.9.2. Products
- 16.2.9.3. SWOT Analysis
- 16.2.9.4. Recent Developments
- 16.2.9.5. Financials (Based on Availability)
- 16.2.1 Testo Inc
List of Figures
- Figure 1: Global Thermal Imaging Systems Industry Revenue Breakdown (Million, %) by Region 2024 & 2032
- Figure 2: North America Thermal Imaging Systems Industry Revenue (Million), by Country 2024 & 2032
- Figure 3: North America Thermal Imaging Systems Industry Revenue Share (%), by Country 2024 & 2032
- Figure 4: Europe Thermal Imaging Systems Industry Revenue (Million), by Country 2024 & 2032
- Figure 5: Europe Thermal Imaging Systems Industry Revenue Share (%), by Country 2024 & 2032
- Figure 6: Asia Pacific Thermal Imaging Systems Industry Revenue (Million), by Country 2024 & 2032
- Figure 7: Asia Pacific Thermal Imaging Systems Industry Revenue Share (%), by Country 2024 & 2032
- Figure 8: Latin America Thermal Imaging Systems Industry Revenue (Million), by Country 2024 & 2032
- Figure 9: Latin America Thermal Imaging Systems Industry Revenue Share (%), by Country 2024 & 2032
- Figure 10: Middle East and Africa Thermal Imaging Systems Industry Revenue (Million), by Country 2024 & 2032
- Figure 11: Middle East and Africa Thermal Imaging Systems Industry Revenue Share (%), by Country 2024 & 2032
- Figure 12: North America Thermal Imaging Systems Industry Revenue (Million), by Application 2024 & 2032
- Figure 13: North America Thermal Imaging Systems Industry Revenue Share (%), by Application 2024 & 2032
- Figure 14: North America Thermal Imaging Systems Industry Revenue (Million), by Form Factor 2024 & 2032
- Figure 15: North America Thermal Imaging Systems Industry Revenue Share (%), by Form Factor 2024 & 2032
- Figure 16: North America Thermal Imaging Systems Industry Revenue (Million), by Country 2024 & 2032
- Figure 17: North America Thermal Imaging Systems Industry Revenue Share (%), by Country 2024 & 2032
- Figure 18: South America Thermal Imaging Systems Industry Revenue (Million), by Application 2024 & 2032
- Figure 19: South America Thermal Imaging Systems Industry Revenue Share (%), by Application 2024 & 2032
- Figure 20: South America Thermal Imaging Systems Industry Revenue (Million), by Form Factor 2024 & 2032
- Figure 21: South America Thermal Imaging Systems Industry Revenue Share (%), by Form Factor 2024 & 2032
- Figure 22: South America Thermal Imaging Systems Industry Revenue (Million), by Country 2024 & 2032
- Figure 23: South America Thermal Imaging Systems Industry Revenue Share (%), by Country 2024 & 2032
- Figure 24: Europe Thermal Imaging Systems Industry Revenue (Million), by Application 2024 & 2032
- Figure 25: Europe Thermal Imaging Systems Industry Revenue Share (%), by Application 2024 & 2032
- Figure 26: Europe Thermal Imaging Systems Industry Revenue (Million), by Form Factor 2024 & 2032
- Figure 27: Europe Thermal Imaging Systems Industry Revenue Share (%), by Form Factor 2024 & 2032
- Figure 28: Europe Thermal Imaging Systems Industry Revenue (Million), by Country 2024 & 2032
- Figure 29: Europe Thermal Imaging Systems Industry Revenue Share (%), by Country 2024 & 2032
- Figure 30: Middle East & Africa Thermal Imaging Systems Industry Revenue (Million), by Application 2024 & 2032
- Figure 31: Middle East & Africa Thermal Imaging Systems Industry Revenue Share (%), by Application 2024 & 2032
- Figure 32: Middle East & Africa Thermal Imaging Systems Industry Revenue (Million), by Form Factor 2024 & 2032
- Figure 33: Middle East & Africa Thermal Imaging Systems Industry Revenue Share (%), by Form Factor 2024 & 2032
- Figure 34: Middle East & Africa Thermal Imaging Systems Industry Revenue (Million), by Country 2024 & 2032
- Figure 35: Middle East & Africa Thermal Imaging Systems Industry Revenue Share (%), by Country 2024 & 2032
- Figure 36: Asia Pacific Thermal Imaging Systems Industry Revenue (Million), by Application 2024 & 2032
- Figure 37: Asia Pacific Thermal Imaging Systems Industry Revenue Share (%), by Application 2024 & 2032
- Figure 38: Asia Pacific Thermal Imaging Systems Industry Revenue (Million), by Form Factor 2024 & 2032
- Figure 39: Asia Pacific Thermal Imaging Systems Industry Revenue Share (%), by Form Factor 2024 & 2032
- Figure 40: Asia Pacific Thermal Imaging Systems Industry Revenue (Million), by Country 2024 & 2032
- Figure 41: Asia Pacific Thermal Imaging Systems Industry Revenue Share (%), by Country 2024 & 2032
List of Tables
- Table 1: Global Thermal Imaging Systems Industry Revenue Million Forecast, by Region 2019 & 2032
- Table 2: Global Thermal Imaging Systems Industry Revenue Million Forecast, by Application 2019 & 2032
- Table 3: Global Thermal Imaging Systems Industry Revenue Million Forecast, by Form Factor 2019 & 2032
- Table 4: Global Thermal Imaging Systems Industry Revenue Million Forecast, by Region 2019 & 2032
- Table 5: Global Thermal Imaging Systems Industry Revenue Million Forecast, by Country 2019 & 2032
- Table 6: Thermal Imaging Systems Industry Revenue (Million) Forecast, by Application 2019 & 2032
- Table 7: Global Thermal Imaging Systems Industry Revenue Million Forecast, by Country 2019 & 2032
- Table 8: Thermal Imaging Systems Industry Revenue (Million) Forecast, by Application 2019 & 2032
- Table 9: Global Thermal Imaging Systems Industry Revenue Million Forecast, by Country 2019 & 2032
- Table 10: Thermal Imaging Systems Industry Revenue (Million) Forecast, by Application 2019 & 2032
- Table 11: Global Thermal Imaging Systems Industry Revenue Million Forecast, by Country 2019 & 2032
- Table 12: Thermal Imaging Systems Industry Revenue (Million) Forecast, by Application 2019 & 2032
- Table 13: Global Thermal Imaging Systems Industry Revenue Million Forecast, by Country 2019 & 2032
- Table 14: Thermal Imaging Systems Industry Revenue (Million) Forecast, by Application 2019 & 2032
- Table 15: Global Thermal Imaging Systems Industry Revenue Million Forecast, by Application 2019 & 2032
- Table 16: Global Thermal Imaging Systems Industry Revenue Million Forecast, by Form Factor 2019 & 2032
- Table 17: Global Thermal Imaging Systems Industry Revenue Million Forecast, by Country 2019 & 2032
- Table 18: United States Thermal Imaging Systems Industry Revenue (Million) Forecast, by Application 2019 & 2032
- Table 19: Canada Thermal Imaging Systems Industry Revenue (Million) Forecast, by Application 2019 & 2032
- Table 20: Mexico Thermal Imaging Systems Industry Revenue (Million) Forecast, by Application 2019 & 2032
- Table 21: Global Thermal Imaging Systems Industry Revenue Million Forecast, by Application 2019 & 2032
- Table 22: Global Thermal Imaging Systems Industry Revenue Million Forecast, by Form Factor 2019 & 2032
- Table 23: Global Thermal Imaging Systems Industry Revenue Million Forecast, by Country 2019 & 2032
- Table 24: Brazil Thermal Imaging Systems Industry Revenue (Million) Forecast, by Application 2019 & 2032
- Table 25: Argentina Thermal Imaging Systems Industry Revenue (Million) Forecast, by Application 2019 & 2032
- Table 26: Rest of South America Thermal Imaging Systems Industry Revenue (Million) Forecast, by Application 2019 & 2032
- Table 27: Global Thermal Imaging Systems Industry Revenue Million Forecast, by Application 2019 & 2032
- Table 28: Global Thermal Imaging Systems Industry Revenue Million Forecast, by Form Factor 2019 & 2032
- Table 29: Global Thermal Imaging Systems Industry Revenue Million Forecast, by Country 2019 & 2032
- Table 30: United Kingdom Thermal Imaging Systems Industry Revenue (Million) Forecast, by Application 2019 & 2032
- Table 31: Germany Thermal Imaging Systems Industry Revenue (Million) Forecast, by Application 2019 & 2032
- Table 32: France Thermal Imaging Systems Industry Revenue (Million) Forecast, by Application 2019 & 2032
- Table 33: Italy Thermal Imaging Systems Industry Revenue (Million) Forecast, by Application 2019 & 2032
- Table 34: Spain Thermal Imaging Systems Industry Revenue (Million) Forecast, by Application 2019 & 2032
- Table 35: Russia Thermal Imaging Systems Industry Revenue (Million) Forecast, by Application 2019 & 2032
- Table 36: Benelux Thermal Imaging Systems Industry Revenue (Million) Forecast, by Application 2019 & 2032
- Table 37: Nordics Thermal Imaging Systems Industry Revenue (Million) Forecast, by Application 2019 & 2032
- Table 38: Rest of Europe Thermal Imaging Systems Industry Revenue (Million) Forecast, by Application 2019 & 2032
- Table 39: Global Thermal Imaging Systems Industry Revenue Million Forecast, by Application 2019 & 2032
- Table 40: Global Thermal Imaging Systems Industry Revenue Million Forecast, by Form Factor 2019 & 2032
- Table 41: Global Thermal Imaging Systems Industry Revenue Million Forecast, by Country 2019 & 2032
- Table 42: Turkey Thermal Imaging Systems Industry Revenue (Million) Forecast, by Application 2019 & 2032
- Table 43: Israel Thermal Imaging Systems Industry Revenue (Million) Forecast, by Application 2019 & 2032
- Table 44: GCC Thermal Imaging Systems Industry Revenue (Million) Forecast, by Application 2019 & 2032
- Table 45: North Africa Thermal Imaging Systems Industry Revenue (Million) Forecast, by Application 2019 & 2032
- Table 46: South Africa Thermal Imaging Systems Industry Revenue (Million) Forecast, by Application 2019 & 2032
- Table 47: Rest of Middle East & Africa Thermal Imaging Systems Industry Revenue (Million) Forecast, by Application 2019 & 2032
- Table 48: Global Thermal Imaging Systems Industry Revenue Million Forecast, by Application 2019 & 2032
- Table 49: Global Thermal Imaging Systems Industry Revenue Million Forecast, by Form Factor 2019 & 2032
- Table 50: Global Thermal Imaging Systems Industry Revenue Million Forecast, by Country 2019 & 2032
- Table 51: China Thermal Imaging Systems Industry Revenue (Million) Forecast, by Application 2019 & 2032
- Table 52: India Thermal Imaging Systems Industry Revenue (Million) Forecast, by Application 2019 & 2032
- Table 53: Japan Thermal Imaging Systems Industry Revenue (Million) Forecast, by Application 2019 & 2032
- Table 54: South Korea Thermal Imaging Systems Industry Revenue (Million) Forecast, by Application 2019 & 2032
- Table 55: ASEAN Thermal Imaging Systems Industry Revenue (Million) Forecast, by Application 2019 & 2032
- Table 56: Oceania Thermal Imaging Systems Industry Revenue (Million) Forecast, by Application 2019 & 2032
- Table 57: Rest of Asia Pacific Thermal Imaging Systems Industry Revenue (Million) Forecast, by Application 2019 & 2032
Frequently Asked Questions
1. What is the projected Compound Annual Growth Rate (CAGR) of the Thermal Imaging Systems Industry?
The projected CAGR is approximately 7.78%.
2. Which companies are prominent players in the Thermal Imaging Systems Industry?
Key companies in the market include Testo Inc, HT Italia S r l, Bullard GmbH, Trijicon Inc, Seek Thermal Inc, Raytheon Co *List Not Exhaustive, Fluke Corporation, Opgal Optronic Industries Ltd, Flir Systems Inc.
3. What are the main segments of the Thermal Imaging Systems Industry?
The market segments include Application, Form Factor.
4. Can you provide details about the market size?
The market size is estimated to be USD XX Million as of 2022.
5. What are some drivers contributing to market growth?
Reducing Cost of Thermal Imaging Systems has Led to the Adoption Across various End Users; Increasing Spending by Government and Defense Activities.
6. What are the notable trends driving market growth?
Applications in Military to Drive the Market Growth.
7. Are there any restraints impacting market growth?
Lack of Regular Support and Services.
8. Can you provide examples of recent developments in the market?
May 2022 - Teledyne FLIR System Inc., Defense will supply thermal imaging systems to the United States Army. The FWS-I system will provide infrared imaging to soldiers in all weather and illumination circumstances. Teledyne Technologies' Teledyne FLIR Defense has made a new agreement worth up to USD 500.2 Million to supply advanced thermal imaging systems to the United States Army.
9. What pricing options are available for accessing the report?
Pricing options include single-user, multi-user, and enterprise licenses priced at USD 4750, USD 5250, and USD 8750 respectively.
10. Is the market size provided in terms of value or volume?
The market size is provided in terms of value, measured in Million.
11. Are there any specific market keywords associated with the report?
Yes, the market keyword associated with the report is "Thermal Imaging Systems Industry," which aids in identifying and referencing the specific market segment covered.
12. How do I determine which pricing option suits my needs best?
The pricing options vary based on user requirements and access needs. Individual users may opt for single-user licenses, while businesses requiring broader access may choose multi-user or enterprise licenses for cost-effective access to the report.
13. Are there any additional resources or data provided in the Thermal Imaging Systems Industry report?
While the report offers comprehensive insights, it's advisable to review the specific contents or supplementary materials provided to ascertain if additional resources or data are available.
14. How can I stay updated on further developments or reports in the Thermal Imaging Systems Industry?
To stay informed about further developments, trends, and reports in the Thermal Imaging Systems Industry, consider subscribing to industry newsletters, following relevant companies and organizations, or regularly checking reputable industry news sources and publications.
Methodology
Step 1 - Identification of Relevant Samples Size from Population Database


Step 2 - Approaches for Defining Global Market Size (Value, Volume* & Price*)

Note*: In applicable scenarios
Step 3 - Data Sources
Primary Research
- Web Analytics
- Survey Reports
- Research Institute
- Latest Research Reports
- Opinion Leaders
Secondary Research
- Annual Reports
- White Paper
- Latest Press Release
- Industry Association
- Paid Database
- Investor Presentations

Step 4 - Data Triangulation
Involves using different sources of information in order to increase the validity of a study
These sources are likely to be stakeholders in a program - participants, other researchers, program staff, other community members, and so on.
Then we put all data in single framework & apply various statistical tools to find out the dynamic on the market.
During the analysis stage, feedback from the stakeholder groups would be compared to determine areas of agreement as well as areas of divergence


