
Key Insights
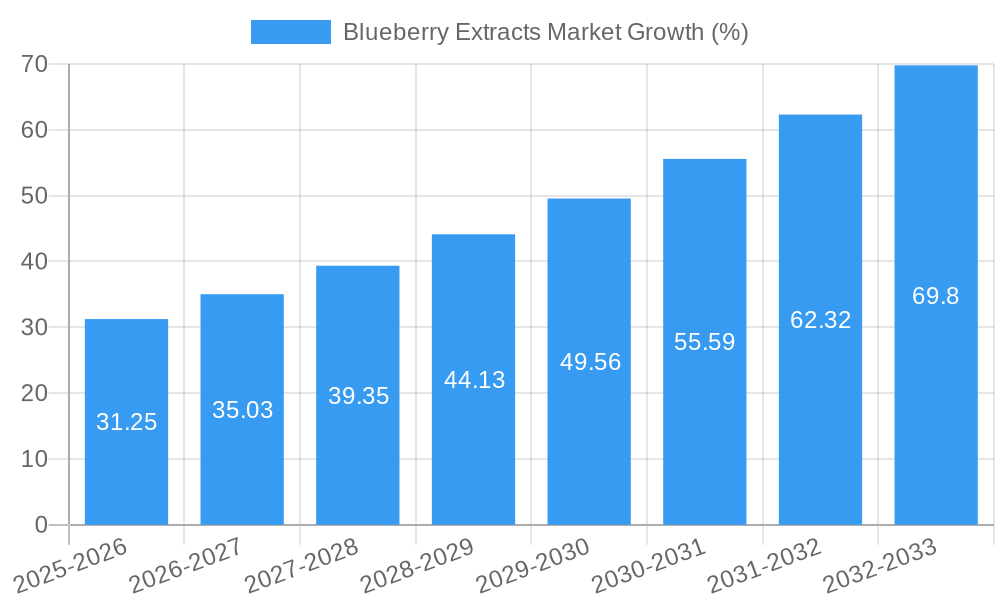
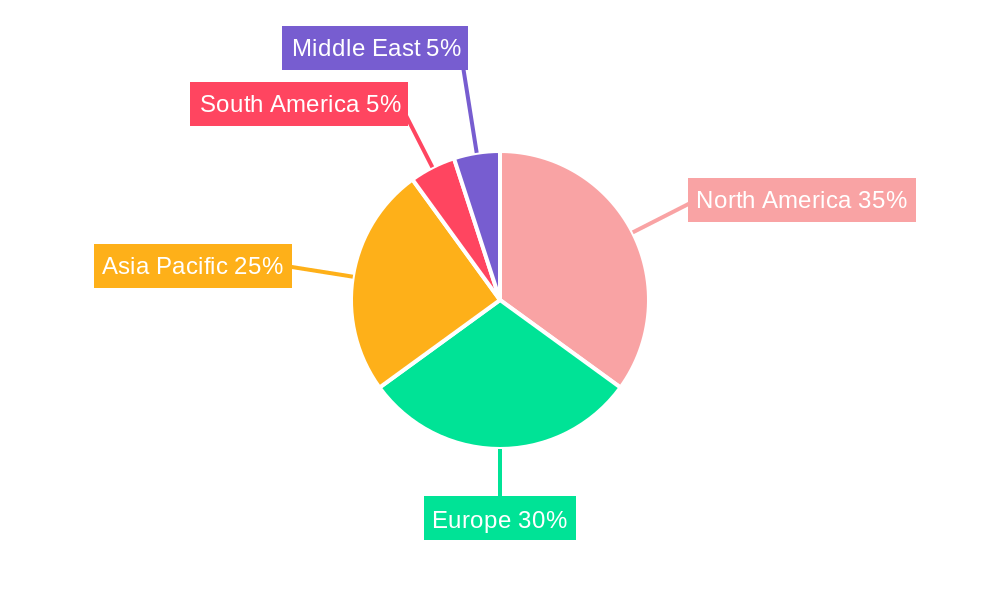
The global blueberry extract market is experiencing robust growth, projected to reach a significant value by 2033, driven by a 12.33% compound annual growth rate (CAGR) from 2025. This expansion is fueled by several key factors. The rising consumer demand for natural and functional foods and beverages is a primary driver, with blueberry extracts increasingly incorporated into various products due to their potent antioxidant properties and associated health benefits. The nutraceutical and dietary supplement sectors are major contributors to market growth, leveraging blueberry extracts' reputation for boosting cognitive function, improving cardiovascular health, and providing anti-inflammatory support. Furthermore, the pharmaceutical industry is exploring its applications in developing novel therapies. While the market's growth trajectory is positive, challenges such as fluctuating raw material prices and stringent regulatory approvals in certain regions could pose some constraints. The market is segmented by product type (liquid, powder, pills) and application (pharmaceutical, food & beverage, nutraceutical/dietary supplement), offering diverse avenues for market players. Regional growth is expected to vary, with North America and Europe currently holding a significant market share due to established consumer preferences and robust regulatory frameworks. However, Asia-Pacific is anticipated to witness significant growth in the coming years owing to increased health consciousness and rising disposable incomes. The competitive landscape includes both established players and emerging companies, leading to increased innovation and product diversification.
The market's future hinges on successful innovation within product formulation and delivery systems, tailored to consumer needs and preferences. Expanding into emerging markets and effectively addressing regulatory hurdles will be critical for sustained growth. The strategic partnerships between extract manufacturers, food and beverage companies, and supplement brands will further accelerate market penetration. Research into the efficacy of blueberry extracts in addressing specific health conditions will solidify its position within the pharmaceutical and nutraceutical sectors, driving further expansion. While price fluctuations remain a concern, sustainable sourcing and efficient manufacturing practices will be key to maintaining profitability and long-term market viability. The market’s evolution showcases a confluence of increasing consumer awareness regarding healthy lifestyle choices and the inherent potential of blueberry extract as a versatile and beneficial ingredient.
Blueberry Extracts Market: A Comprehensive Report (2019-2033)
This in-depth report provides a comprehensive analysis of the global Blueberry Extracts Market, offering actionable insights for industry professionals and strategic decision-makers. With a study period spanning 2019-2033, a base year of 2025, and a forecast period of 2025-2033, this report unveils the market's current state, future trajectory, and key influencing factors. The market size in 2025 is estimated at xx Million, with significant growth potential projected throughout the forecast period.
Blueberry Extracts Market Structure & Innovation Trends
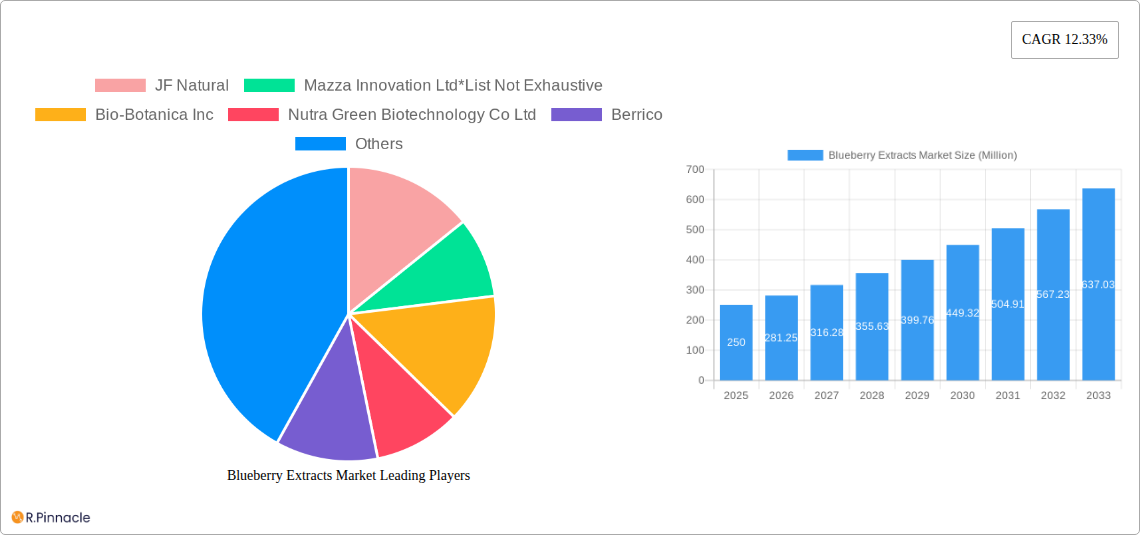
The Blueberry Extracts Market exhibits a moderately concentrated structure, with key players like JF Natural, Mazza Innovation Ltd, Bio-Botanica Inc, Nutra Green Biotechnology Co Ltd, Berrico, FutureCeuticals, and Shaanxi Guanjie Bio-technology Co Ltd holding significant market share. However, the market also accommodates numerous smaller players, indicating a dynamic competitive landscape. Market share data for 2025 is estimated at: JF Natural (xx%), Mazza Innovation Ltd (xx%), Bio-Botanica Inc (xx%), Nutra Green Biotechnology Co Ltd (xx%), Berrico (xx%), FutureCeuticals (xx%), Shaanxi Guanjie Bio-technology Co Ltd (xx%), Others (xx%). Innovation is driven by the increasing demand for natural and healthy food and beverage products, coupled with advancements in extraction technologies yielding higher quality and purity. Regulatory frameworks, including those pertaining to food safety and labeling, significantly influence market dynamics. While synthetic alternatives exist, the growing preference for natural ingredients fuels demand for blueberry extracts. M&A activity in the sector has been moderate in recent years, with a total deal value of approximately xx Million in the period 2019-2024, primarily focused on expanding product portfolios and geographic reach. End-user demographics are expanding, with increasing awareness of health benefits driving consumer demand across various age groups.
Blueberry Extracts Market Dynamics & Trends
The Blueberry Extracts Market is experiencing robust growth, driven by several key factors. The rising health consciousness among consumers, particularly regarding antioxidants and their role in disease prevention, is a major catalyst. The increasing prevalence of chronic diseases further fuels demand for functional foods and dietary supplements containing blueberry extracts. Technological advancements in extraction methods, resulting in improved product quality and efficiency, also contribute significantly to market growth. Consumer preference for clean label products, free from artificial additives, is pushing the adoption of natural blueberry extracts. The projected Compound Annual Growth Rate (CAGR) for the market during 2025-2033 is estimated at xx%, indicating substantial growth potential. Market penetration in key regions is expected to increase substantially, driven by expanding product availability and rising consumer awareness. The competitive landscape is characterized by both intense competition among established players and the emergence of new entrants.
Dominant Regions & Segments in Blueberry Extracts Market
The North American region currently dominates the Blueberry Extracts Market, driven by high consumer spending on health and wellness products and a well-established supply chain. Europe follows closely, while the Asia-Pacific region is poised for rapid growth due to increasing disposable incomes and rising health awareness.
Key Drivers for Regional Dominance:
- North America: High disposable incomes, strong consumer preference for functional foods, and well-established distribution networks.
- Europe: Growing demand for natural and organic food products, coupled with increasing health concerns.
- Asia-Pacific: Rising disposable incomes, increasing health awareness, and expanding distribution channels.
By Product Type, the powder segment holds the largest market share, attributed to its versatility in various applications and cost-effectiveness. The liquid segment is also experiencing significant growth driven by its ease of use and incorporation into beverages. Pills are a growing segment, especially in the nutraceutical sector. By Application, the Nutraceutical/Dietary Supplement segment exhibits the highest growth rate due to rising health consciousness and increasing demand for functional foods and supplements containing antioxidants. The Food & Beverage segment is also a key driver, with blueberry extracts being utilized as natural colorants and flavoring agents. The Pharmaceutical segment has a steady, albeit slower growth rate, with blueberry extracts used in some pharmaceutical formulations.
Blueberry Extracts Market Product Innovations
Recent product innovations focus on enhancing the bioavailability and stability of blueberry extracts through advanced extraction techniques and encapsulation methods. The introduction of standardized extracts with guaranteed concentrations of bioactive compounds also represents a major advancement. These innovations aim to enhance the efficacy and improve the shelf-life of blueberry extracts, catering to the evolving needs of various industries, particularly the food, beverage, and supplement sectors. Many companies are focusing on creating value-added products that are both healthy and appealing to consumers.
Report Scope & Segmentation Analysis
This report comprehensively segments the Blueberry Extracts Market by product type (Liquid, Powder, Pills) and application (Pharmaceutical, Food & Beverage, Nutraceutical/Dietary Supplement). Each segment's analysis encompasses growth projections, market size estimations for 2025, and a detailed assessment of the competitive dynamics within each segment. The report provides a thorough understanding of the market's structure and the opportunities within each segment. The Powder segment is projected to grow at xx% CAGR during the forecast period, driven by its versatility and cost-effectiveness. The Liquid segment's growth is projected at xx% CAGR, fueled by the ease of use and incorporation in beverages. The Pills segment is expected to grow at xx% CAGR, primarily driven by its suitability for targeted delivery in nutraceuticals. Within the applications segments, the Nutraceutical/Dietary Supplement sector shows the highest growth potential, with a projected CAGR of xx%. The Food & Beverage segment is expected to grow at xx% CAGR, driven by demand for natural colorants and flavors.
Key Drivers of Blueberry Extracts Market Growth
Several key factors drive the growth of the Blueberry Extracts Market. The rising health consciousness of consumers, seeking natural alternatives to synthetic additives, significantly fuels market expansion. The increasing scientific evidence supporting the health benefits of blueberries, particularly their high antioxidant content, boosts consumer demand. Technological advancements in extraction and processing techniques improve product quality, yield, and cost-effectiveness. Government regulations promoting the use of natural ingredients in food and beverages also create favorable market conditions.
Challenges in the Blueberry Extracts Market Sector
The Blueberry Extracts Market faces challenges including fluctuations in raw material prices, potential supply chain disruptions due to seasonal variations in blueberry production, and intense competition among existing and emerging players. Regulatory hurdles and stringent quality control requirements also pose challenges. Furthermore, consumer skepticism regarding product efficacy and the presence of synthetic alternatives may hinder market penetration.
Emerging Opportunities in Blueberry Extracts Market
Emerging opportunities include expanding into new geographical markets with high growth potential, developing innovative product formulations targeting specific health conditions, and focusing on personalized nutrition solutions incorporating blueberry extracts. The rising interest in functional foods and nutraceuticals presents lucrative avenues for growth. Exploration of novel applications, such as cosmetics and personal care, further expands the market's potential.
Leading Players in the Blueberry Extracts Market Market
- JF Natural
- Mazza Innovation Ltd
- Bio-Botanica Inc
- Nutra Green Biotechnology Co Ltd
- Berrico
- FutureCeuticals
- Shaanxi Guanjie Bio-technology Co Ltd
Key Developments in Blueberry Extracts Market Industry
- June 2022: Symrise announced its range of natural blueberry ingredients for food, beverage, and consumer health applications. This broadened the availability of high-quality blueberry extracts, stimulating market growth.
Future Outlook for Blueberry Extracts Market Market
The Blueberry Extracts Market is poised for substantial growth, driven by sustained consumer demand for natural and functional food products. Strategic partnerships, investments in R&D to develop innovative products, and expansion into new markets will be crucial for success. The focus on sustainability and ethical sourcing practices will further enhance market prospects. The market is expected to continue expanding, benefiting from the rising popularity of health-conscious lifestyles and the increasing demand for natural ingredients in various applications.
Blueberry Extracts Market Segmentation
-
1. Product Type
- 1.1. Liquid
- 1.2. Powder
- 1.3. Pills
-
2. Application
- 2.1. Pharmaceutical
- 2.2. Food & Beverage
- 2.3. Nutraceutical/Dietary Supplement
Blueberry Extracts Market Segmentation By Geography
-
1. North America
- 1.1. United States
- 1.2. Canada
- 1.3. Mexico
- 1.4. Rest of North America
-
2. Europe
- 2.1. United Kingdom
- 2.2. Germany
- 2.3. France
- 2.4. Russia
- 2.5. Italy
- 2.6. Spain
- 2.7. Rest of Europe
-
3. Asia Pacific
- 3.1. India
- 3.2. China
- 3.3. Japan
- 3.4. Australia
- 3.5. Rest of Asia Pacific
-
4. South America
- 4.1. Brazil
- 4.2. Argentina
- 4.3. Rest of South America
- 5. Middle East
-
6. South Africa
- 6.1. Saudi Arabia
- 6.2. Rest of MEA
Blueberry Extracts Market REPORT HIGHLIGHTS
| Aspects | Details |
|---|---|
| Study Period | 2019-2033 |
| Base Year | 2024 |
| Estimated Year | 2025 |
| Forecast Period | 2025-2033 |
| Historical Period | 2019-2024 |
| Growth Rate | CAGR of 12.33% from 2019-2033 |
| Segmentation |
|
Table of Contents
- 1. Introduction
- 1.1. Research Scope
- 1.2. Market Segmentation
- 1.3. Research Methodology
- 1.4. Definitions and Assumptions
- 2. Executive Summary
- 2.1. Introduction
- 3. Market Dynamics
- 3.1. Introduction
- 3.2. Market Drivers
- 3.2.1. Increasing application of Gelatin in healthcare and pharmaceutical sector
- 3.3. Market Restrains
- 3.3.1. Rising demand for clean label products
- 3.4. Market Trends
- 3.4.1. Mounting Trend of Healthy Snacking
- 4. Market Factor Analysis
- 4.1. Porters Five Forces
- 4.2. Supply/Value Chain
- 4.3. PESTEL analysis
- 4.4. Market Entropy
- 4.5. Patent/Trademark Analysis
- 5. Global Blueberry Extracts Market Analysis, Insights and Forecast, 2019-2031
- 5.1. Market Analysis, Insights and Forecast - by Product Type
- 5.1.1. Liquid
- 5.1.2. Powder
- 5.1.3. Pills
- 5.2. Market Analysis, Insights and Forecast - by Application
- 5.2.1. Pharmaceutical
- 5.2.2. Food & Beverage
- 5.2.3. Nutraceutical/Dietary Supplement
- 5.3. Market Analysis, Insights and Forecast - by Region
- 5.3.1. North America
- 5.3.2. Europe
- 5.3.3. Asia Pacific
- 5.3.4. South America
- 5.3.5. Middle East
- 5.3.6. South Africa
- 5.1. Market Analysis, Insights and Forecast - by Product Type
- 6. North America Blueberry Extracts Market Analysis, Insights and Forecast, 2019-2031
- 6.1. Market Analysis, Insights and Forecast - by Product Type
- 6.1.1. Liquid
- 6.1.2. Powder
- 6.1.3. Pills
- 6.2. Market Analysis, Insights and Forecast - by Application
- 6.2.1. Pharmaceutical
- 6.2.2. Food & Beverage
- 6.2.3. Nutraceutical/Dietary Supplement
- 6.1. Market Analysis, Insights and Forecast - by Product Type
- 7. Europe Blueberry Extracts Market Analysis, Insights and Forecast, 2019-2031
- 7.1. Market Analysis, Insights and Forecast - by Product Type
- 7.1.1. Liquid
- 7.1.2. Powder
- 7.1.3. Pills
- 7.2. Market Analysis, Insights and Forecast - by Application
- 7.2.1. Pharmaceutical
- 7.2.2. Food & Beverage
- 7.2.3. Nutraceutical/Dietary Supplement
- 7.1. Market Analysis, Insights and Forecast - by Product Type
- 8. Asia Pacific Blueberry Extracts Market Analysis, Insights and Forecast, 2019-2031
- 8.1. Market Analysis, Insights and Forecast - by Product Type
- 8.1.1. Liquid
- 8.1.2. Powder
- 8.1.3. Pills
- 8.2. Market Analysis, Insights and Forecast - by Application
- 8.2.1. Pharmaceutical
- 8.2.2. Food & Beverage
- 8.2.3. Nutraceutical/Dietary Supplement
- 8.1. Market Analysis, Insights and Forecast - by Product Type
- 9. South America Blueberry Extracts Market Analysis, Insights and Forecast, 2019-2031
- 9.1. Market Analysis, Insights and Forecast - by Product Type
- 9.1.1. Liquid
- 9.1.2. Powder
- 9.1.3. Pills
- 9.2. Market Analysis, Insights and Forecast - by Application
- 9.2.1. Pharmaceutical
- 9.2.2. Food & Beverage
- 9.2.3. Nutraceutical/Dietary Supplement
- 9.1. Market Analysis, Insights and Forecast - by Product Type
- 10. Middle East Blueberry Extracts Market Analysis, Insights and Forecast, 2019-2031
- 10.1. Market Analysis, Insights and Forecast - by Product Type
- 10.1.1. Liquid
- 10.1.2. Powder
- 10.1.3. Pills
- 10.2. Market Analysis, Insights and Forecast - by Application
- 10.2.1. Pharmaceutical
- 10.2.2. Food & Beverage
- 10.2.3. Nutraceutical/Dietary Supplement
- 10.1. Market Analysis, Insights and Forecast - by Product Type
- 11. South Africa Blueberry Extracts Market Analysis, Insights and Forecast, 2019-2031
- 11.1. Market Analysis, Insights and Forecast - by Product Type
- 11.1.1. Liquid
- 11.1.2. Powder
- 11.1.3. Pills
- 11.2. Market Analysis, Insights and Forecast - by Application
- 11.2.1. Pharmaceutical
- 11.2.2. Food & Beverage
- 11.2.3. Nutraceutical/Dietary Supplement
- 11.1. Market Analysis, Insights and Forecast - by Product Type
- 12. North America Blueberry Extracts Market Analysis, Insights and Forecast, 2019-2031
- 12.1. Market Analysis, Insights and Forecast - By Country/Sub-region
- 12.1.1 United States
- 12.1.2 Canada
- 12.1.3 Mexico
- 12.1.4 Rest of North America
- 13. Europe Blueberry Extracts Market Analysis, Insights and Forecast, 2019-2031
- 13.1. Market Analysis, Insights and Forecast - By Country/Sub-region
- 13.1.1 United Kingdom
- 13.1.2 Germany
- 13.1.3 France
- 13.1.4 Russia
- 13.1.5 Italy
- 13.1.6 Spain
- 13.1.7 Rest of Europe
- 14. Asia Pacific Blueberry Extracts Market Analysis, Insights and Forecast, 2019-2031
- 14.1. Market Analysis, Insights and Forecast - By Country/Sub-region
- 14.1.1 India
- 14.1.2 China
- 14.1.3 Japan
- 14.1.4 Australia
- 14.1.5 Rest of Asia Pacific
- 15. South America Blueberry Extracts Market Analysis, Insights and Forecast, 2019-2031
- 15.1. Market Analysis, Insights and Forecast - By Country/Sub-region
- 15.1.1 Brazil
- 15.1.2 Argentina
- 15.1.3 Rest of South America
- 16. Middle East Blueberry Extracts Market Analysis, Insights and Forecast, 2019-2031
- 16.1. Market Analysis, Insights and Forecast - By Country/Sub-region
- 16.1.1 United Arab Emirates
- 16.1.2 Saudi Arabia
- 16.1.3 Qatar
- 16.1.4 Israel
- 16.1.5 Egypt
- 16.1.6 Oman
- 16.1.7 Rest of Middle East
- 17. Competitive Analysis
- 17.1. Global Market Share Analysis 2024
- 17.2. Company Profiles
- 17.2.1 JF Natural
- 17.2.1.1. Overview
- 17.2.1.2. Products
- 17.2.1.3. SWOT Analysis
- 17.2.1.4. Recent Developments
- 17.2.1.5. Financials (Based on Availability)
- 17.2.2 Mazza Innovation Ltd*List Not Exhaustive
- 17.2.2.1. Overview
- 17.2.2.2. Products
- 17.2.2.3. SWOT Analysis
- 17.2.2.4. Recent Developments
- 17.2.2.5. Financials (Based on Availability)
- 17.2.3 Bio-Botanica Inc
- 17.2.3.1. Overview
- 17.2.3.2. Products
- 17.2.3.3. SWOT Analysis
- 17.2.3.4. Recent Developments
- 17.2.3.5. Financials (Based on Availability)
- 17.2.4 Nutra Green Biotechnology Co Ltd
- 17.2.4.1. Overview
- 17.2.4.2. Products
- 17.2.4.3. SWOT Analysis
- 17.2.4.4. Recent Developments
- 17.2.4.5. Financials (Based on Availability)
- 17.2.5 Berrico
- 17.2.5.1. Overview
- 17.2.5.2. Products
- 17.2.5.3. SWOT Analysis
- 17.2.5.4. Recent Developments
- 17.2.5.5. Financials (Based on Availability)
- 17.2.6 FutureCeuticals
- 17.2.6.1. Overview
- 17.2.6.2. Products
- 17.2.6.3. SWOT Analysis
- 17.2.6.4. Recent Developments
- 17.2.6.5. Financials (Based on Availability)
- 17.2.7 Shaanxi Guanjie Bio-technology Co Ltd
- 17.2.7.1. Overview
- 17.2.7.2. Products
- 17.2.7.3. SWOT Analysis
- 17.2.7.4. Recent Developments
- 17.2.7.5. Financials (Based on Availability)
- 17.2.1 JF Natural
List of Figures
- Figure 1: Global Blueberry Extracts Market Revenue Breakdown (Million, %) by Region 2024 & 2032
- Figure 2: Global Blueberry Extracts Market Volume Breakdown (K Units, %) by Region 2024 & 2032
- Figure 3: North America Blueberry Extracts Market Revenue (Million), by Country 2024 & 2032
- Figure 4: North America Blueberry Extracts Market Volume (K Units), by Country 2024 & 2032
- Figure 5: North America Blueberry Extracts Market Revenue Share (%), by Country 2024 & 2032
- Figure 6: North America Blueberry Extracts Market Volume Share (%), by Country 2024 & 2032
- Figure 7: Europe Blueberry Extracts Market Revenue (Million), by Country 2024 & 2032
- Figure 8: Europe Blueberry Extracts Market Volume (K Units), by Country 2024 & 2032
- Figure 9: Europe Blueberry Extracts Market Revenue Share (%), by Country 2024 & 2032
- Figure 10: Europe Blueberry Extracts Market Volume Share (%), by Country 2024 & 2032
- Figure 11: Asia Pacific Blueberry Extracts Market Revenue (Million), by Country 2024 & 2032
- Figure 12: Asia Pacific Blueberry Extracts Market Volume (K Units), by Country 2024 & 2032
- Figure 13: Asia Pacific Blueberry Extracts Market Revenue Share (%), by Country 2024 & 2032
- Figure 14: Asia Pacific Blueberry Extracts Market Volume Share (%), by Country 2024 & 2032
- Figure 15: South America Blueberry Extracts Market Revenue (Million), by Country 2024 & 2032
- Figure 16: South America Blueberry Extracts Market Volume (K Units), by Country 2024 & 2032
- Figure 17: South America Blueberry Extracts Market Revenue Share (%), by Country 2024 & 2032
- Figure 18: South America Blueberry Extracts Market Volume Share (%), by Country 2024 & 2032
- Figure 19: Middle East Blueberry Extracts Market Revenue (Million), by Country 2024 & 2032
- Figure 20: Middle East Blueberry Extracts Market Volume (K Units), by Country 2024 & 2032
- Figure 21: Middle East Blueberry Extracts Market Revenue Share (%), by Country 2024 & 2032
- Figure 22: Middle East Blueberry Extracts Market Volume Share (%), by Country 2024 & 2032
- Figure 23: North America Blueberry Extracts Market Revenue (Million), by Product Type 2024 & 2032
- Figure 24: North America Blueberry Extracts Market Volume (K Units), by Product Type 2024 & 2032
- Figure 25: North America Blueberry Extracts Market Revenue Share (%), by Product Type 2024 & 2032
- Figure 26: North America Blueberry Extracts Market Volume Share (%), by Product Type 2024 & 2032
- Figure 27: North America Blueberry Extracts Market Revenue (Million), by Application 2024 & 2032
- Figure 28: North America Blueberry Extracts Market Volume (K Units), by Application 2024 & 2032
- Figure 29: North America Blueberry Extracts Market Revenue Share (%), by Application 2024 & 2032
- Figure 30: North America Blueberry Extracts Market Volume Share (%), by Application 2024 & 2032
- Figure 31: North America Blueberry Extracts Market Revenue (Million), by Country 2024 & 2032
- Figure 32: North America Blueberry Extracts Market Volume (K Units), by Country 2024 & 2032
- Figure 33: North America Blueberry Extracts Market Revenue Share (%), by Country 2024 & 2032
- Figure 34: North America Blueberry Extracts Market Volume Share (%), by Country 2024 & 2032
- Figure 35: Europe Blueberry Extracts Market Revenue (Million), by Product Type 2024 & 2032
- Figure 36: Europe Blueberry Extracts Market Volume (K Units), by Product Type 2024 & 2032
- Figure 37: Europe Blueberry Extracts Market Revenue Share (%), by Product Type 2024 & 2032
- Figure 38: Europe Blueberry Extracts Market Volume Share (%), by Product Type 2024 & 2032
- Figure 39: Europe Blueberry Extracts Market Revenue (Million), by Application 2024 & 2032
- Figure 40: Europe Blueberry Extracts Market Volume (K Units), by Application 2024 & 2032
- Figure 41: Europe Blueberry Extracts Market Revenue Share (%), by Application 2024 & 2032
- Figure 42: Europe Blueberry Extracts Market Volume Share (%), by Application 2024 & 2032
- Figure 43: Europe Blueberry Extracts Market Revenue (Million), by Country 2024 & 2032
- Figure 44: Europe Blueberry Extracts Market Volume (K Units), by Country 2024 & 2032
- Figure 45: Europe Blueberry Extracts Market Revenue Share (%), by Country 2024 & 2032
- Figure 46: Europe Blueberry Extracts Market Volume Share (%), by Country 2024 & 2032
- Figure 47: Asia Pacific Blueberry Extracts Market Revenue (Million), by Product Type 2024 & 2032
- Figure 48: Asia Pacific Blueberry Extracts Market Volume (K Units), by Product Type 2024 & 2032
- Figure 49: Asia Pacific Blueberry Extracts Market Revenue Share (%), by Product Type 2024 & 2032
- Figure 50: Asia Pacific Blueberry Extracts Market Volume Share (%), by Product Type 2024 & 2032
- Figure 51: Asia Pacific Blueberry Extracts Market Revenue (Million), by Application 2024 & 2032
- Figure 52: Asia Pacific Blueberry Extracts Market Volume (K Units), by Application 2024 & 2032
- Figure 53: Asia Pacific Blueberry Extracts Market Revenue Share (%), by Application 2024 & 2032
- Figure 54: Asia Pacific Blueberry Extracts Market Volume Share (%), by Application 2024 & 2032
- Figure 55: Asia Pacific Blueberry Extracts Market Revenue (Million), by Country 2024 & 2032
- Figure 56: Asia Pacific Blueberry Extracts Market Volume (K Units), by Country 2024 & 2032
- Figure 57: Asia Pacific Blueberry Extracts Market Revenue Share (%), by Country 2024 & 2032
- Figure 58: Asia Pacific Blueberry Extracts Market Volume Share (%), by Country 2024 & 2032
- Figure 59: South America Blueberry Extracts Market Revenue (Million), by Product Type 2024 & 2032
- Figure 60: South America Blueberry Extracts Market Volume (K Units), by Product Type 2024 & 2032
- Figure 61: South America Blueberry Extracts Market Revenue Share (%), by Product Type 2024 & 2032
- Figure 62: South America Blueberry Extracts Market Volume Share (%), by Product Type 2024 & 2032
- Figure 63: South America Blueberry Extracts Market Revenue (Million), by Application 2024 & 2032
- Figure 64: South America Blueberry Extracts Market Volume (K Units), by Application 2024 & 2032
- Figure 65: South America Blueberry Extracts Market Revenue Share (%), by Application 2024 & 2032
- Figure 66: South America Blueberry Extracts Market Volume Share (%), by Application 2024 & 2032
- Figure 67: South America Blueberry Extracts Market Revenue (Million), by Country 2024 & 2032
- Figure 68: South America Blueberry Extracts Market Volume (K Units), by Country 2024 & 2032
- Figure 69: South America Blueberry Extracts Market Revenue Share (%), by Country 2024 & 2032
- Figure 70: South America Blueberry Extracts Market Volume Share (%), by Country 2024 & 2032
- Figure 71: Middle East Blueberry Extracts Market Revenue (Million), by Product Type 2024 & 2032
- Figure 72: Middle East Blueberry Extracts Market Volume (K Units), by Product Type 2024 & 2032
- Figure 73: Middle East Blueberry Extracts Market Revenue Share (%), by Product Type 2024 & 2032
- Figure 74: Middle East Blueberry Extracts Market Volume Share (%), by Product Type 2024 & 2032
- Figure 75: Middle East Blueberry Extracts Market Revenue (Million), by Application 2024 & 2032
- Figure 76: Middle East Blueberry Extracts Market Volume (K Units), by Application 2024 & 2032
- Figure 77: Middle East Blueberry Extracts Market Revenue Share (%), by Application 2024 & 2032
- Figure 78: Middle East Blueberry Extracts Market Volume Share (%), by Application 2024 & 2032
- Figure 79: Middle East Blueberry Extracts Market Revenue (Million), by Country 2024 & 2032
- Figure 80: Middle East Blueberry Extracts Market Volume (K Units), by Country 2024 & 2032
- Figure 81: Middle East Blueberry Extracts Market Revenue Share (%), by Country 2024 & 2032
- Figure 82: Middle East Blueberry Extracts Market Volume Share (%), by Country 2024 & 2032
- Figure 83: South Africa Blueberry Extracts Market Revenue (Million), by Product Type 2024 & 2032
- Figure 84: South Africa Blueberry Extracts Market Volume (K Units), by Product Type 2024 & 2032
- Figure 85: South Africa Blueberry Extracts Market Revenue Share (%), by Product Type 2024 & 2032
- Figure 86: South Africa Blueberry Extracts Market Volume Share (%), by Product Type 2024 & 2032
- Figure 87: South Africa Blueberry Extracts Market Revenue (Million), by Application 2024 & 2032
- Figure 88: South Africa Blueberry Extracts Market Volume (K Units), by Application 2024 & 2032
- Figure 89: South Africa Blueberry Extracts Market Revenue Share (%), by Application 2024 & 2032
- Figure 90: South Africa Blueberry Extracts Market Volume Share (%), by Application 2024 & 2032
- Figure 91: South Africa Blueberry Extracts Market Revenue (Million), by Country 2024 & 2032
- Figure 92: South Africa Blueberry Extracts Market Volume (K Units), by Country 2024 & 2032
- Figure 93: South Africa Blueberry Extracts Market Revenue Share (%), by Country 2024 & 2032
- Figure 94: South Africa Blueberry Extracts Market Volume Share (%), by Country 2024 & 2032
List of Tables
- Table 1: Global Blueberry Extracts Market Revenue Million Forecast, by Region 2019 & 2032
- Table 2: Global Blueberry Extracts Market Volume K Units Forecast, by Region 2019 & 2032
- Table 3: Global Blueberry Extracts Market Revenue Million Forecast, by Product Type 2019 & 2032
- Table 4: Global Blueberry Extracts Market Volume K Units Forecast, by Product Type 2019 & 2032
- Table 5: Global Blueberry Extracts Market Revenue Million Forecast, by Application 2019 & 2032
- Table 6: Global Blueberry Extracts Market Volume K Units Forecast, by Application 2019 & 2032
- Table 7: Global Blueberry Extracts Market Revenue Million Forecast, by Region 2019 & 2032
- Table 8: Global Blueberry Extracts Market Volume K Units Forecast, by Region 2019 & 2032
- Table 9: Global Blueberry Extracts Market Revenue Million Forecast, by Country 2019 & 2032
- Table 10: Global Blueberry Extracts Market Volume K Units Forecast, by Country 2019 & 2032
- Table 11: United States Blueberry Extracts Market Revenue (Million) Forecast, by Application 2019 & 2032
- Table 12: United States Blueberry Extracts Market Volume (K Units) Forecast, by Application 2019 & 2032
- Table 13: Canada Blueberry Extracts Market Revenue (Million) Forecast, by Application 2019 & 2032
- Table 14: Canada Blueberry Extracts Market Volume (K Units) Forecast, by Application 2019 & 2032
- Table 15: Mexico Blueberry Extracts Market Revenue (Million) Forecast, by Application 2019 & 2032
- Table 16: Mexico Blueberry Extracts Market Volume (K Units) Forecast, by Application 2019 & 2032
- Table 17: Rest of North America Blueberry Extracts Market Revenue (Million) Forecast, by Application 2019 & 2032
- Table 18: Rest of North America Blueberry Extracts Market Volume (K Units) Forecast, by Application 2019 & 2032
- Table 19: Global Blueberry Extracts Market Revenue Million Forecast, by Country 2019 & 2032
- Table 20: Global Blueberry Extracts Market Volume K Units Forecast, by Country 2019 & 2032
- Table 21: United Kingdom Blueberry Extracts Market Revenue (Million) Forecast, by Application 2019 & 2032
- Table 22: United Kingdom Blueberry Extracts Market Volume (K Units) Forecast, by Application 2019 & 2032
- Table 23: Germany Blueberry Extracts Market Revenue (Million) Forecast, by Application 2019 & 2032
- Table 24: Germany Blueberry Extracts Market Volume (K Units) Forecast, by Application 2019 & 2032
- Table 25: France Blueberry Extracts Market Revenue (Million) Forecast, by Application 2019 & 2032
- Table 26: France Blueberry Extracts Market Volume (K Units) Forecast, by Application 2019 & 2032
- Table 27: Russia Blueberry Extracts Market Revenue (Million) Forecast, by Application 2019 & 2032
- Table 28: Russia Blueberry Extracts Market Volume (K Units) Forecast, by Application 2019 & 2032
- Table 29: Italy Blueberry Extracts Market Revenue (Million) Forecast, by Application 2019 & 2032
- Table 30: Italy Blueberry Extracts Market Volume (K Units) Forecast, by Application 2019 & 2032
- Table 31: Spain Blueberry Extracts Market Revenue (Million) Forecast, by Application 2019 & 2032
- Table 32: Spain Blueberry Extracts Market Volume (K Units) Forecast, by Application 2019 & 2032
- Table 33: Rest of Europe Blueberry Extracts Market Revenue (Million) Forecast, by Application 2019 & 2032
- Table 34: Rest of Europe Blueberry Extracts Market Volume (K Units) Forecast, by Application 2019 & 2032
- Table 35: Global Blueberry Extracts Market Revenue Million Forecast, by Country 2019 & 2032
- Table 36: Global Blueberry Extracts Market Volume K Units Forecast, by Country 2019 & 2032
- Table 37: India Blueberry Extracts Market Revenue (Million) Forecast, by Application 2019 & 2032
- Table 38: India Blueberry Extracts Market Volume (K Units) Forecast, by Application 2019 & 2032
- Table 39: China Blueberry Extracts Market Revenue (Million) Forecast, by Application 2019 & 2032
- Table 40: China Blueberry Extracts Market Volume (K Units) Forecast, by Application 2019 & 2032
- Table 41: Japan Blueberry Extracts Market Revenue (Million) Forecast, by Application 2019 & 2032
- Table 42: Japan Blueberry Extracts Market Volume (K Units) Forecast, by Application 2019 & 2032
- Table 43: Australia Blueberry Extracts Market Revenue (Million) Forecast, by Application 2019 & 2032
- Table 44: Australia Blueberry Extracts Market Volume (K Units) Forecast, by Application 2019 & 2032
- Table 45: Rest of Asia Pacific Blueberry Extracts Market Revenue (Million) Forecast, by Application 2019 & 2032
- Table 46: Rest of Asia Pacific Blueberry Extracts Market Volume (K Units) Forecast, by Application 2019 & 2032
- Table 47: Global Blueberry Extracts Market Revenue Million Forecast, by Country 2019 & 2032
- Table 48: Global Blueberry Extracts Market Volume K Units Forecast, by Country 2019 & 2032
- Table 49: Brazil Blueberry Extracts Market Revenue (Million) Forecast, by Application 2019 & 2032
- Table 50: Brazil Blueberry Extracts Market Volume (K Units) Forecast, by Application 2019 & 2032
- Table 51: Argentina Blueberry Extracts Market Revenue (Million) Forecast, by Application 2019 & 2032
- Table 52: Argentina Blueberry Extracts Market Volume (K Units) Forecast, by Application 2019 & 2032
- Table 53: Rest of South America Blueberry Extracts Market Revenue (Million) Forecast, by Application 2019 & 2032
- Table 54: Rest of South America Blueberry Extracts Market Volume (K Units) Forecast, by Application 2019 & 2032
- Table 55: Global Blueberry Extracts Market Revenue Million Forecast, by Country 2019 & 2032
- Table 56: Global Blueberry Extracts Market Volume K Units Forecast, by Country 2019 & 2032
- Table 57: United Arab Emirates Blueberry Extracts Market Revenue (Million) Forecast, by Application 2019 & 2032
- Table 58: United Arab Emirates Blueberry Extracts Market Volume (K Units) Forecast, by Application 2019 & 2032
- Table 59: Saudi Arabia Blueberry Extracts Market Revenue (Million) Forecast, by Application 2019 & 2032
- Table 60: Saudi Arabia Blueberry Extracts Market Volume (K Units) Forecast, by Application 2019 & 2032
- Table 61: Qatar Blueberry Extracts Market Revenue (Million) Forecast, by Application 2019 & 2032
- Table 62: Qatar Blueberry Extracts Market Volume (K Units) Forecast, by Application 2019 & 2032
- Table 63: Israel Blueberry Extracts Market Revenue (Million) Forecast, by Application 2019 & 2032
- Table 64: Israel Blueberry Extracts Market Volume (K Units) Forecast, by Application 2019 & 2032
- Table 65: Egypt Blueberry Extracts Market Revenue (Million) Forecast, by Application 2019 & 2032
- Table 66: Egypt Blueberry Extracts Market Volume (K Units) Forecast, by Application 2019 & 2032
- Table 67: Oman Blueberry Extracts Market Revenue (Million) Forecast, by Application 2019 & 2032
- Table 68: Oman Blueberry Extracts Market Volume (K Units) Forecast, by Application 2019 & 2032
- Table 69: Rest of Middle East Blueberry Extracts Market Revenue (Million) Forecast, by Application 2019 & 2032
- Table 70: Rest of Middle East Blueberry Extracts Market Volume (K Units) Forecast, by Application 2019 & 2032
- Table 71: Global Blueberry Extracts Market Revenue Million Forecast, by Product Type 2019 & 2032
- Table 72: Global Blueberry Extracts Market Volume K Units Forecast, by Product Type 2019 & 2032
- Table 73: Global Blueberry Extracts Market Revenue Million Forecast, by Application 2019 & 2032
- Table 74: Global Blueberry Extracts Market Volume K Units Forecast, by Application 2019 & 2032
- Table 75: Global Blueberry Extracts Market Revenue Million Forecast, by Country 2019 & 2032
- Table 76: Global Blueberry Extracts Market Volume K Units Forecast, by Country 2019 & 2032
- Table 77: United States Blueberry Extracts Market Revenue (Million) Forecast, by Application 2019 & 2032
- Table 78: United States Blueberry Extracts Market Volume (K Units) Forecast, by Application 2019 & 2032
- Table 79: Canada Blueberry Extracts Market Revenue (Million) Forecast, by Application 2019 & 2032
- Table 80: Canada Blueberry Extracts Market Volume (K Units) Forecast, by Application 2019 & 2032
- Table 81: Mexico Blueberry Extracts Market Revenue (Million) Forecast, by Application 2019 & 2032
- Table 82: Mexico Blueberry Extracts Market Volume (K Units) Forecast, by Application 2019 & 2032
- Table 83: Rest of North America Blueberry Extracts Market Revenue (Million) Forecast, by Application 2019 & 2032
- Table 84: Rest of North America Blueberry Extracts Market Volume (K Units) Forecast, by Application 2019 & 2032
- Table 85: Global Blueberry Extracts Market Revenue Million Forecast, by Product Type 2019 & 2032
- Table 86: Global Blueberry Extracts Market Volume K Units Forecast, by Product Type 2019 & 2032
- Table 87: Global Blueberry Extracts Market Revenue Million Forecast, by Application 2019 & 2032
- Table 88: Global Blueberry Extracts Market Volume K Units Forecast, by Application 2019 & 2032
- Table 89: Global Blueberry Extracts Market Revenue Million Forecast, by Country 2019 & 2032
- Table 90: Global Blueberry Extracts Market Volume K Units Forecast, by Country 2019 & 2032
- Table 91: United Kingdom Blueberry Extracts Market Revenue (Million) Forecast, by Application 2019 & 2032
- Table 92: United Kingdom Blueberry Extracts Market Volume (K Units) Forecast, by Application 2019 & 2032
- Table 93: Germany Blueberry Extracts Market Revenue (Million) Forecast, by Application 2019 & 2032
- Table 94: Germany Blueberry Extracts Market Volume (K Units) Forecast, by Application 2019 & 2032
- Table 95: France Blueberry Extracts Market Revenue (Million) Forecast, by Application 2019 & 2032
- Table 96: France Blueberry Extracts Market Volume (K Units) Forecast, by Application 2019 & 2032
- Table 97: Russia Blueberry Extracts Market Revenue (Million) Forecast, by Application 2019 & 2032
- Table 98: Russia Blueberry Extracts Market Volume (K Units) Forecast, by Application 2019 & 2032
- Table 99: Italy Blueberry Extracts Market Revenue (Million) Forecast, by Application 2019 & 2032
- Table 100: Italy Blueberry Extracts Market Volume (K Units) Forecast, by Application 2019 & 2032
- Table 101: Spain Blueberry Extracts Market Revenue (Million) Forecast, by Application 2019 & 2032
- Table 102: Spain Blueberry Extracts Market Volume (K Units) Forecast, by Application 2019 & 2032
- Table 103: Rest of Europe Blueberry Extracts Market Revenue (Million) Forecast, by Application 2019 & 2032
- Table 104: Rest of Europe Blueberry Extracts Market Volume (K Units) Forecast, by Application 2019 & 2032
- Table 105: Global Blueberry Extracts Market Revenue Million Forecast, by Product Type 2019 & 2032
- Table 106: Global Blueberry Extracts Market Volume K Units Forecast, by Product Type 2019 & 2032
- Table 107: Global Blueberry Extracts Market Revenue Million Forecast, by Application 2019 & 2032
- Table 108: Global Blueberry Extracts Market Volume K Units Forecast, by Application 2019 & 2032
- Table 109: Global Blueberry Extracts Market Revenue Million Forecast, by Country 2019 & 2032
- Table 110: Global Blueberry Extracts Market Volume K Units Forecast, by Country 2019 & 2032
- Table 111: India Blueberry Extracts Market Revenue (Million) Forecast, by Application 2019 & 2032
- Table 112: India Blueberry Extracts Market Volume (K Units) Forecast, by Application 2019 & 2032
- Table 113: China Blueberry Extracts Market Revenue (Million) Forecast, by Application 2019 & 2032
- Table 114: China Blueberry Extracts Market Volume (K Units) Forecast, by Application 2019 & 2032
- Table 115: Japan Blueberry Extracts Market Revenue (Million) Forecast, by Application 2019 & 2032
- Table 116: Japan Blueberry Extracts Market Volume (K Units) Forecast, by Application 2019 & 2032
- Table 117: Australia Blueberry Extracts Market Revenue (Million) Forecast, by Application 2019 & 2032
- Table 118: Australia Blueberry Extracts Market Volume (K Units) Forecast, by Application 2019 & 2032
- Table 119: Rest of Asia Pacific Blueberry Extracts Market Revenue (Million) Forecast, by Application 2019 & 2032
- Table 120: Rest of Asia Pacific Blueberry Extracts Market Volume (K Units) Forecast, by Application 2019 & 2032
- Table 121: Global Blueberry Extracts Market Revenue Million Forecast, by Product Type 2019 & 2032
- Table 122: Global Blueberry Extracts Market Volume K Units Forecast, by Product Type 2019 & 2032
- Table 123: Global Blueberry Extracts Market Revenue Million Forecast, by Application 2019 & 2032
- Table 124: Global Blueberry Extracts Market Volume K Units Forecast, by Application 2019 & 2032
- Table 125: Global Blueberry Extracts Market Revenue Million Forecast, by Country 2019 & 2032
- Table 126: Global Blueberry Extracts Market Volume K Units Forecast, by Country 2019 & 2032
- Table 127: Brazil Blueberry Extracts Market Revenue (Million) Forecast, by Application 2019 & 2032
- Table 128: Brazil Blueberry Extracts Market Volume (K Units) Forecast, by Application 2019 & 2032
- Table 129: Argentina Blueberry Extracts Market Revenue (Million) Forecast, by Application 2019 & 2032
- Table 130: Argentina Blueberry Extracts Market Volume (K Units) Forecast, by Application 2019 & 2032
- Table 131: Rest of South America Blueberry Extracts Market Revenue (Million) Forecast, by Application 2019 & 2032
- Table 132: Rest of South America Blueberry Extracts Market Volume (K Units) Forecast, by Application 2019 & 2032
- Table 133: Global Blueberry Extracts Market Revenue Million Forecast, by Product Type 2019 & 2032
- Table 134: Global Blueberry Extracts Market Volume K Units Forecast, by Product Type 2019 & 2032
- Table 135: Global Blueberry Extracts Market Revenue Million Forecast, by Application 2019 & 2032
- Table 136: Global Blueberry Extracts Market Volume K Units Forecast, by Application 2019 & 2032
- Table 137: Global Blueberry Extracts Market Revenue Million Forecast, by Country 2019 & 2032
- Table 138: Global Blueberry Extracts Market Volume K Units Forecast, by Country 2019 & 2032
- Table 139: Global Blueberry Extracts Market Revenue Million Forecast, by Product Type 2019 & 2032
- Table 140: Global Blueberry Extracts Market Volume K Units Forecast, by Product Type 2019 & 2032
- Table 141: Global Blueberry Extracts Market Revenue Million Forecast, by Application 2019 & 2032
- Table 142: Global Blueberry Extracts Market Volume K Units Forecast, by Application 2019 & 2032
- Table 143: Global Blueberry Extracts Market Revenue Million Forecast, by Country 2019 & 2032
- Table 144: Global Blueberry Extracts Market Volume K Units Forecast, by Country 2019 & 2032
- Table 145: Saudi Arabia Blueberry Extracts Market Revenue (Million) Forecast, by Application 2019 & 2032
- Table 146: Saudi Arabia Blueberry Extracts Market Volume (K Units) Forecast, by Application 2019 & 2032
- Table 147: Rest of MEA Blueberry Extracts Market Revenue (Million) Forecast, by Application 2019 & 2032
- Table 148: Rest of MEA Blueberry Extracts Market Volume (K Units) Forecast, by Application 2019 & 2032
Frequently Asked Questions
1. What is the projected Compound Annual Growth Rate (CAGR) of the Blueberry Extracts Market?
The projected CAGR is approximately 12.33%.
2. Which companies are prominent players in the Blueberry Extracts Market?
Key companies in the market include JF Natural, Mazza Innovation Ltd*List Not Exhaustive, Bio-Botanica Inc, Nutra Green Biotechnology Co Ltd, Berrico, FutureCeuticals, Shaanxi Guanjie Bio-technology Co Ltd.
3. What are the main segments of the Blueberry Extracts Market?
The market segments include Product Type, Application.
4. Can you provide details about the market size?
The market size is estimated to be USD XX Million as of 2022.
5. What are some drivers contributing to market growth?
Increasing application of Gelatin in healthcare and pharmaceutical sector.
6. What are the notable trends driving market growth?
Mounting Trend of Healthy Snacking.
7. Are there any restraints impacting market growth?
Rising demand for clean label products.
8. Can you provide examples of recent developments in the market?
In June 2022, Symrise announced its range of natural blueberry ingredients for food, beverage, and consumer health applications.
9. What pricing options are available for accessing the report?
Pricing options include single-user, multi-user, and enterprise licenses priced at USD 4750, USD 5250, and USD 8750 respectively.
10. Is the market size provided in terms of value or volume?
The market size is provided in terms of value, measured in Million and volume, measured in K Units.
11. Are there any specific market keywords associated with the report?
Yes, the market keyword associated with the report is "Blueberry Extracts Market," which aids in identifying and referencing the specific market segment covered.
12. How do I determine which pricing option suits my needs best?
The pricing options vary based on user requirements and access needs. Individual users may opt for single-user licenses, while businesses requiring broader access may choose multi-user or enterprise licenses for cost-effective access to the report.
13. Are there any additional resources or data provided in the Blueberry Extracts Market report?
While the report offers comprehensive insights, it's advisable to review the specific contents or supplementary materials provided to ascertain if additional resources or data are available.
14. How can I stay updated on further developments or reports in the Blueberry Extracts Market?
To stay informed about further developments, trends, and reports in the Blueberry Extracts Market, consider subscribing to industry newsletters, following relevant companies and organizations, or regularly checking reputable industry news sources and publications.
Methodology
Step 1 - Identification of Relevant Samples Size from Population Database


Step 2 - Approaches for Defining Global Market Size (Value, Volume* & Price*)

Note*: In applicable scenarios
Step 3 - Data Sources
Primary Research
- Web Analytics
- Survey Reports
- Research Institute
- Latest Research Reports
- Opinion Leaders
Secondary Research
- Annual Reports
- White Paper
- Latest Press Release
- Industry Association
- Paid Database
- Investor Presentations

Step 4 - Data Triangulation
Involves using different sources of information in order to increase the validity of a study
These sources are likely to be stakeholders in a program - participants, other researchers, program staff, other community members, and so on.
Then we put all data in single framework & apply various statistical tools to find out the dynamic on the market.
During the analysis stage, feedback from the stakeholder groups would be compared to determine areas of agreement as well as areas of divergence


