
Key Insights
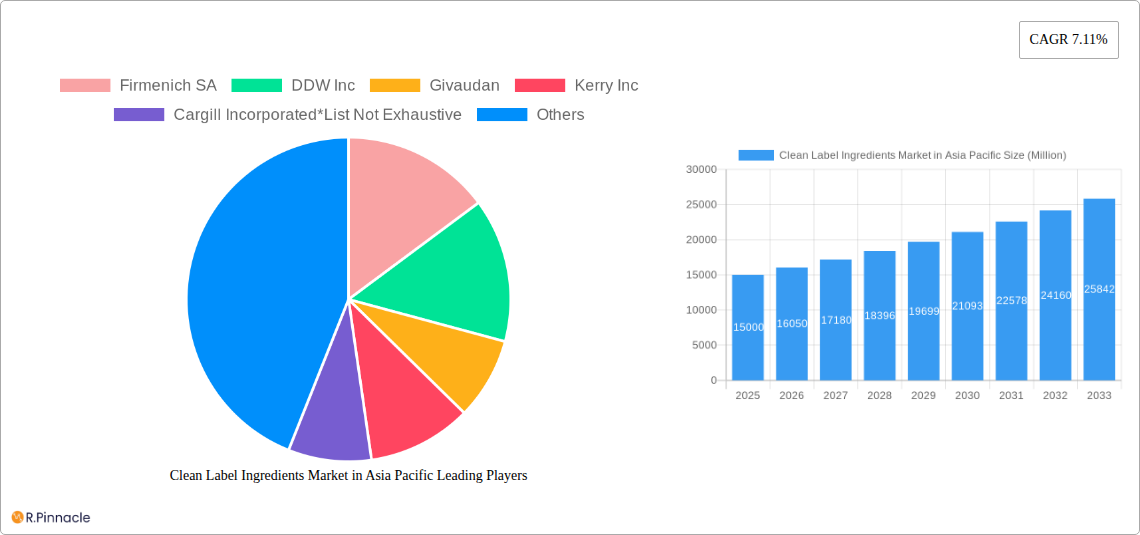
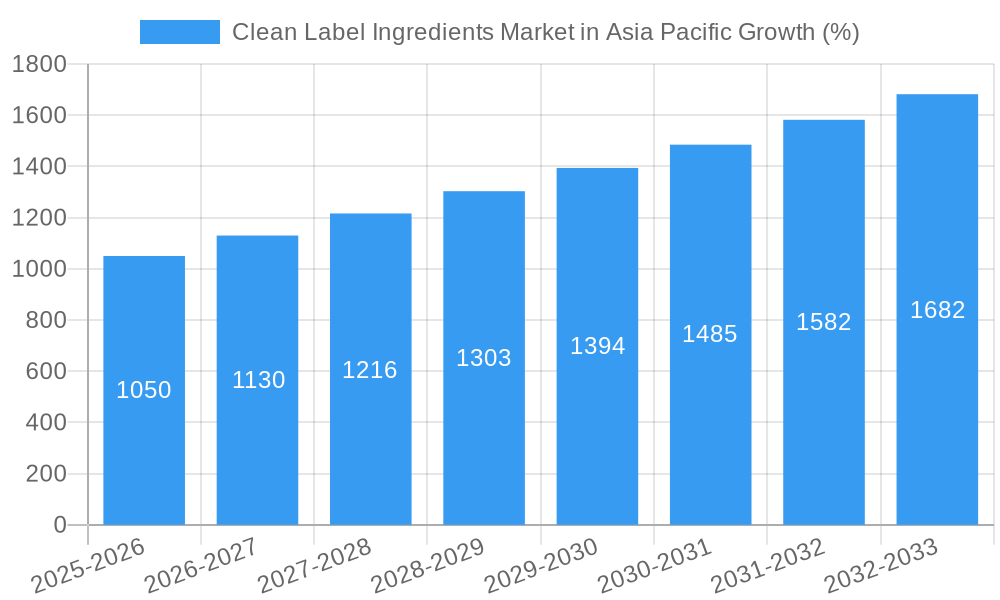
The Asia-Pacific clean label ingredients market is experiencing robust growth, driven by increasing consumer awareness of food additives and a rising preference for natural and minimally processed foods. The region's large and expanding population, coupled with increasing disposable incomes, particularly in countries like China and India, fuels demand for healthier and more transparent food products. This trend is further amplified by stricter government regulations regarding food labeling and the rising popularity of clean eating lifestyles. The market's segmentation reveals strong growth in the demand for clean label colorants, flavors, and sweeteners across diverse applications including beverages, bakery, confectionery, and dairy products. While preservatives remain a significant segment, the shift towards natural preservation methods is evident, impacting growth projections for this category in the long term. Companies like Firmenich, Givaudan, and Kerry are key players, leveraging their expertise in natural ingredient sourcing and processing to cater to this growing market. Competition is intense, focusing on innovation, product differentiation, and strategic partnerships to secure supply chains and expand market reach. The market's projected 7.11% CAGR from 2025 to 2033 indicates sustained growth potential, despite potential challenges like fluctuating raw material prices and the need to balance affordability with the premium nature of clean label ingredients.
The forecast for the Asia-Pacific clean label ingredients market is optimistic, considering the enduring consumer preference for natural and recognizable ingredients. While challenges like supply chain vulnerabilities and price fluctuations exist, the long-term outlook remains positive due to the region's demographic trends and evolving consumer expectations. Further market penetration will likely be witnessed in emerging economies within the Asia-Pacific region, as growing middle classes adopt healthier dietary habits. This expansion will necessitate increased investment in research and development to create innovative and cost-effective clean label solutions. Strategic collaborations between ingredient suppliers and food manufacturers will play a crucial role in fostering market growth and ensuring the consistent availability of high-quality clean label ingredients. Overall, the Asia-Pacific clean label ingredients market is poised for significant expansion, driven by consumer demand and industry innovation.
Clean Label Ingredients Market in Asia Pacific: A Comprehensive Market Analysis (2019-2033)
This comprehensive report provides an in-depth analysis of the Clean Label Ingredients market in the Asia Pacific region, covering the period 2019-2033. It offers invaluable insights for industry professionals, investors, and stakeholders seeking to understand market dynamics, growth opportunities, and competitive landscapes. The report leverages robust data and analysis to provide actionable strategies for success in this rapidly evolving market. The market is projected to reach xx Million by 2033.
Clean Label Ingredients Market in Asia Pacific Market Structure & Innovation Trends
This section analyzes the market structure, highlighting key players and their market share. The Asia-Pacific clean label ingredients market shows a moderately concentrated structure, with key players like Firmenich SA, DDW Inc, Givaudan, Kerry Inc, and Cargill Incorporated holding significant shares. However, several smaller, specialized companies are also emerging, driving innovation. The market is characterized by high M&A activity, with deal values exceeding xx Million in the past five years, reflecting the consolidation trend and the increasing demand for clean label products.
- Market Concentration: Moderately concentrated, with top 5 players holding approximately xx% market share.
- Innovation Drivers: Growing consumer awareness of health & wellness, stringent regulations, and the demand for natural and organic products are major drivers.
- Regulatory Framework: Varying regulations across countries within the Asia-Pacific region impact product development and market access.
- Product Substitutes: The availability of synthetic alternatives poses a competitive challenge, necessitating continuous innovation in natural and clean-label ingredients.
- End-User Demographics: The rising middle class and changing consumer preferences toward healthier food and beverages are key drivers.
- M&A Activities: Significant M&A activity in recent years, with deal values exceeding xx Million, indicating industry consolidation and expansion.
Clean Label Ingredients Market in Asia Pacific Market Dynamics & Trends
The Asia-Pacific clean label ingredients market is experiencing robust growth, driven by several key factors. The region's burgeoning middle class, coupled with rising health consciousness, fuels the demand for clean-label food and beverages. Technological advancements in ingredient processing and formulation are also significantly impacting market dynamics, enabling the development of novel, high-quality products. The market is experiencing a Compound Annual Growth Rate (CAGR) of xx% during the forecast period (2025-2033), with significant market penetration in key segments. Competitive dynamics are characterized by both intense rivalry among established players and the emergence of new entrants offering innovative products. Consumer preferences are shifting towards products with transparent labeling, natural ingredients, and minimal processing, pushing the demand for clean-label ingredients.
Dominant Regions & Segments in Clean Label Ingredients Market in Asia Pacific
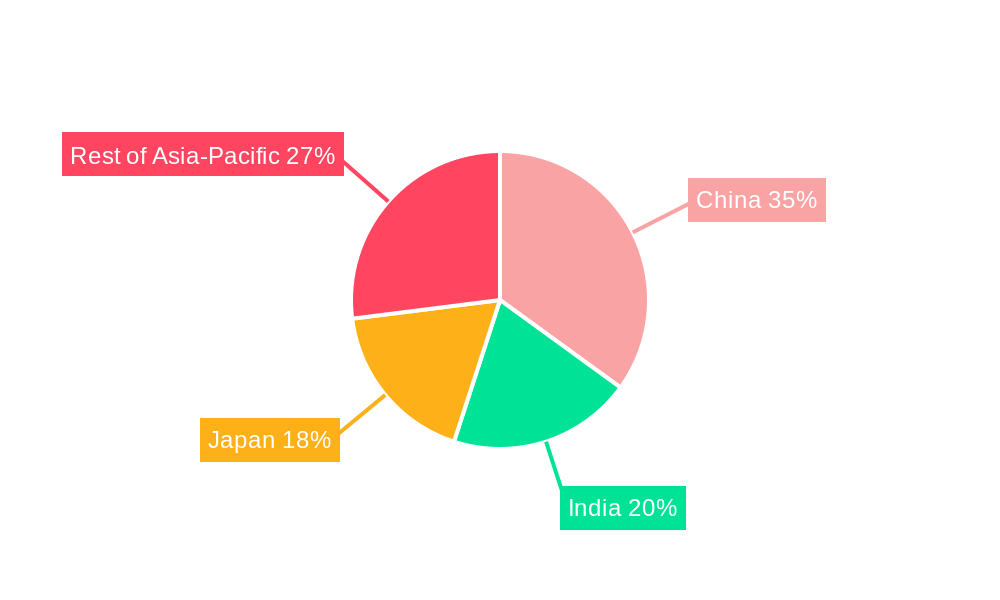
By Country: China dominates the market due to its large population, rapid economic growth, and expanding food and beverage industry. Japan follows, driven by high consumer demand for premium and healthy food options. India also shows significant growth potential.
By Ingredient Type: Flavors and flavor enhancers represent the largest segment, driven by the increasing popularity of customized and natural flavors. Food sweeteners, particularly natural alternatives, also experience substantial growth.
By Application: The beverage sector holds the leading position, followed by bakery and confectionery. The growing popularity of functional beverages and healthy snacks is driving this demand.
Key Drivers:
- China: Rapid economic growth, expanding middle class, and increasing food processing capacity.
- Japan: High consumer awareness of health and wellness, coupled with a preference for premium quality.
- India: Rising disposable incomes and a growing preference for convenience foods with clean labels.
- Australia: Strong regulatory framework promoting transparency and natural ingredients.
Clean Label Ingredients Market in Asia Pacific Product Innovations
Recent product innovations focus on the development of natural, sustainable, and functional clean label ingredients. This includes the use of plant-based alternatives, improved extraction techniques for natural colors and flavors, and the creation of new preservatives that maintain product quality without compromising clean label standards. Companies are leveraging technological advancements in fermentation, enzymatic processes, and precision extraction to enhance product quality and appeal, aligning with consumer demand for transparency and health-conscious choices.
Report Scope & Segmentation Analysis
This report segments the Asia-Pacific clean label ingredients market based on ingredient type (colorants, flavors & flavor enhancers, food sweeteners, preservatives, other ingredient types), application (beverage, bakery & confectionery, sauce & condiment, dairy & frozen dessert, other applications), and country (China, Japan, India, Australia, Rest of Asia-Pacific). Each segment’s growth projections, market size, and competitive dynamics are analyzed. The market shows varying growth rates across segments, with the flavors and flavor enhancers segment leading the way. Competitive dynamics are influenced by factors like pricing strategies, product differentiation, and brand recognition.
Key Drivers of Clean Label Ingredients Market in Asia Pacific Growth
The market's growth is primarily fueled by rising health consciousness among consumers, increasing demand for natural and organic food products, and stricter regulatory frameworks promoting transparency in food labeling. Technological advancements in ingredient processing and the development of sustainable sourcing practices further contribute to the market's expansion. Government initiatives supporting the food processing industry and increasing investment in research and development also play a crucial role.
Challenges in the Clean Label Ingredients Market in Asia Pacific Sector
The market faces challenges including the high cost of production for some clean-label ingredients, supply chain complexities, and variations in regulatory frameworks across different countries in the region. The presence of synthetic alternatives offering lower costs poses a competitive challenge. Furthermore, ensuring consistent quality and supply of natural ingredients can be difficult, impacting market stability.
Emerging Opportunities in Clean Label Ingredients Market in Asia Pacific
Emerging opportunities exist in developing clean-label ingredients tailored to specific health benefits, such as prebiotics and probiotics. There is also potential in expanding into niche markets such as vegan and plant-based foods. Innovations in sustainable sourcing practices and packaging solutions offer further growth potential.
Leading Players in the Clean Label Ingredients Market in Asia Pacific Market
- Firmenich SA
- DDW Inc
- Givaudan
- Kerry Inc
- Cargill Incorporated
- Chr Hansen Holding A/S
- Sensient Technologies Corporation
- Dohler Group
Key Developments in Clean Label Ingredients Market in Asia Pacific Industry
- January 2023: Givaudan launched a new range of natural flavors for beverages.
- March 2023: Kerry Group acquired a smaller clean label ingredients producer in India.
- June 2023: New regulations on food labeling were implemented in China.
Future Outlook for Clean Label Ingredients Market in Asia Pacific Market
The Asia-Pacific clean label ingredients market is poised for continued growth, driven by increasing consumer demand for healthy and sustainable food products. The market will see significant innovation, with companies focusing on developing new, functional ingredients and sustainable sourcing practices. Strategic partnerships and M&A activity will play a key role in shaping the competitive landscape. This presents significant opportunities for both established players and new entrants.
Clean Label Ingredients Market in Asia Pacific Segmentation
-
1. Ingredient Type
- 1.1. Colorants
- 1.2. Flavors and Flavor Enchancers
- 1.3. Food Sweeteners
- 1.4. Preservatives
- 1.5. Other Ingredient Types
-
2. Application
- 2.1. Beverage
- 2.2. Bakery and Confectionary
- 2.3. Sauce and Condiment
- 2.4. Dairy and Frozen Dessert
- 2.5. Other Applications
Clean Label Ingredients Market in Asia Pacific Segmentation By Geography
-
1. North America
- 1.1. United States
- 1.2. Canada
- 1.3. Mexico
-
2. South America
- 2.1. Brazil
- 2.2. Argentina
- 2.3. Rest of South America
-
3. Europe
- 3.1. United Kingdom
- 3.2. Germany
- 3.3. France
- 3.4. Italy
- 3.5. Spain
- 3.6. Russia
- 3.7. Benelux
- 3.8. Nordics
- 3.9. Rest of Europe
-
4. Middle East & Africa
- 4.1. Turkey
- 4.2. Israel
- 4.3. GCC
- 4.4. North Africa
- 4.5. South Africa
- 4.6. Rest of Middle East & Africa
-
5. Asia Pacific
- 5.1. China
- 5.2. India
- 5.3. Japan
- 5.4. South Korea
- 5.5. ASEAN
- 5.6. Oceania
- 5.7. Rest of Asia Pacific
Clean Label Ingredients Market in Asia Pacific REPORT HIGHLIGHTS
| Aspects | Details |
|---|---|
| Study Period | 2019-2033 |
| Base Year | 2024 |
| Estimated Year | 2025 |
| Forecast Period | 2025-2033 |
| Historical Period | 2019-2024 |
| Growth Rate | CAGR of 7.11% from 2019-2033 |
| Segmentation |
|
Table of Contents
- 1. Introduction
- 1.1. Research Scope
- 1.2. Market Segmentation
- 1.3. Research Methodology
- 1.4. Definitions and Assumptions
- 2. Executive Summary
- 2.1. Introduction
- 3. Market Dynamics
- 3.1. Introduction
- 3.2. Market Drivers
- 3.2.1. Rising Health Consciousness among consumer
- 3.3. Market Restrains
- 3.3.1. High Cost of natural Ingredients
- 3.4. Market Trends
- 3.4.1. Consumer Preference Toward Natural Food Ingredients
- 4. Market Factor Analysis
- 4.1. Porters Five Forces
- 4.2. Supply/Value Chain
- 4.3. PESTEL analysis
- 4.4. Market Entropy
- 4.5. Patent/Trademark Analysis
- 5. Global Clean Label Ingredients Market in Asia Pacific Analysis, Insights and Forecast, 2019-2031
- 5.1. Market Analysis, Insights and Forecast - by Ingredient Type
- 5.1.1. Colorants
- 5.1.2. Flavors and Flavor Enchancers
- 5.1.3. Food Sweeteners
- 5.1.4. Preservatives
- 5.1.5. Other Ingredient Types
- 5.2. Market Analysis, Insights and Forecast - by Application
- 5.2.1. Beverage
- 5.2.2. Bakery and Confectionary
- 5.2.3. Sauce and Condiment
- 5.2.4. Dairy and Frozen Dessert
- 5.2.5. Other Applications
- 5.3. Market Analysis, Insights and Forecast - by Region
- 5.3.1. North America
- 5.3.2. South America
- 5.3.3. Europe
- 5.3.4. Middle East & Africa
- 5.3.5. Asia Pacific
- 5.1. Market Analysis, Insights and Forecast - by Ingredient Type
- 6. North America Clean Label Ingredients Market in Asia Pacific Analysis, Insights and Forecast, 2019-2031
- 6.1. Market Analysis, Insights and Forecast - by Ingredient Type
- 6.1.1. Colorants
- 6.1.2. Flavors and Flavor Enchancers
- 6.1.3. Food Sweeteners
- 6.1.4. Preservatives
- 6.1.5. Other Ingredient Types
- 6.2. Market Analysis, Insights and Forecast - by Application
- 6.2.1. Beverage
- 6.2.2. Bakery and Confectionary
- 6.2.3. Sauce and Condiment
- 6.2.4. Dairy and Frozen Dessert
- 6.2.5. Other Applications
- 6.1. Market Analysis, Insights and Forecast - by Ingredient Type
- 7. South America Clean Label Ingredients Market in Asia Pacific Analysis, Insights and Forecast, 2019-2031
- 7.1. Market Analysis, Insights and Forecast - by Ingredient Type
- 7.1.1. Colorants
- 7.1.2. Flavors and Flavor Enchancers
- 7.1.3. Food Sweeteners
- 7.1.4. Preservatives
- 7.1.5. Other Ingredient Types
- 7.2. Market Analysis, Insights and Forecast - by Application
- 7.2.1. Beverage
- 7.2.2. Bakery and Confectionary
- 7.2.3. Sauce and Condiment
- 7.2.4. Dairy and Frozen Dessert
- 7.2.5. Other Applications
- 7.1. Market Analysis, Insights and Forecast - by Ingredient Type
- 8. Europe Clean Label Ingredients Market in Asia Pacific Analysis, Insights and Forecast, 2019-2031
- 8.1. Market Analysis, Insights and Forecast - by Ingredient Type
- 8.1.1. Colorants
- 8.1.2. Flavors and Flavor Enchancers
- 8.1.3. Food Sweeteners
- 8.1.4. Preservatives
- 8.1.5. Other Ingredient Types
- 8.2. Market Analysis, Insights and Forecast - by Application
- 8.2.1. Beverage
- 8.2.2. Bakery and Confectionary
- 8.2.3. Sauce and Condiment
- 8.2.4. Dairy and Frozen Dessert
- 8.2.5. Other Applications
- 8.1. Market Analysis, Insights and Forecast - by Ingredient Type
- 9. Middle East & Africa Clean Label Ingredients Market in Asia Pacific Analysis, Insights and Forecast, 2019-2031
- 9.1. Market Analysis, Insights and Forecast - by Ingredient Type
- 9.1.1. Colorants
- 9.1.2. Flavors and Flavor Enchancers
- 9.1.3. Food Sweeteners
- 9.1.4. Preservatives
- 9.1.5. Other Ingredient Types
- 9.2. Market Analysis, Insights and Forecast - by Application
- 9.2.1. Beverage
- 9.2.2. Bakery and Confectionary
- 9.2.3. Sauce and Condiment
- 9.2.4. Dairy and Frozen Dessert
- 9.2.5. Other Applications
- 9.1. Market Analysis, Insights and Forecast - by Ingredient Type
- 10. Asia Pacific Clean Label Ingredients Market in Asia Pacific Analysis, Insights and Forecast, 2019-2031
- 10.1. Market Analysis, Insights and Forecast - by Ingredient Type
- 10.1.1. Colorants
- 10.1.2. Flavors and Flavor Enchancers
- 10.1.3. Food Sweeteners
- 10.1.4. Preservatives
- 10.1.5. Other Ingredient Types
- 10.2. Market Analysis, Insights and Forecast - by Application
- 10.2.1. Beverage
- 10.2.2. Bakery and Confectionary
- 10.2.3. Sauce and Condiment
- 10.2.4. Dairy and Frozen Dessert
- 10.2.5. Other Applications
- 10.1. Market Analysis, Insights and Forecast - by Ingredient Type
- 11. China Clean Label Ingredients Market in Asia Pacific Analysis, Insights and Forecast, 2019-2031
- 12. Japan Clean Label Ingredients Market in Asia Pacific Analysis, Insights and Forecast, 2019-2031
- 13. India Clean Label Ingredients Market in Asia Pacific Analysis, Insights and Forecast, 2019-2031
- 14. South Korea Clean Label Ingredients Market in Asia Pacific Analysis, Insights and Forecast, 2019-2031
- 15. Taiwan Clean Label Ingredients Market in Asia Pacific Analysis, Insights and Forecast, 2019-2031
- 16. Australia Clean Label Ingredients Market in Asia Pacific Analysis, Insights and Forecast, 2019-2031
- 17. Rest of Asia-Pacific Clean Label Ingredients Market in Asia Pacific Analysis, Insights and Forecast, 2019-2031
- 18. Competitive Analysis
- 18.1. Global Market Share Analysis 2024
- 18.2. Company Profiles
- 18.2.1 Firmenich SA
- 18.2.1.1. Overview
- 18.2.1.2. Products
- 18.2.1.3. SWOT Analysis
- 18.2.1.4. Recent Developments
- 18.2.1.5. Financials (Based on Availability)
- 18.2.2 DDW Inc
- 18.2.2.1. Overview
- 18.2.2.2. Products
- 18.2.2.3. SWOT Analysis
- 18.2.2.4. Recent Developments
- 18.2.2.5. Financials (Based on Availability)
- 18.2.3 Givaudan
- 18.2.3.1. Overview
- 18.2.3.2. Products
- 18.2.3.3. SWOT Analysis
- 18.2.3.4. Recent Developments
- 18.2.3.5. Financials (Based on Availability)
- 18.2.4 Kerry Inc
- 18.2.4.1. Overview
- 18.2.4.2. Products
- 18.2.4.3. SWOT Analysis
- 18.2.4.4. Recent Developments
- 18.2.4.5. Financials (Based on Availability)
- 18.2.5 Cargill Incorporated*List Not Exhaustive
- 18.2.5.1. Overview
- 18.2.5.2. Products
- 18.2.5.3. SWOT Analysis
- 18.2.5.4. Recent Developments
- 18.2.5.5. Financials (Based on Availability)
- 18.2.6 Chr Hansen Holding A/S
- 18.2.6.1. Overview
- 18.2.6.2. Products
- 18.2.6.3. SWOT Analysis
- 18.2.6.4. Recent Developments
- 18.2.6.5. Financials (Based on Availability)
- 18.2.7 Sensient Technologies Corporation
- 18.2.7.1. Overview
- 18.2.7.2. Products
- 18.2.7.3. SWOT Analysis
- 18.2.7.4. Recent Developments
- 18.2.7.5. Financials (Based on Availability)
- 18.2.8 DohlerGroup
- 18.2.8.1. Overview
- 18.2.8.2. Products
- 18.2.8.3. SWOT Analysis
- 18.2.8.4. Recent Developments
- 18.2.8.5. Financials (Based on Availability)
- 18.2.1 Firmenich SA
List of Figures
- Figure 1: Global Clean Label Ingredients Market in Asia Pacific Revenue Breakdown (Million, %) by Region 2024 & 2032
- Figure 2: Asia Pacific Clean Label Ingredients Market in Asia Pacific Revenue (Million), by Country 2024 & 2032
- Figure 3: Asia Pacific Clean Label Ingredients Market in Asia Pacific Revenue Share (%), by Country 2024 & 2032
- Figure 4: North America Clean Label Ingredients Market in Asia Pacific Revenue (Million), by Ingredient Type 2024 & 2032
- Figure 5: North America Clean Label Ingredients Market in Asia Pacific Revenue Share (%), by Ingredient Type 2024 & 2032
- Figure 6: North America Clean Label Ingredients Market in Asia Pacific Revenue (Million), by Application 2024 & 2032
- Figure 7: North America Clean Label Ingredients Market in Asia Pacific Revenue Share (%), by Application 2024 & 2032
- Figure 8: North America Clean Label Ingredients Market in Asia Pacific Revenue (Million), by Country 2024 & 2032
- Figure 9: North America Clean Label Ingredients Market in Asia Pacific Revenue Share (%), by Country 2024 & 2032
- Figure 10: South America Clean Label Ingredients Market in Asia Pacific Revenue (Million), by Ingredient Type 2024 & 2032
- Figure 11: South America Clean Label Ingredients Market in Asia Pacific Revenue Share (%), by Ingredient Type 2024 & 2032
- Figure 12: South America Clean Label Ingredients Market in Asia Pacific Revenue (Million), by Application 2024 & 2032
- Figure 13: South America Clean Label Ingredients Market in Asia Pacific Revenue Share (%), by Application 2024 & 2032
- Figure 14: South America Clean Label Ingredients Market in Asia Pacific Revenue (Million), by Country 2024 & 2032
- Figure 15: South America Clean Label Ingredients Market in Asia Pacific Revenue Share (%), by Country 2024 & 2032
- Figure 16: Europe Clean Label Ingredients Market in Asia Pacific Revenue (Million), by Ingredient Type 2024 & 2032
- Figure 17: Europe Clean Label Ingredients Market in Asia Pacific Revenue Share (%), by Ingredient Type 2024 & 2032
- Figure 18: Europe Clean Label Ingredients Market in Asia Pacific Revenue (Million), by Application 2024 & 2032
- Figure 19: Europe Clean Label Ingredients Market in Asia Pacific Revenue Share (%), by Application 2024 & 2032
- Figure 20: Europe Clean Label Ingredients Market in Asia Pacific Revenue (Million), by Country 2024 & 2032
- Figure 21: Europe Clean Label Ingredients Market in Asia Pacific Revenue Share (%), by Country 2024 & 2032
- Figure 22: Middle East & Africa Clean Label Ingredients Market in Asia Pacific Revenue (Million), by Ingredient Type 2024 & 2032
- Figure 23: Middle East & Africa Clean Label Ingredients Market in Asia Pacific Revenue Share (%), by Ingredient Type 2024 & 2032
- Figure 24: Middle East & Africa Clean Label Ingredients Market in Asia Pacific Revenue (Million), by Application 2024 & 2032
- Figure 25: Middle East & Africa Clean Label Ingredients Market in Asia Pacific Revenue Share (%), by Application 2024 & 2032
- Figure 26: Middle East & Africa Clean Label Ingredients Market in Asia Pacific Revenue (Million), by Country 2024 & 2032
- Figure 27: Middle East & Africa Clean Label Ingredients Market in Asia Pacific Revenue Share (%), by Country 2024 & 2032
- Figure 28: Asia Pacific Clean Label Ingredients Market in Asia Pacific Revenue (Million), by Ingredient Type 2024 & 2032
- Figure 29: Asia Pacific Clean Label Ingredients Market in Asia Pacific Revenue Share (%), by Ingredient Type 2024 & 2032
- Figure 30: Asia Pacific Clean Label Ingredients Market in Asia Pacific Revenue (Million), by Application 2024 & 2032
- Figure 31: Asia Pacific Clean Label Ingredients Market in Asia Pacific Revenue Share (%), by Application 2024 & 2032
- Figure 32: Asia Pacific Clean Label Ingredients Market in Asia Pacific Revenue (Million), by Country 2024 & 2032
- Figure 33: Asia Pacific Clean Label Ingredients Market in Asia Pacific Revenue Share (%), by Country 2024 & 2032
List of Tables
- Table 1: Global Clean Label Ingredients Market in Asia Pacific Revenue Million Forecast, by Region 2019 & 2032
- Table 2: Global Clean Label Ingredients Market in Asia Pacific Revenue Million Forecast, by Ingredient Type 2019 & 2032
- Table 3: Global Clean Label Ingredients Market in Asia Pacific Revenue Million Forecast, by Application 2019 & 2032
- Table 4: Global Clean Label Ingredients Market in Asia Pacific Revenue Million Forecast, by Region 2019 & 2032
- Table 5: Global Clean Label Ingredients Market in Asia Pacific Revenue Million Forecast, by Country 2019 & 2032
- Table 6: China Clean Label Ingredients Market in Asia Pacific Revenue (Million) Forecast, by Application 2019 & 2032
- Table 7: Japan Clean Label Ingredients Market in Asia Pacific Revenue (Million) Forecast, by Application 2019 & 2032
- Table 8: India Clean Label Ingredients Market in Asia Pacific Revenue (Million) Forecast, by Application 2019 & 2032
- Table 9: South Korea Clean Label Ingredients Market in Asia Pacific Revenue (Million) Forecast, by Application 2019 & 2032
- Table 10: Taiwan Clean Label Ingredients Market in Asia Pacific Revenue (Million) Forecast, by Application 2019 & 2032
- Table 11: Australia Clean Label Ingredients Market in Asia Pacific Revenue (Million) Forecast, by Application 2019 & 2032
- Table 12: Rest of Asia-Pacific Clean Label Ingredients Market in Asia Pacific Revenue (Million) Forecast, by Application 2019 & 2032
- Table 13: Global Clean Label Ingredients Market in Asia Pacific Revenue Million Forecast, by Ingredient Type 2019 & 2032
- Table 14: Global Clean Label Ingredients Market in Asia Pacific Revenue Million Forecast, by Application 2019 & 2032
- Table 15: Global Clean Label Ingredients Market in Asia Pacific Revenue Million Forecast, by Country 2019 & 2032
- Table 16: United States Clean Label Ingredients Market in Asia Pacific Revenue (Million) Forecast, by Application 2019 & 2032
- Table 17: Canada Clean Label Ingredients Market in Asia Pacific Revenue (Million) Forecast, by Application 2019 & 2032
- Table 18: Mexico Clean Label Ingredients Market in Asia Pacific Revenue (Million) Forecast, by Application 2019 & 2032
- Table 19: Global Clean Label Ingredients Market in Asia Pacific Revenue Million Forecast, by Ingredient Type 2019 & 2032
- Table 20: Global Clean Label Ingredients Market in Asia Pacific Revenue Million Forecast, by Application 2019 & 2032
- Table 21: Global Clean Label Ingredients Market in Asia Pacific Revenue Million Forecast, by Country 2019 & 2032
- Table 22: Brazil Clean Label Ingredients Market in Asia Pacific Revenue (Million) Forecast, by Application 2019 & 2032
- Table 23: Argentina Clean Label Ingredients Market in Asia Pacific Revenue (Million) Forecast, by Application 2019 & 2032
- Table 24: Rest of South America Clean Label Ingredients Market in Asia Pacific Revenue (Million) Forecast, by Application 2019 & 2032
- Table 25: Global Clean Label Ingredients Market in Asia Pacific Revenue Million Forecast, by Ingredient Type 2019 & 2032
- Table 26: Global Clean Label Ingredients Market in Asia Pacific Revenue Million Forecast, by Application 2019 & 2032
- Table 27: Global Clean Label Ingredients Market in Asia Pacific Revenue Million Forecast, by Country 2019 & 2032
- Table 28: United Kingdom Clean Label Ingredients Market in Asia Pacific Revenue (Million) Forecast, by Application 2019 & 2032
- Table 29: Germany Clean Label Ingredients Market in Asia Pacific Revenue (Million) Forecast, by Application 2019 & 2032
- Table 30: France Clean Label Ingredients Market in Asia Pacific Revenue (Million) Forecast, by Application 2019 & 2032
- Table 31: Italy Clean Label Ingredients Market in Asia Pacific Revenue (Million) Forecast, by Application 2019 & 2032
- Table 32: Spain Clean Label Ingredients Market in Asia Pacific Revenue (Million) Forecast, by Application 2019 & 2032
- Table 33: Russia Clean Label Ingredients Market in Asia Pacific Revenue (Million) Forecast, by Application 2019 & 2032
- Table 34: Benelux Clean Label Ingredients Market in Asia Pacific Revenue (Million) Forecast, by Application 2019 & 2032
- Table 35: Nordics Clean Label Ingredients Market in Asia Pacific Revenue (Million) Forecast, by Application 2019 & 2032
- Table 36: Rest of Europe Clean Label Ingredients Market in Asia Pacific Revenue (Million) Forecast, by Application 2019 & 2032
- Table 37: Global Clean Label Ingredients Market in Asia Pacific Revenue Million Forecast, by Ingredient Type 2019 & 2032
- Table 38: Global Clean Label Ingredients Market in Asia Pacific Revenue Million Forecast, by Application 2019 & 2032
- Table 39: Global Clean Label Ingredients Market in Asia Pacific Revenue Million Forecast, by Country 2019 & 2032
- Table 40: Turkey Clean Label Ingredients Market in Asia Pacific Revenue (Million) Forecast, by Application 2019 & 2032
- Table 41: Israel Clean Label Ingredients Market in Asia Pacific Revenue (Million) Forecast, by Application 2019 & 2032
- Table 42: GCC Clean Label Ingredients Market in Asia Pacific Revenue (Million) Forecast, by Application 2019 & 2032
- Table 43: North Africa Clean Label Ingredients Market in Asia Pacific Revenue (Million) Forecast, by Application 2019 & 2032
- Table 44: South Africa Clean Label Ingredients Market in Asia Pacific Revenue (Million) Forecast, by Application 2019 & 2032
- Table 45: Rest of Middle East & Africa Clean Label Ingredients Market in Asia Pacific Revenue (Million) Forecast, by Application 2019 & 2032
- Table 46: Global Clean Label Ingredients Market in Asia Pacific Revenue Million Forecast, by Ingredient Type 2019 & 2032
- Table 47: Global Clean Label Ingredients Market in Asia Pacific Revenue Million Forecast, by Application 2019 & 2032
- Table 48: Global Clean Label Ingredients Market in Asia Pacific Revenue Million Forecast, by Country 2019 & 2032
- Table 49: China Clean Label Ingredients Market in Asia Pacific Revenue (Million) Forecast, by Application 2019 & 2032
- Table 50: India Clean Label Ingredients Market in Asia Pacific Revenue (Million) Forecast, by Application 2019 & 2032
- Table 51: Japan Clean Label Ingredients Market in Asia Pacific Revenue (Million) Forecast, by Application 2019 & 2032
- Table 52: South Korea Clean Label Ingredients Market in Asia Pacific Revenue (Million) Forecast, by Application 2019 & 2032
- Table 53: ASEAN Clean Label Ingredients Market in Asia Pacific Revenue (Million) Forecast, by Application 2019 & 2032
- Table 54: Oceania Clean Label Ingredients Market in Asia Pacific Revenue (Million) Forecast, by Application 2019 & 2032
- Table 55: Rest of Asia Pacific Clean Label Ingredients Market in Asia Pacific Revenue (Million) Forecast, by Application 2019 & 2032
Frequently Asked Questions
1. What is the projected Compound Annual Growth Rate (CAGR) of the Clean Label Ingredients Market in Asia Pacific?
The projected CAGR is approximately 7.11%.
2. Which companies are prominent players in the Clean Label Ingredients Market in Asia Pacific?
Key companies in the market include Firmenich SA, DDW Inc, Givaudan, Kerry Inc, Cargill Incorporated*List Not Exhaustive, Chr Hansen Holding A/S, Sensient Technologies Corporation, DohlerGroup.
3. What are the main segments of the Clean Label Ingredients Market in Asia Pacific?
The market segments include Ingredient Type, Application.
4. Can you provide details about the market size?
The market size is estimated to be USD XX Million as of 2022.
5. What are some drivers contributing to market growth?
Rising Health Consciousness among consumer.
6. What are the notable trends driving market growth?
Consumer Preference Toward Natural Food Ingredients.
7. Are there any restraints impacting market growth?
High Cost of natural Ingredients.
8. Can you provide examples of recent developments in the market?
N/A
9. What pricing options are available for accessing the report?
Pricing options include single-user, multi-user, and enterprise licenses priced at USD 4750, USD 5250, and USD 8750 respectively.
10. Is the market size provided in terms of value or volume?
The market size is provided in terms of value, measured in Million.
11. Are there any specific market keywords associated with the report?
Yes, the market keyword associated with the report is "Clean Label Ingredients Market in Asia Pacific," which aids in identifying and referencing the specific market segment covered.
12. How do I determine which pricing option suits my needs best?
The pricing options vary based on user requirements and access needs. Individual users may opt for single-user licenses, while businesses requiring broader access may choose multi-user or enterprise licenses for cost-effective access to the report.
13. Are there any additional resources or data provided in the Clean Label Ingredients Market in Asia Pacific report?
While the report offers comprehensive insights, it's advisable to review the specific contents or supplementary materials provided to ascertain if additional resources or data are available.
14. How can I stay updated on further developments or reports in the Clean Label Ingredients Market in Asia Pacific?
To stay informed about further developments, trends, and reports in the Clean Label Ingredients Market in Asia Pacific, consider subscribing to industry newsletters, following relevant companies and organizations, or regularly checking reputable industry news sources and publications.
Methodology
Step 1 - Identification of Relevant Samples Size from Population Database


Step 2 - Approaches for Defining Global Market Size (Value, Volume* & Price*)

Note*: In applicable scenarios
Step 3 - Data Sources
Primary Research
- Web Analytics
- Survey Reports
- Research Institute
- Latest Research Reports
- Opinion Leaders
Secondary Research
- Annual Reports
- White Paper
- Latest Press Release
- Industry Association
- Paid Database
- Investor Presentations

Step 4 - Data Triangulation
Involves using different sources of information in order to increase the validity of a study
These sources are likely to be stakeholders in a program - participants, other researchers, program staff, other community members, and so on.
Then we put all data in single framework & apply various statistical tools to find out the dynamic on the market.
During the analysis stage, feedback from the stakeholder groups would be compared to determine areas of agreement as well as areas of divergence


