
Key Insights
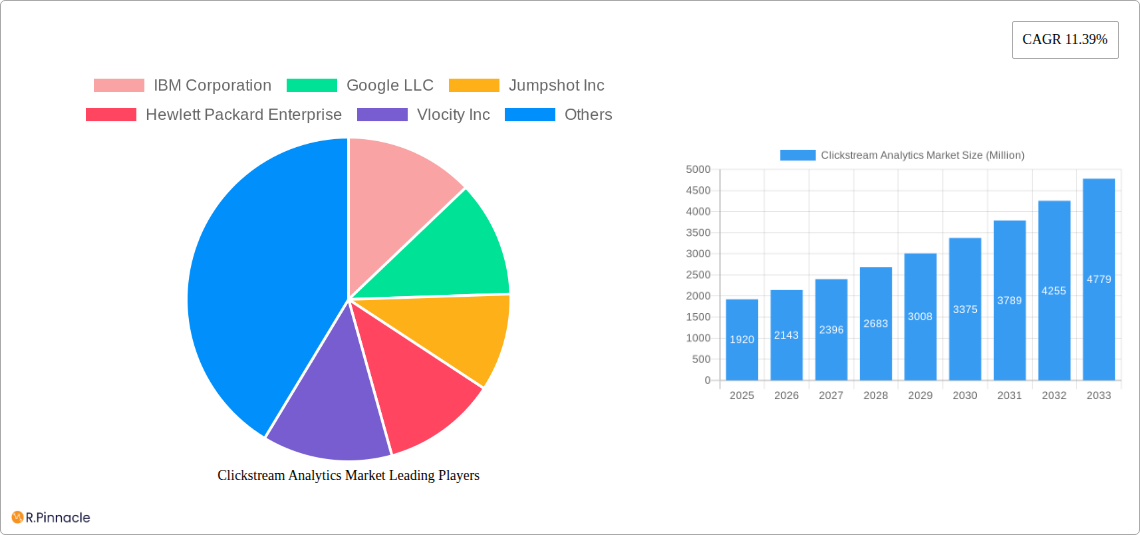
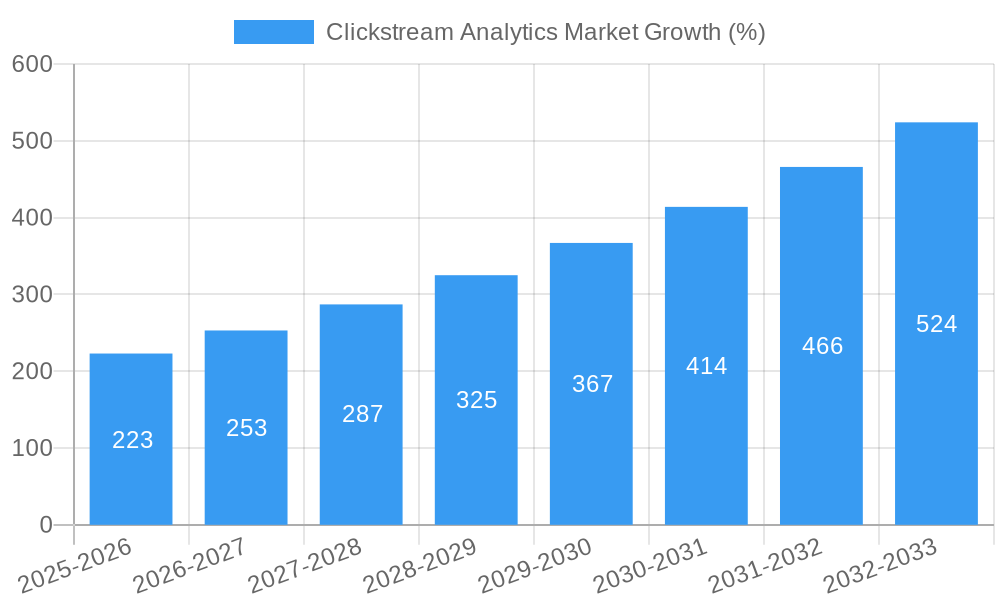
The global Clickstream Analytics market, valued at $1.92 billion in 2025, is projected to experience robust growth, exhibiting a Compound Annual Growth Rate (CAGR) of 11.39% from 2025 to 2033. This expansion is fueled by several key drivers. The increasing adoption of digital technologies across various sectors, including retail, media & entertainment, and telecom & IT, creates a massive volume of user data. Clickstream analytics provides crucial insights into user behavior, enabling businesses to optimize their websites, applications, and marketing strategies for enhanced conversion rates and customer satisfaction. Furthermore, the growing demand for personalized customer experiences is pushing companies to invest in sophisticated analytics solutions capable of extracting meaningful patterns from complex clickstream data. The market is segmented by end-user industry, offering (software and services), and application (click path optimization, website/application optimization, and customer analysis). North America currently holds a significant market share, driven by early adoption of advanced analytics technologies and the presence of major technology companies. However, the Asia-Pacific region is expected to witness rapid growth in the coming years due to increasing internet penetration and digital transformation initiatives. Competition is intense, with established players like IBM, Google, and Microsoft vying for market share alongside specialized analytics firms. Challenges include data security concerns, the complexity of implementing and interpreting clickstream data, and the need for skilled professionals to manage these systems effectively.
The forecast period (2025-2033) anticipates sustained market growth, driven by ongoing digital transformation and the expanding adoption of cloud-based analytics solutions. The increasing focus on data-driven decision-making across various industries will continue to fuel demand for clickstream analytics. The evolution towards more sophisticated AI and machine learning-powered analytics solutions promises further improvements in accuracy and efficiency, unlocking deeper insights from clickstream data. While challenges related to data privacy and security remain, the market is expected to find solutions through regulatory compliance and advancements in data anonymization technologies. The competitive landscape will continue to evolve, with mergers, acquisitions, and the emergence of innovative solutions shaping the market's dynamics. The focus will remain on delivering cost-effective, scalable, and insightful clickstream analytics solutions that cater to the evolving needs of businesses across various industries and geographies.
Clickstream Analytics Market: A Comprehensive Report (2019-2033)
This in-depth report provides a comprehensive analysis of the Clickstream Analytics Market, offering invaluable insights for industry professionals, investors, and strategists. Covering the period from 2019 to 2033, with a focus on 2025, this report meticulously examines market dynamics, key players, emerging trends, and future growth prospects. The market is projected to reach xx Million by 2033, exhibiting a significant CAGR.
Clickstream Analytics Market Structure & Innovation Trends
This section analyzes the competitive landscape of the Clickstream Analytics Market, encompassing market concentration, innovation drivers, regulatory influences, and merger & acquisition (M&A) activities. The market exhibits a moderately concentrated structure, with key players such as IBM, Google, and Adobe holding significant market share. However, several smaller, specialized firms contribute to the overall market dynamism.
- Market Concentration: The top 5 players account for approximately xx% of the global market share in 2025.
- Innovation Drivers: Advancements in AI, machine learning, and big data analytics are driving innovation, enabling more sophisticated clickstream analysis and actionable insights. The increasing demand for personalized customer experiences fuels further development.
- Regulatory Frameworks: Data privacy regulations like GDPR and CCPA significantly impact the market, requiring companies to adopt compliant data collection and analysis practices.
- Product Substitutes: While clickstream analytics offers unique capabilities, alternative methods like surveys and focus groups provide some level of substitutability, though with limitations in terms of scale and real-time insights.
- End-User Demographics: Businesses across various sectors, particularly Retail, Media & Entertainment, and Telecom & IT, are increasingly adopting clickstream analytics for improved customer understanding and business optimization.
- M&A Activities: The market has witnessed several M&A activities in recent years, with deal values ranging from xx Million to xx Million. These activities demonstrate the increasing strategic importance of clickstream analytics and the consolidation within the market.
Clickstream Analytics Market Dynamics & Trends
The Clickstream Analytics Market is experiencing robust growth driven by several factors. The rising adoption of e-commerce, the increasing availability of vast amounts of digital data, and the growing need for personalized customer experiences are key drivers. Technological advancements, particularly in AI and machine learning, are revolutionizing the capabilities of clickstream analytics, enabling more sophisticated analysis and actionable insights. Competitive dynamics are intense, with established players facing challenges from agile startups offering innovative solutions. The market penetration rate is projected to reach xx% by 2033, indicating substantial future growth potential. The CAGR for the forecast period (2025-2033) is estimated to be xx%.
Dominant Regions & Segments in Clickstream Analytics Market
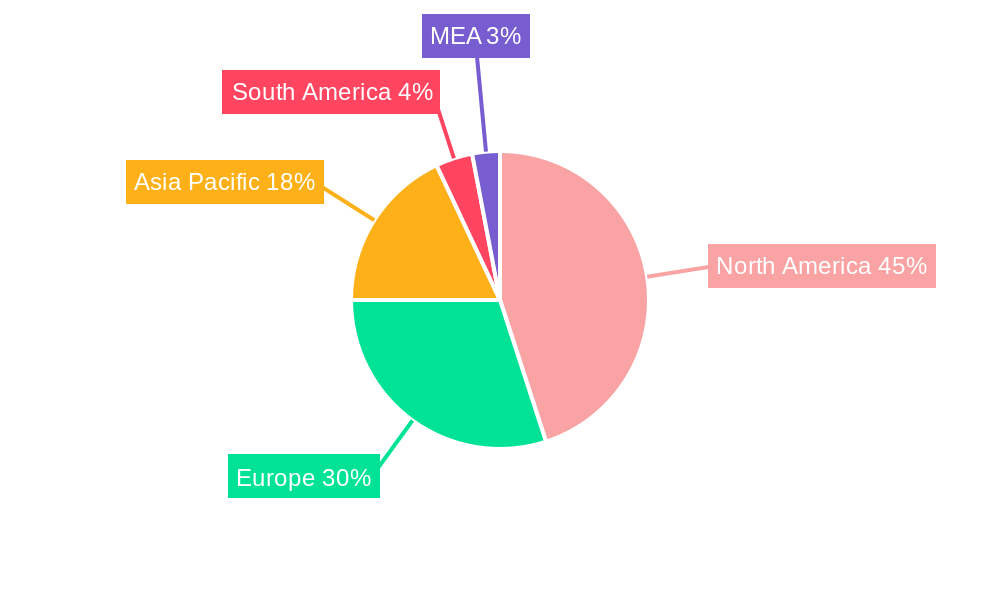
North America currently dominates the Clickstream Analytics Market, followed by Europe and Asia-Pacific. This dominance is attributed to factors such as robust digital infrastructure, high internet penetration, and a strong focus on data-driven decision-making.
Key Drivers:
- North America: Advanced technological infrastructure, high digital adoption, and established data analytics ecosystem.
- Europe: Stringent data privacy regulations driving demand for compliant solutions, coupled with a high concentration of digital businesses.
- Asia-Pacific: Rapid growth of e-commerce and digital services, coupled with increasing investment in digital infrastructure.
Dominant Segments:
- By End-user Industry: Retail consistently represents the largest segment due to the high reliance on online channels and the need for personalized marketing.
- By Offering: The software segment holds the largest share, due to the increasing preference for readily available and scalable solutions.
- By Application: Website/Application Optimization is the leading application area, with businesses focusing on enhancing user experience and conversion rates.
Detailed Dominance Analysis: The retail sector's dominance is driven by the need to optimize online shopping experiences, personalize marketing campaigns, and enhance conversion rates. The software segment's leading position is attributed to the increasing preference for flexible and scalable solutions. Website/Application Optimization leads in application due to the direct impact on customer engagement and business outcomes.
Clickstream Analytics Market Product Innovations
Recent product innovations focus on integrating AI/ML for predictive analytics, enhanced data visualization tools for improved insights, and cloud-based solutions for scalability and accessibility. These developments enable businesses to derive more actionable insights from clickstream data, leading to better customer experiences and improved business outcomes. The market is witnessing a trend towards real-time analytics, allowing businesses to respond swiftly to customer behavior.
Report Scope & Segmentation Analysis
This report segments the Clickstream Analytics Market by end-user industry (Retail, Media & Entertainment, Telecom & IT, BFSI, Transport & Logistics, Energy & Utilities), offering (Software, Services), and application (Click Path Optimization, Website/Application Optimization, Customer Analysis). Each segment's market size, growth projections, and competitive dynamics are analyzed in detail. For instance, the Retail segment is projected to grow at a CAGR of xx% during the forecast period, driven by the increasing adoption of e-commerce.
Key Drivers of Clickstream Analytics Market Growth
The market is driven by the growing need for data-driven decision-making, the rise of e-commerce and digital marketing, and the increasing adoption of cloud-based analytics solutions. Technological advancements in AI and machine learning further enhance the capabilities of clickstream analytics, enabling businesses to extract more valuable insights from their data. Government initiatives promoting digital transformation also contribute to market growth.
Challenges in the Clickstream Analytics Market Sector
Challenges include the complexity of data integration, concerns about data privacy and security, and the high cost of implementation for some businesses. The need for skilled professionals to interpret and utilize the data effectively also presents a challenge. Competitive pressures from established and emerging players create further challenges. These factors, though significant, are not projected to impede the overall market growth significantly.
Emerging Opportunities in Clickstream Analytics Market
Emerging opportunities lie in the integration of clickstream data with other data sources for a holistic view of customer behavior. The application of clickstream analytics in new industries like healthcare and education presents significant potential. The development of advanced analytical techniques, such as predictive modeling and sentiment analysis, unlocks new possibilities.
Leading Players in the Clickstream Analytics Market Market
- IBM Corporation
- Google LLC
- Jumpshot Inc
- Hewlett Packard Enterprise
- Vlocity Inc
- Microsoft Corporation
- Adobe Systems Incorporated
- WebTrends Corporation
- Oracle Corporation
- Verto Analytics Inc
- Connexity inc
- Splunk Inc
- Talend Inc
- SAP SE
Key Developments in Clickstream Analytics Market Industry
- August 2023: SAP and Google Cloud announced a collaboration expanding their open data offering, simplifying data landscapes and enabling real-time data estate views. This significantly impacts market dynamics by enhancing data accessibility and usability for businesses.
- August 2023: HPE's investment in Arcion's real-time data replication platform boosts the capabilities of AI applications by providing real-time access to enterprise databases. This accelerates the adoption of AI-powered clickstream analytics solutions.
Future Outlook for Clickstream Analytics Market Market
The Clickstream Analytics Market is poised for continued growth, driven by technological advancements, increasing data volumes, and the growing need for personalized customer experiences. Strategic partnerships, investments in R&D, and the expansion into new applications and industries will further fuel market expansion. The focus on data privacy and security will also shape future market developments.
Clickstream Analytics Market Segmentation
-
1. Offering
- 1.1. Software
- 1.2. Services
-
2. Application
- 2.1. Click Path Optimization
- 2.2. Website/Application Optimization
- 2.3. Customer Analysis
-
3. End-user Industry
- 3.1. Retail
- 3.2. Media & Entertainment
- 3.3. Telecom & IT
- 3.4. BFSI
- 3.5. Transport & Logistics
- 3.6. Energy & Utilities
Clickstream Analytics Market Segmentation By Geography
- 1. North America
- 2. Europe
- 3. Asia
- 4. Australia and New Zealand
- 5. Latin America
- 6. Middle East and Africa
Clickstream Analytics Market REPORT HIGHLIGHTS
| Aspects | Details |
|---|---|
| Study Period | 2019-2033 |
| Base Year | 2024 |
| Estimated Year | 2025 |
| Forecast Period | 2025-2033 |
| Historical Period | 2019-2024 |
| Growth Rate | CAGR of 11.39% from 2019-2033 |
| Segmentation |
|
Table of Contents
- 1. Introduction
- 1.1. Research Scope
- 1.2. Market Segmentation
- 1.3. Research Methodology
- 1.4. Definitions and Assumptions
- 2. Executive Summary
- 2.1. Introduction
- 3. Market Dynamics
- 3.1. Introduction
- 3.2. Market Drivers
- 3.2.1. Rapid Adoption of Mobile Technology Providing Multiple Digital Touchpoints is Encouraging the Market Growth
- 3.3. Market Restrains
- 3.3.1. Data Privacy Laws are Limiting the Market Growth
- 3.4. Market Trends
- 3.4.1. The Retail Industry will Dominate the Market
- 4. Market Factor Analysis
- 4.1. Porters Five Forces
- 4.2. Supply/Value Chain
- 4.3. PESTEL analysis
- 4.4. Market Entropy
- 4.5. Patent/Trademark Analysis
- 5. Global Clickstream Analytics Market Analysis, Insights and Forecast, 2019-2031
- 5.1. Market Analysis, Insights and Forecast - by Offering
- 5.1.1. Software
- 5.1.2. Services
- 5.2. Market Analysis, Insights and Forecast - by Application
- 5.2.1. Click Path Optimization
- 5.2.2. Website/Application Optimization
- 5.2.3. Customer Analysis
- 5.3. Market Analysis, Insights and Forecast - by End-user Industry
- 5.3.1. Retail
- 5.3.2. Media & Entertainment
- 5.3.3. Telecom & IT
- 5.3.4. BFSI
- 5.3.5. Transport & Logistics
- 5.3.6. Energy & Utilities
- 5.4. Market Analysis, Insights and Forecast - by Region
- 5.4.1. North America
- 5.4.2. Europe
- 5.4.3. Asia
- 5.4.4. Australia and New Zealand
- 5.4.5. Latin America
- 5.4.6. Middle East and Africa
- 5.1. Market Analysis, Insights and Forecast - by Offering
- 6. North America Clickstream Analytics Market Analysis, Insights and Forecast, 2019-2031
- 6.1. Market Analysis, Insights and Forecast - by Offering
- 6.1.1. Software
- 6.1.2. Services
- 6.2. Market Analysis, Insights and Forecast - by Application
- 6.2.1. Click Path Optimization
- 6.2.2. Website/Application Optimization
- 6.2.3. Customer Analysis
- 6.3. Market Analysis, Insights and Forecast - by End-user Industry
- 6.3.1. Retail
- 6.3.2. Media & Entertainment
- 6.3.3. Telecom & IT
- 6.3.4. BFSI
- 6.3.5. Transport & Logistics
- 6.3.6. Energy & Utilities
- 6.1. Market Analysis, Insights and Forecast - by Offering
- 7. Europe Clickstream Analytics Market Analysis, Insights and Forecast, 2019-2031
- 7.1. Market Analysis, Insights and Forecast - by Offering
- 7.1.1. Software
- 7.1.2. Services
- 7.2. Market Analysis, Insights and Forecast - by Application
- 7.2.1. Click Path Optimization
- 7.2.2. Website/Application Optimization
- 7.2.3. Customer Analysis
- 7.3. Market Analysis, Insights and Forecast - by End-user Industry
- 7.3.1. Retail
- 7.3.2. Media & Entertainment
- 7.3.3. Telecom & IT
- 7.3.4. BFSI
- 7.3.5. Transport & Logistics
- 7.3.6. Energy & Utilities
- 7.1. Market Analysis, Insights and Forecast - by Offering
- 8. Asia Clickstream Analytics Market Analysis, Insights and Forecast, 2019-2031
- 8.1. Market Analysis, Insights and Forecast - by Offering
- 8.1.1. Software
- 8.1.2. Services
- 8.2. Market Analysis, Insights and Forecast - by Application
- 8.2.1. Click Path Optimization
- 8.2.2. Website/Application Optimization
- 8.2.3. Customer Analysis
- 8.3. Market Analysis, Insights and Forecast - by End-user Industry
- 8.3.1. Retail
- 8.3.2. Media & Entertainment
- 8.3.3. Telecom & IT
- 8.3.4. BFSI
- 8.3.5. Transport & Logistics
- 8.3.6. Energy & Utilities
- 8.1. Market Analysis, Insights and Forecast - by Offering
- 9. Australia and New Zealand Clickstream Analytics Market Analysis, Insights and Forecast, 2019-2031
- 9.1. Market Analysis, Insights and Forecast - by Offering
- 9.1.1. Software
- 9.1.2. Services
- 9.2. Market Analysis, Insights and Forecast - by Application
- 9.2.1. Click Path Optimization
- 9.2.2. Website/Application Optimization
- 9.2.3. Customer Analysis
- 9.3. Market Analysis, Insights and Forecast - by End-user Industry
- 9.3.1. Retail
- 9.3.2. Media & Entertainment
- 9.3.3. Telecom & IT
- 9.3.4. BFSI
- 9.3.5. Transport & Logistics
- 9.3.6. Energy & Utilities
- 9.1. Market Analysis, Insights and Forecast - by Offering
- 10. Latin America Clickstream Analytics Market Analysis, Insights and Forecast, 2019-2031
- 10.1. Market Analysis, Insights and Forecast - by Offering
- 10.1.1. Software
- 10.1.2. Services
- 10.2. Market Analysis, Insights and Forecast - by Application
- 10.2.1. Click Path Optimization
- 10.2.2. Website/Application Optimization
- 10.2.3. Customer Analysis
- 10.3. Market Analysis, Insights and Forecast - by End-user Industry
- 10.3.1. Retail
- 10.3.2. Media & Entertainment
- 10.3.3. Telecom & IT
- 10.3.4. BFSI
- 10.3.5. Transport & Logistics
- 10.3.6. Energy & Utilities
- 10.1. Market Analysis, Insights and Forecast - by Offering
- 11. Middle East and Africa Clickstream Analytics Market Analysis, Insights and Forecast, 2019-2031
- 11.1. Market Analysis, Insights and Forecast - by Offering
- 11.1.1. Software
- 11.1.2. Services
- 11.2. Market Analysis, Insights and Forecast - by Application
- 11.2.1. Click Path Optimization
- 11.2.2. Website/Application Optimization
- 11.2.3. Customer Analysis
- 11.3. Market Analysis, Insights and Forecast - by End-user Industry
- 11.3.1. Retail
- 11.3.2. Media & Entertainment
- 11.3.3. Telecom & IT
- 11.3.4. BFSI
- 11.3.5. Transport & Logistics
- 11.3.6. Energy & Utilities
- 11.1. Market Analysis, Insights and Forecast - by Offering
- 12. North America Clickstream Analytics Market Analysis, Insights and Forecast, 2019-2031
- 12.1. Market Analysis, Insights and Forecast - By Country/Sub-region
- 12.1.1 United States
- 12.1.2 Canada
- 12.1.3 Mexico
- 13. Europe Clickstream Analytics Market Analysis, Insights and Forecast, 2019-2031
- 13.1. Market Analysis, Insights and Forecast - By Country/Sub-region
- 13.1.1 Germany
- 13.1.2 United Kingdom
- 13.1.3 France
- 13.1.4 Spain
- 13.1.5 Italy
- 13.1.6 Spain
- 13.1.7 Belgium
- 13.1.8 Netherland
- 13.1.9 Nordics
- 13.1.10 Rest of Europe
- 14. Asia Pacific Clickstream Analytics Market Analysis, Insights and Forecast, 2019-2031
- 14.1. Market Analysis, Insights and Forecast - By Country/Sub-region
- 14.1.1 China
- 14.1.2 Japan
- 14.1.3 India
- 14.1.4 South Korea
- 14.1.5 Southeast Asia
- 14.1.6 Australia
- 14.1.7 Indonesia
- 14.1.8 Phillipes
- 14.1.9 Singapore
- 14.1.10 Thailandc
- 14.1.11 Rest of Asia Pacific
- 15. South America Clickstream Analytics Market Analysis, Insights and Forecast, 2019-2031
- 15.1. Market Analysis, Insights and Forecast - By Country/Sub-region
- 15.1.1 Brazil
- 15.1.2 Argentina
- 15.1.3 Peru
- 15.1.4 Chile
- 15.1.5 Colombia
- 15.1.6 Ecuador
- 15.1.7 Venezuela
- 15.1.8 Rest of South America
- 16. North America Clickstream Analytics Market Analysis, Insights and Forecast, 2019-2031
- 16.1. Market Analysis, Insights and Forecast - By Country/Sub-region
- 16.1.1 United States
- 16.1.2 Canada
- 16.1.3 Mexico
- 17. MEA Clickstream Analytics Market Analysis, Insights and Forecast, 2019-2031
- 17.1. Market Analysis, Insights and Forecast - By Country/Sub-region
- 17.1.1 United Arab Emirates
- 17.1.2 Saudi Arabia
- 17.1.3 South Africa
- 17.1.4 Rest of Middle East and Africa
- 18. Competitive Analysis
- 18.1. Global Market Share Analysis 2024
- 18.2. Company Profiles
- 18.2.1 IBM Corporation
- 18.2.1.1. Overview
- 18.2.1.2. Products
- 18.2.1.3. SWOT Analysis
- 18.2.1.4. Recent Developments
- 18.2.1.5. Financials (Based on Availability)
- 18.2.2 Google LLC
- 18.2.2.1. Overview
- 18.2.2.2. Products
- 18.2.2.3. SWOT Analysis
- 18.2.2.4. Recent Developments
- 18.2.2.5. Financials (Based on Availability)
- 18.2.3 Jumpshot Inc
- 18.2.3.1. Overview
- 18.2.3.2. Products
- 18.2.3.3. SWOT Analysis
- 18.2.3.4. Recent Developments
- 18.2.3.5. Financials (Based on Availability)
- 18.2.4 Hewlett Packard Enterprise
- 18.2.4.1. Overview
- 18.2.4.2. Products
- 18.2.4.3. SWOT Analysis
- 18.2.4.4. Recent Developments
- 18.2.4.5. Financials (Based on Availability)
- 18.2.5 Vlocity Inc
- 18.2.5.1. Overview
- 18.2.5.2. Products
- 18.2.5.3. SWOT Analysis
- 18.2.5.4. Recent Developments
- 18.2.5.5. Financials (Based on Availability)
- 18.2.6 Microsoft Corporation
- 18.2.6.1. Overview
- 18.2.6.2. Products
- 18.2.6.3. SWOT Analysis
- 18.2.6.4. Recent Developments
- 18.2.6.5. Financials (Based on Availability)
- 18.2.7 Adobe Systems Incorporated
- 18.2.7.1. Overview
- 18.2.7.2. Products
- 18.2.7.3. SWOT Analysis
- 18.2.7.4. Recent Developments
- 18.2.7.5. Financials (Based on Availability)
- 18.2.8 WebTrends Corporation
- 18.2.8.1. Overview
- 18.2.8.2. Products
- 18.2.8.3. SWOT Analysis
- 18.2.8.4. Recent Developments
- 18.2.8.5. Financials (Based on Availability)
- 18.2.9 Oracle Corporation
- 18.2.9.1. Overview
- 18.2.9.2. Products
- 18.2.9.3. SWOT Analysis
- 18.2.9.4. Recent Developments
- 18.2.9.5. Financials (Based on Availability)
- 18.2.10 Verto Analytics Inc
- 18.2.10.1. Overview
- 18.2.10.2. Products
- 18.2.10.3. SWOT Analysis
- 18.2.10.4. Recent Developments
- 18.2.10.5. Financials (Based on Availability)
- 18.2.11 Connexity inc
- 18.2.11.1. Overview
- 18.2.11.2. Products
- 18.2.11.3. SWOT Analysis
- 18.2.11.4. Recent Developments
- 18.2.11.5. Financials (Based on Availability)
- 18.2.12 Splunk Inc
- 18.2.12.1. Overview
- 18.2.12.2. Products
- 18.2.12.3. SWOT Analysis
- 18.2.12.4. Recent Developments
- 18.2.12.5. Financials (Based on Availability)
- 18.2.13 Talend Inc
- 18.2.13.1. Overview
- 18.2.13.2. Products
- 18.2.13.3. SWOT Analysis
- 18.2.13.4. Recent Developments
- 18.2.13.5. Financials (Based on Availability)
- 18.2.14 SAP SE
- 18.2.14.1. Overview
- 18.2.14.2. Products
- 18.2.14.3. SWOT Analysis
- 18.2.14.4. Recent Developments
- 18.2.14.5. Financials (Based on Availability)
- 18.2.1 IBM Corporation
List of Figures
- Figure 1: Global Clickstream Analytics Market Revenue Breakdown (Million, %) by Region 2024 & 2032
- Figure 2: Global Clickstream Analytics Market Volume Breakdown (K Unit, %) by Region 2024 & 2032
- Figure 3: North America Clickstream Analytics Market Revenue (Million), by Country 2024 & 2032
- Figure 4: North America Clickstream Analytics Market Volume (K Unit), by Country 2024 & 2032
- Figure 5: North America Clickstream Analytics Market Revenue Share (%), by Country 2024 & 2032
- Figure 6: North America Clickstream Analytics Market Volume Share (%), by Country 2024 & 2032
- Figure 7: Europe Clickstream Analytics Market Revenue (Million), by Country 2024 & 2032
- Figure 8: Europe Clickstream Analytics Market Volume (K Unit), by Country 2024 & 2032
- Figure 9: Europe Clickstream Analytics Market Revenue Share (%), by Country 2024 & 2032
- Figure 10: Europe Clickstream Analytics Market Volume Share (%), by Country 2024 & 2032
- Figure 11: Asia Pacific Clickstream Analytics Market Revenue (Million), by Country 2024 & 2032
- Figure 12: Asia Pacific Clickstream Analytics Market Volume (K Unit), by Country 2024 & 2032
- Figure 13: Asia Pacific Clickstream Analytics Market Revenue Share (%), by Country 2024 & 2032
- Figure 14: Asia Pacific Clickstream Analytics Market Volume Share (%), by Country 2024 & 2032
- Figure 15: South America Clickstream Analytics Market Revenue (Million), by Country 2024 & 2032
- Figure 16: South America Clickstream Analytics Market Volume (K Unit), by Country 2024 & 2032
- Figure 17: South America Clickstream Analytics Market Revenue Share (%), by Country 2024 & 2032
- Figure 18: South America Clickstream Analytics Market Volume Share (%), by Country 2024 & 2032
- Figure 19: North America Clickstream Analytics Market Revenue (Million), by Country 2024 & 2032
- Figure 20: North America Clickstream Analytics Market Volume (K Unit), by Country 2024 & 2032
- Figure 21: North America Clickstream Analytics Market Revenue Share (%), by Country 2024 & 2032
- Figure 22: North America Clickstream Analytics Market Volume Share (%), by Country 2024 & 2032
- Figure 23: MEA Clickstream Analytics Market Revenue (Million), by Country 2024 & 2032
- Figure 24: MEA Clickstream Analytics Market Volume (K Unit), by Country 2024 & 2032
- Figure 25: MEA Clickstream Analytics Market Revenue Share (%), by Country 2024 & 2032
- Figure 26: MEA Clickstream Analytics Market Volume Share (%), by Country 2024 & 2032
- Figure 27: North America Clickstream Analytics Market Revenue (Million), by Offering 2024 & 2032
- Figure 28: North America Clickstream Analytics Market Volume (K Unit), by Offering 2024 & 2032
- Figure 29: North America Clickstream Analytics Market Revenue Share (%), by Offering 2024 & 2032
- Figure 30: North America Clickstream Analytics Market Volume Share (%), by Offering 2024 & 2032
- Figure 31: North America Clickstream Analytics Market Revenue (Million), by Application 2024 & 2032
- Figure 32: North America Clickstream Analytics Market Volume (K Unit), by Application 2024 & 2032
- Figure 33: North America Clickstream Analytics Market Revenue Share (%), by Application 2024 & 2032
- Figure 34: North America Clickstream Analytics Market Volume Share (%), by Application 2024 & 2032
- Figure 35: North America Clickstream Analytics Market Revenue (Million), by End-user Industry 2024 & 2032
- Figure 36: North America Clickstream Analytics Market Volume (K Unit), by End-user Industry 2024 & 2032
- Figure 37: North America Clickstream Analytics Market Revenue Share (%), by End-user Industry 2024 & 2032
- Figure 38: North America Clickstream Analytics Market Volume Share (%), by End-user Industry 2024 & 2032
- Figure 39: North America Clickstream Analytics Market Revenue (Million), by Country 2024 & 2032
- Figure 40: North America Clickstream Analytics Market Volume (K Unit), by Country 2024 & 2032
- Figure 41: North America Clickstream Analytics Market Revenue Share (%), by Country 2024 & 2032
- Figure 42: North America Clickstream Analytics Market Volume Share (%), by Country 2024 & 2032
- Figure 43: Europe Clickstream Analytics Market Revenue (Million), by Offering 2024 & 2032
- Figure 44: Europe Clickstream Analytics Market Volume (K Unit), by Offering 2024 & 2032
- Figure 45: Europe Clickstream Analytics Market Revenue Share (%), by Offering 2024 & 2032
- Figure 46: Europe Clickstream Analytics Market Volume Share (%), by Offering 2024 & 2032
- Figure 47: Europe Clickstream Analytics Market Revenue (Million), by Application 2024 & 2032
- Figure 48: Europe Clickstream Analytics Market Volume (K Unit), by Application 2024 & 2032
- Figure 49: Europe Clickstream Analytics Market Revenue Share (%), by Application 2024 & 2032
- Figure 50: Europe Clickstream Analytics Market Volume Share (%), by Application 2024 & 2032
- Figure 51: Europe Clickstream Analytics Market Revenue (Million), by End-user Industry 2024 & 2032
- Figure 52: Europe Clickstream Analytics Market Volume (K Unit), by End-user Industry 2024 & 2032
- Figure 53: Europe Clickstream Analytics Market Revenue Share (%), by End-user Industry 2024 & 2032
- Figure 54: Europe Clickstream Analytics Market Volume Share (%), by End-user Industry 2024 & 2032
- Figure 55: Europe Clickstream Analytics Market Revenue (Million), by Country 2024 & 2032
- Figure 56: Europe Clickstream Analytics Market Volume (K Unit), by Country 2024 & 2032
- Figure 57: Europe Clickstream Analytics Market Revenue Share (%), by Country 2024 & 2032
- Figure 58: Europe Clickstream Analytics Market Volume Share (%), by Country 2024 & 2032
- Figure 59: Asia Clickstream Analytics Market Revenue (Million), by Offering 2024 & 2032
- Figure 60: Asia Clickstream Analytics Market Volume (K Unit), by Offering 2024 & 2032
- Figure 61: Asia Clickstream Analytics Market Revenue Share (%), by Offering 2024 & 2032
- Figure 62: Asia Clickstream Analytics Market Volume Share (%), by Offering 2024 & 2032
- Figure 63: Asia Clickstream Analytics Market Revenue (Million), by Application 2024 & 2032
- Figure 64: Asia Clickstream Analytics Market Volume (K Unit), by Application 2024 & 2032
- Figure 65: Asia Clickstream Analytics Market Revenue Share (%), by Application 2024 & 2032
- Figure 66: Asia Clickstream Analytics Market Volume Share (%), by Application 2024 & 2032
- Figure 67: Asia Clickstream Analytics Market Revenue (Million), by End-user Industry 2024 & 2032
- Figure 68: Asia Clickstream Analytics Market Volume (K Unit), by End-user Industry 2024 & 2032
- Figure 69: Asia Clickstream Analytics Market Revenue Share (%), by End-user Industry 2024 & 2032
- Figure 70: Asia Clickstream Analytics Market Volume Share (%), by End-user Industry 2024 & 2032
- Figure 71: Asia Clickstream Analytics Market Revenue (Million), by Country 2024 & 2032
- Figure 72: Asia Clickstream Analytics Market Volume (K Unit), by Country 2024 & 2032
- Figure 73: Asia Clickstream Analytics Market Revenue Share (%), by Country 2024 & 2032
- Figure 74: Asia Clickstream Analytics Market Volume Share (%), by Country 2024 & 2032
- Figure 75: Australia and New Zealand Clickstream Analytics Market Revenue (Million), by Offering 2024 & 2032
- Figure 76: Australia and New Zealand Clickstream Analytics Market Volume (K Unit), by Offering 2024 & 2032
- Figure 77: Australia and New Zealand Clickstream Analytics Market Revenue Share (%), by Offering 2024 & 2032
- Figure 78: Australia and New Zealand Clickstream Analytics Market Volume Share (%), by Offering 2024 & 2032
- Figure 79: Australia and New Zealand Clickstream Analytics Market Revenue (Million), by Application 2024 & 2032
- Figure 80: Australia and New Zealand Clickstream Analytics Market Volume (K Unit), by Application 2024 & 2032
- Figure 81: Australia and New Zealand Clickstream Analytics Market Revenue Share (%), by Application 2024 & 2032
- Figure 82: Australia and New Zealand Clickstream Analytics Market Volume Share (%), by Application 2024 & 2032
- Figure 83: Australia and New Zealand Clickstream Analytics Market Revenue (Million), by End-user Industry 2024 & 2032
- Figure 84: Australia and New Zealand Clickstream Analytics Market Volume (K Unit), by End-user Industry 2024 & 2032
- Figure 85: Australia and New Zealand Clickstream Analytics Market Revenue Share (%), by End-user Industry 2024 & 2032
- Figure 86: Australia and New Zealand Clickstream Analytics Market Volume Share (%), by End-user Industry 2024 & 2032
- Figure 87: Australia and New Zealand Clickstream Analytics Market Revenue (Million), by Country 2024 & 2032
- Figure 88: Australia and New Zealand Clickstream Analytics Market Volume (K Unit), by Country 2024 & 2032
- Figure 89: Australia and New Zealand Clickstream Analytics Market Revenue Share (%), by Country 2024 & 2032
- Figure 90: Australia and New Zealand Clickstream Analytics Market Volume Share (%), by Country 2024 & 2032
- Figure 91: Latin America Clickstream Analytics Market Revenue (Million), by Offering 2024 & 2032
- Figure 92: Latin America Clickstream Analytics Market Volume (K Unit), by Offering 2024 & 2032
- Figure 93: Latin America Clickstream Analytics Market Revenue Share (%), by Offering 2024 & 2032
- Figure 94: Latin America Clickstream Analytics Market Volume Share (%), by Offering 2024 & 2032
- Figure 95: Latin America Clickstream Analytics Market Revenue (Million), by Application 2024 & 2032
- Figure 96: Latin America Clickstream Analytics Market Volume (K Unit), by Application 2024 & 2032
- Figure 97: Latin America Clickstream Analytics Market Revenue Share (%), by Application 2024 & 2032
- Figure 98: Latin America Clickstream Analytics Market Volume Share (%), by Application 2024 & 2032
- Figure 99: Latin America Clickstream Analytics Market Revenue (Million), by End-user Industry 2024 & 2032
- Figure 100: Latin America Clickstream Analytics Market Volume (K Unit), by End-user Industry 2024 & 2032
- Figure 101: Latin America Clickstream Analytics Market Revenue Share (%), by End-user Industry 2024 & 2032
- Figure 102: Latin America Clickstream Analytics Market Volume Share (%), by End-user Industry 2024 & 2032
- Figure 103: Latin America Clickstream Analytics Market Revenue (Million), by Country 2024 & 2032
- Figure 104: Latin America Clickstream Analytics Market Volume (K Unit), by Country 2024 & 2032
- Figure 105: Latin America Clickstream Analytics Market Revenue Share (%), by Country 2024 & 2032
- Figure 106: Latin America Clickstream Analytics Market Volume Share (%), by Country 2024 & 2032
- Figure 107: Middle East and Africa Clickstream Analytics Market Revenue (Million), by Offering 2024 & 2032
- Figure 108: Middle East and Africa Clickstream Analytics Market Volume (K Unit), by Offering 2024 & 2032
- Figure 109: Middle East and Africa Clickstream Analytics Market Revenue Share (%), by Offering 2024 & 2032
- Figure 110: Middle East and Africa Clickstream Analytics Market Volume Share (%), by Offering 2024 & 2032
- Figure 111: Middle East and Africa Clickstream Analytics Market Revenue (Million), by Application 2024 & 2032
- Figure 112: Middle East and Africa Clickstream Analytics Market Volume (K Unit), by Application 2024 & 2032
- Figure 113: Middle East and Africa Clickstream Analytics Market Revenue Share (%), by Application 2024 & 2032
- Figure 114: Middle East and Africa Clickstream Analytics Market Volume Share (%), by Application 2024 & 2032
- Figure 115: Middle East and Africa Clickstream Analytics Market Revenue (Million), by End-user Industry 2024 & 2032
- Figure 116: Middle East and Africa Clickstream Analytics Market Volume (K Unit), by End-user Industry 2024 & 2032
- Figure 117: Middle East and Africa Clickstream Analytics Market Revenue Share (%), by End-user Industry 2024 & 2032
- Figure 118: Middle East and Africa Clickstream Analytics Market Volume Share (%), by End-user Industry 2024 & 2032
- Figure 119: Middle East and Africa Clickstream Analytics Market Revenue (Million), by Country 2024 & 2032
- Figure 120: Middle East and Africa Clickstream Analytics Market Volume (K Unit), by Country 2024 & 2032
- Figure 121: Middle East and Africa Clickstream Analytics Market Revenue Share (%), by Country 2024 & 2032
- Figure 122: Middle East and Africa Clickstream Analytics Market Volume Share (%), by Country 2024 & 2032
List of Tables
- Table 1: Global Clickstream Analytics Market Revenue Million Forecast, by Region 2019 & 2032
- Table 2: Global Clickstream Analytics Market Volume K Unit Forecast, by Region 2019 & 2032
- Table 3: Global Clickstream Analytics Market Revenue Million Forecast, by Offering 2019 & 2032
- Table 4: Global Clickstream Analytics Market Volume K Unit Forecast, by Offering 2019 & 2032
- Table 5: Global Clickstream Analytics Market Revenue Million Forecast, by Application 2019 & 2032
- Table 6: Global Clickstream Analytics Market Volume K Unit Forecast, by Application 2019 & 2032
- Table 7: Global Clickstream Analytics Market Revenue Million Forecast, by End-user Industry 2019 & 2032
- Table 8: Global Clickstream Analytics Market Volume K Unit Forecast, by End-user Industry 2019 & 2032
- Table 9: Global Clickstream Analytics Market Revenue Million Forecast, by Region 2019 & 2032
- Table 10: Global Clickstream Analytics Market Volume K Unit Forecast, by Region 2019 & 2032
- Table 11: Global Clickstream Analytics Market Revenue Million Forecast, by Country 2019 & 2032
- Table 12: Global Clickstream Analytics Market Volume K Unit Forecast, by Country 2019 & 2032
- Table 13: United States Clickstream Analytics Market Revenue (Million) Forecast, by Application 2019 & 2032
- Table 14: United States Clickstream Analytics Market Volume (K Unit) Forecast, by Application 2019 & 2032
- Table 15: Canada Clickstream Analytics Market Revenue (Million) Forecast, by Application 2019 & 2032
- Table 16: Canada Clickstream Analytics Market Volume (K Unit) Forecast, by Application 2019 & 2032
- Table 17: Mexico Clickstream Analytics Market Revenue (Million) Forecast, by Application 2019 & 2032
- Table 18: Mexico Clickstream Analytics Market Volume (K Unit) Forecast, by Application 2019 & 2032
- Table 19: Global Clickstream Analytics Market Revenue Million Forecast, by Country 2019 & 2032
- Table 20: Global Clickstream Analytics Market Volume K Unit Forecast, by Country 2019 & 2032
- Table 21: Germany Clickstream Analytics Market Revenue (Million) Forecast, by Application 2019 & 2032
- Table 22: Germany Clickstream Analytics Market Volume (K Unit) Forecast, by Application 2019 & 2032
- Table 23: United Kingdom Clickstream Analytics Market Revenue (Million) Forecast, by Application 2019 & 2032
- Table 24: United Kingdom Clickstream Analytics Market Volume (K Unit) Forecast, by Application 2019 & 2032
- Table 25: France Clickstream Analytics Market Revenue (Million) Forecast, by Application 2019 & 2032
- Table 26: France Clickstream Analytics Market Volume (K Unit) Forecast, by Application 2019 & 2032
- Table 27: Spain Clickstream Analytics Market Revenue (Million) Forecast, by Application 2019 & 2032
- Table 28: Spain Clickstream Analytics Market Volume (K Unit) Forecast, by Application 2019 & 2032
- Table 29: Italy Clickstream Analytics Market Revenue (Million) Forecast, by Application 2019 & 2032
- Table 30: Italy Clickstream Analytics Market Volume (K Unit) Forecast, by Application 2019 & 2032
- Table 31: Spain Clickstream Analytics Market Revenue (Million) Forecast, by Application 2019 & 2032
- Table 32: Spain Clickstream Analytics Market Volume (K Unit) Forecast, by Application 2019 & 2032
- Table 33: Belgium Clickstream Analytics Market Revenue (Million) Forecast, by Application 2019 & 2032
- Table 34: Belgium Clickstream Analytics Market Volume (K Unit) Forecast, by Application 2019 & 2032
- Table 35: Netherland Clickstream Analytics Market Revenue (Million) Forecast, by Application 2019 & 2032
- Table 36: Netherland Clickstream Analytics Market Volume (K Unit) Forecast, by Application 2019 & 2032
- Table 37: Nordics Clickstream Analytics Market Revenue (Million) Forecast, by Application 2019 & 2032
- Table 38: Nordics Clickstream Analytics Market Volume (K Unit) Forecast, by Application 2019 & 2032
- Table 39: Rest of Europe Clickstream Analytics Market Revenue (Million) Forecast, by Application 2019 & 2032
- Table 40: Rest of Europe Clickstream Analytics Market Volume (K Unit) Forecast, by Application 2019 & 2032
- Table 41: Global Clickstream Analytics Market Revenue Million Forecast, by Country 2019 & 2032
- Table 42: Global Clickstream Analytics Market Volume K Unit Forecast, by Country 2019 & 2032
- Table 43: China Clickstream Analytics Market Revenue (Million) Forecast, by Application 2019 & 2032
- Table 44: China Clickstream Analytics Market Volume (K Unit) Forecast, by Application 2019 & 2032
- Table 45: Japan Clickstream Analytics Market Revenue (Million) Forecast, by Application 2019 & 2032
- Table 46: Japan Clickstream Analytics Market Volume (K Unit) Forecast, by Application 2019 & 2032
- Table 47: India Clickstream Analytics Market Revenue (Million) Forecast, by Application 2019 & 2032
- Table 48: India Clickstream Analytics Market Volume (K Unit) Forecast, by Application 2019 & 2032
- Table 49: South Korea Clickstream Analytics Market Revenue (Million) Forecast, by Application 2019 & 2032
- Table 50: South Korea Clickstream Analytics Market Volume (K Unit) Forecast, by Application 2019 & 2032
- Table 51: Southeast Asia Clickstream Analytics Market Revenue (Million) Forecast, by Application 2019 & 2032
- Table 52: Southeast Asia Clickstream Analytics Market Volume (K Unit) Forecast, by Application 2019 & 2032
- Table 53: Australia Clickstream Analytics Market Revenue (Million) Forecast, by Application 2019 & 2032
- Table 54: Australia Clickstream Analytics Market Volume (K Unit) Forecast, by Application 2019 & 2032
- Table 55: Indonesia Clickstream Analytics Market Revenue (Million) Forecast, by Application 2019 & 2032
- Table 56: Indonesia Clickstream Analytics Market Volume (K Unit) Forecast, by Application 2019 & 2032
- Table 57: Phillipes Clickstream Analytics Market Revenue (Million) Forecast, by Application 2019 & 2032
- Table 58: Phillipes Clickstream Analytics Market Volume (K Unit) Forecast, by Application 2019 & 2032
- Table 59: Singapore Clickstream Analytics Market Revenue (Million) Forecast, by Application 2019 & 2032
- Table 60: Singapore Clickstream Analytics Market Volume (K Unit) Forecast, by Application 2019 & 2032
- Table 61: Thailandc Clickstream Analytics Market Revenue (Million) Forecast, by Application 2019 & 2032
- Table 62: Thailandc Clickstream Analytics Market Volume (K Unit) Forecast, by Application 2019 & 2032
- Table 63: Rest of Asia Pacific Clickstream Analytics Market Revenue (Million) Forecast, by Application 2019 & 2032
- Table 64: Rest of Asia Pacific Clickstream Analytics Market Volume (K Unit) Forecast, by Application 2019 & 2032
- Table 65: Global Clickstream Analytics Market Revenue Million Forecast, by Country 2019 & 2032
- Table 66: Global Clickstream Analytics Market Volume K Unit Forecast, by Country 2019 & 2032
- Table 67: Brazil Clickstream Analytics Market Revenue (Million) Forecast, by Application 2019 & 2032
- Table 68: Brazil Clickstream Analytics Market Volume (K Unit) Forecast, by Application 2019 & 2032
- Table 69: Argentina Clickstream Analytics Market Revenue (Million) Forecast, by Application 2019 & 2032
- Table 70: Argentina Clickstream Analytics Market Volume (K Unit) Forecast, by Application 2019 & 2032
- Table 71: Peru Clickstream Analytics Market Revenue (Million) Forecast, by Application 2019 & 2032
- Table 72: Peru Clickstream Analytics Market Volume (K Unit) Forecast, by Application 2019 & 2032
- Table 73: Chile Clickstream Analytics Market Revenue (Million) Forecast, by Application 2019 & 2032
- Table 74: Chile Clickstream Analytics Market Volume (K Unit) Forecast, by Application 2019 & 2032
- Table 75: Colombia Clickstream Analytics Market Revenue (Million) Forecast, by Application 2019 & 2032
- Table 76: Colombia Clickstream Analytics Market Volume (K Unit) Forecast, by Application 2019 & 2032
- Table 77: Ecuador Clickstream Analytics Market Revenue (Million) Forecast, by Application 2019 & 2032
- Table 78: Ecuador Clickstream Analytics Market Volume (K Unit) Forecast, by Application 2019 & 2032
- Table 79: Venezuela Clickstream Analytics Market Revenue (Million) Forecast, by Application 2019 & 2032
- Table 80: Venezuela Clickstream Analytics Market Volume (K Unit) Forecast, by Application 2019 & 2032
- Table 81: Rest of South America Clickstream Analytics Market Revenue (Million) Forecast, by Application 2019 & 2032
- Table 82: Rest of South America Clickstream Analytics Market Volume (K Unit) Forecast, by Application 2019 & 2032
- Table 83: Global Clickstream Analytics Market Revenue Million Forecast, by Country 2019 & 2032
- Table 84: Global Clickstream Analytics Market Volume K Unit Forecast, by Country 2019 & 2032
- Table 85: United States Clickstream Analytics Market Revenue (Million) Forecast, by Application 2019 & 2032
- Table 86: United States Clickstream Analytics Market Volume (K Unit) Forecast, by Application 2019 & 2032
- Table 87: Canada Clickstream Analytics Market Revenue (Million) Forecast, by Application 2019 & 2032
- Table 88: Canada Clickstream Analytics Market Volume (K Unit) Forecast, by Application 2019 & 2032
- Table 89: Mexico Clickstream Analytics Market Revenue (Million) Forecast, by Application 2019 & 2032
- Table 90: Mexico Clickstream Analytics Market Volume (K Unit) Forecast, by Application 2019 & 2032
- Table 91: Global Clickstream Analytics Market Revenue Million Forecast, by Country 2019 & 2032
- Table 92: Global Clickstream Analytics Market Volume K Unit Forecast, by Country 2019 & 2032
- Table 93: United Arab Emirates Clickstream Analytics Market Revenue (Million) Forecast, by Application 2019 & 2032
- Table 94: United Arab Emirates Clickstream Analytics Market Volume (K Unit) Forecast, by Application 2019 & 2032
- Table 95: Saudi Arabia Clickstream Analytics Market Revenue (Million) Forecast, by Application 2019 & 2032
- Table 96: Saudi Arabia Clickstream Analytics Market Volume (K Unit) Forecast, by Application 2019 & 2032
- Table 97: South Africa Clickstream Analytics Market Revenue (Million) Forecast, by Application 2019 & 2032
- Table 98: South Africa Clickstream Analytics Market Volume (K Unit) Forecast, by Application 2019 & 2032
- Table 99: Rest of Middle East and Africa Clickstream Analytics Market Revenue (Million) Forecast, by Application 2019 & 2032
- Table 100: Rest of Middle East and Africa Clickstream Analytics Market Volume (K Unit) Forecast, by Application 2019 & 2032
- Table 101: Global Clickstream Analytics Market Revenue Million Forecast, by Offering 2019 & 2032
- Table 102: Global Clickstream Analytics Market Volume K Unit Forecast, by Offering 2019 & 2032
- Table 103: Global Clickstream Analytics Market Revenue Million Forecast, by Application 2019 & 2032
- Table 104: Global Clickstream Analytics Market Volume K Unit Forecast, by Application 2019 & 2032
- Table 105: Global Clickstream Analytics Market Revenue Million Forecast, by End-user Industry 2019 & 2032
- Table 106: Global Clickstream Analytics Market Volume K Unit Forecast, by End-user Industry 2019 & 2032
- Table 107: Global Clickstream Analytics Market Revenue Million Forecast, by Country 2019 & 2032
- Table 108: Global Clickstream Analytics Market Volume K Unit Forecast, by Country 2019 & 2032
- Table 109: Global Clickstream Analytics Market Revenue Million Forecast, by Offering 2019 & 2032
- Table 110: Global Clickstream Analytics Market Volume K Unit Forecast, by Offering 2019 & 2032
- Table 111: Global Clickstream Analytics Market Revenue Million Forecast, by Application 2019 & 2032
- Table 112: Global Clickstream Analytics Market Volume K Unit Forecast, by Application 2019 & 2032
- Table 113: Global Clickstream Analytics Market Revenue Million Forecast, by End-user Industry 2019 & 2032
- Table 114: Global Clickstream Analytics Market Volume K Unit Forecast, by End-user Industry 2019 & 2032
- Table 115: Global Clickstream Analytics Market Revenue Million Forecast, by Country 2019 & 2032
- Table 116: Global Clickstream Analytics Market Volume K Unit Forecast, by Country 2019 & 2032
- Table 117: Global Clickstream Analytics Market Revenue Million Forecast, by Offering 2019 & 2032
- Table 118: Global Clickstream Analytics Market Volume K Unit Forecast, by Offering 2019 & 2032
- Table 119: Global Clickstream Analytics Market Revenue Million Forecast, by Application 2019 & 2032
- Table 120: Global Clickstream Analytics Market Volume K Unit Forecast, by Application 2019 & 2032
- Table 121: Global Clickstream Analytics Market Revenue Million Forecast, by End-user Industry 2019 & 2032
- Table 122: Global Clickstream Analytics Market Volume K Unit Forecast, by End-user Industry 2019 & 2032
- Table 123: Global Clickstream Analytics Market Revenue Million Forecast, by Country 2019 & 2032
- Table 124: Global Clickstream Analytics Market Volume K Unit Forecast, by Country 2019 & 2032
- Table 125: Global Clickstream Analytics Market Revenue Million Forecast, by Offering 2019 & 2032
- Table 126: Global Clickstream Analytics Market Volume K Unit Forecast, by Offering 2019 & 2032
- Table 127: Global Clickstream Analytics Market Revenue Million Forecast, by Application 2019 & 2032
- Table 128: Global Clickstream Analytics Market Volume K Unit Forecast, by Application 2019 & 2032
- Table 129: Global Clickstream Analytics Market Revenue Million Forecast, by End-user Industry 2019 & 2032
- Table 130: Global Clickstream Analytics Market Volume K Unit Forecast, by End-user Industry 2019 & 2032
- Table 131: Global Clickstream Analytics Market Revenue Million Forecast, by Country 2019 & 2032
- Table 132: Global Clickstream Analytics Market Volume K Unit Forecast, by Country 2019 & 2032
- Table 133: Global Clickstream Analytics Market Revenue Million Forecast, by Offering 2019 & 2032
- Table 134: Global Clickstream Analytics Market Volume K Unit Forecast, by Offering 2019 & 2032
- Table 135: Global Clickstream Analytics Market Revenue Million Forecast, by Application 2019 & 2032
- Table 136: Global Clickstream Analytics Market Volume K Unit Forecast, by Application 2019 & 2032
- Table 137: Global Clickstream Analytics Market Revenue Million Forecast, by End-user Industry 2019 & 2032
- Table 138: Global Clickstream Analytics Market Volume K Unit Forecast, by End-user Industry 2019 & 2032
- Table 139: Global Clickstream Analytics Market Revenue Million Forecast, by Country 2019 & 2032
- Table 140: Global Clickstream Analytics Market Volume K Unit Forecast, by Country 2019 & 2032
- Table 141: Global Clickstream Analytics Market Revenue Million Forecast, by Offering 2019 & 2032
- Table 142: Global Clickstream Analytics Market Volume K Unit Forecast, by Offering 2019 & 2032
- Table 143: Global Clickstream Analytics Market Revenue Million Forecast, by Application 2019 & 2032
- Table 144: Global Clickstream Analytics Market Volume K Unit Forecast, by Application 2019 & 2032
- Table 145: Global Clickstream Analytics Market Revenue Million Forecast, by End-user Industry 2019 & 2032
- Table 146: Global Clickstream Analytics Market Volume K Unit Forecast, by End-user Industry 2019 & 2032
- Table 147: Global Clickstream Analytics Market Revenue Million Forecast, by Country 2019 & 2032
- Table 148: Global Clickstream Analytics Market Volume K Unit Forecast, by Country 2019 & 2032
Frequently Asked Questions
1. What is the projected Compound Annual Growth Rate (CAGR) of the Clickstream Analytics Market?
The projected CAGR is approximately 11.39%.
2. Which companies are prominent players in the Clickstream Analytics Market?
Key companies in the market include IBM Corporation, Google LLC, Jumpshot Inc, Hewlett Packard Enterprise, Vlocity Inc, Microsoft Corporation, Adobe Systems Incorporated, WebTrends Corporation, Oracle Corporation, Verto Analytics Inc, Connexity inc, Splunk Inc, Talend Inc, SAP SE.
3. What are the main segments of the Clickstream Analytics Market?
The market segments include Offering, Application, End-user Industry.
4. Can you provide details about the market size?
The market size is estimated to be USD 1.92 Million as of 2022.
5. What are some drivers contributing to market growth?
Rapid Adoption of Mobile Technology Providing Multiple Digital Touchpoints is Encouraging the Market Growth.
6. What are the notable trends driving market growth?
The Retail Industry will Dominate the Market.
7. Are there any restraints impacting market growth?
Data Privacy Laws are Limiting the Market Growth.
8. Can you provide examples of recent developments in the market?
August 2023: SAP and Google Cloud announced the expansion of their collaboration by introducing an open data offering designed solution to simplify data landscapes and unleash the power of business data. This allows customers to build a data cloud through SAP's Datasphere solution, combining it with Google's Public Cloud, and store all their data in one place for the overall enterprise landscape, enabling businesses to view their entire data estates in real-time and maximize value from their Google Cloud and SAP software investments.
9. What pricing options are available for accessing the report?
Pricing options include single-user, multi-user, and enterprise licenses priced at USD 4750, USD 5250, and USD 8750 respectively.
10. Is the market size provided in terms of value or volume?
The market size is provided in terms of value, measured in Million and volume, measured in K Unit.
11. Are there any specific market keywords associated with the report?
Yes, the market keyword associated with the report is "Clickstream Analytics Market," which aids in identifying and referencing the specific market segment covered.
12. How do I determine which pricing option suits my needs best?
The pricing options vary based on user requirements and access needs. Individual users may opt for single-user licenses, while businesses requiring broader access may choose multi-user or enterprise licenses for cost-effective access to the report.
13. Are there any additional resources or data provided in the Clickstream Analytics Market report?
While the report offers comprehensive insights, it's advisable to review the specific contents or supplementary materials provided to ascertain if additional resources or data are available.
14. How can I stay updated on further developments or reports in the Clickstream Analytics Market?
To stay informed about further developments, trends, and reports in the Clickstream Analytics Market, consider subscribing to industry newsletters, following relevant companies and organizations, or regularly checking reputable industry news sources and publications.
Methodology
Step 1 - Identification of Relevant Samples Size from Population Database


Step 2 - Approaches for Defining Global Market Size (Value, Volume* & Price*)

Note*: In applicable scenarios
Step 3 - Data Sources
Primary Research
- Web Analytics
- Survey Reports
- Research Institute
- Latest Research Reports
- Opinion Leaders
Secondary Research
- Annual Reports
- White Paper
- Latest Press Release
- Industry Association
- Paid Database
- Investor Presentations

Step 4 - Data Triangulation
Involves using different sources of information in order to increase the validity of a study
These sources are likely to be stakeholders in a program - participants, other researchers, program staff, other community members, and so on.
Then we put all data in single framework & apply various statistical tools to find out the dynamic on the market.
During the analysis stage, feedback from the stakeholder groups would be compared to determine areas of agreement as well as areas of divergence


