
Key Insights
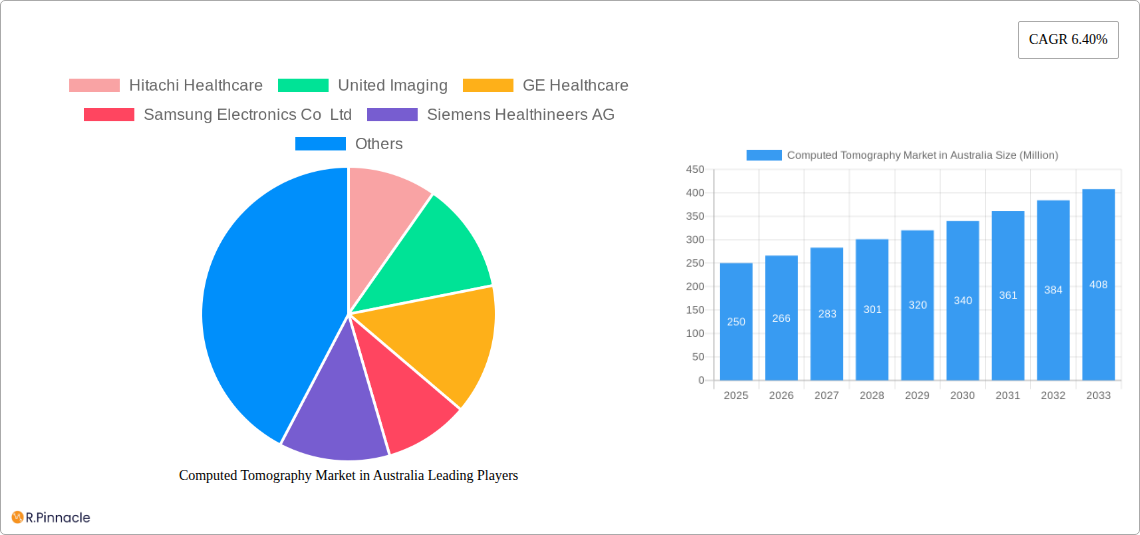
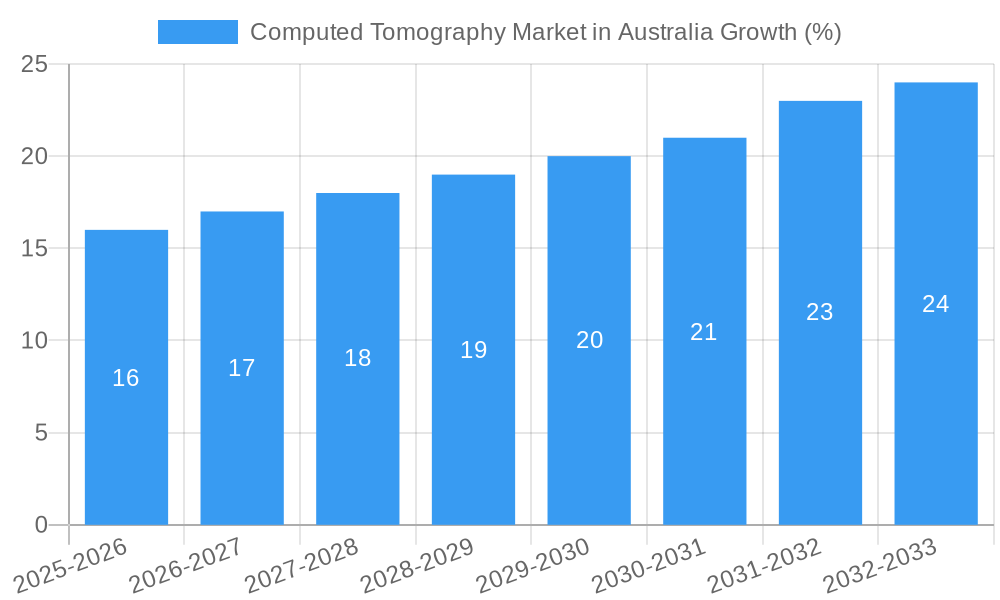
The Australian computed tomography (CT) market exhibits robust growth, driven by factors such as an aging population, increasing prevalence of chronic diseases necessitating advanced diagnostic imaging, and technological advancements leading to higher-resolution scans and faster acquisition times. The market's compound annual growth rate (CAGR) of 6.40% from 2019 to 2024 suggests a consistently expanding demand for CT services. This growth is further fueled by rising healthcare expenditure and government initiatives promoting early disease detection and improved healthcare infrastructure. Segmentation reveals a strong demand across various applications, including oncology, neurology, and cardiology, reflecting the versatility of CT scans in diagnosing a wide array of conditions. Hospitals and diagnostic centers remain the primary end-users, although the "other end-users" segment, encompassing smaller clinics and private practices, is projected to see moderate growth in the coming years due to increased access to technology and rising patient preference for convenience. The high-slice CT segment commands a significant market share, reflecting a preference for superior image quality and faster scan times. Key players such as Hitachi Healthcare, GE Healthcare, and Siemens Healthineers are actively competing to meet this growing demand, continually innovating in technology and expanding their market presence. The market’s strong performance is expected to continue throughout the forecast period (2025-2033), fueled by ongoing technological innovation, increasing healthcare investment, and a growing need for sophisticated diagnostic tools.
The competitive landscape is characterized by both established multinational corporations and smaller specialized companies. These companies are engaged in a dynamic interplay of technological innovation, strategic partnerships, and market expansion strategies. The increasing adoption of advanced imaging technologies, such as multi-slice CT scanners and AI-powered image analysis, is significantly enhancing the efficiency and diagnostic capabilities of CT scans. This, in turn, is driving market growth and shaping future trends. While regulatory hurdles and high equipment costs could potentially pose some constraints, the overall market outlook remains positive, with continuous growth anticipated across all segments in the coming years, particularly fueled by ongoing investments in infrastructure modernization and the escalating prevalence of chronic illnesses within the Australian population.
Computed Tomography (CT) Market in Australia: A Comprehensive Report (2019-2033)
This in-depth report provides a comprehensive analysis of the Computed Tomography (CT) market in Australia, covering the period 2019-2033. It offers valuable insights into market dynamics, growth drivers, challenges, and opportunities, equipping industry professionals with actionable intelligence for strategic decision-making. The report meticulously segments the market by application, end-user, and CT type, providing granular data and forecasts for informed investment and expansion strategies. With a base year of 2025 and a forecast period extending to 2033, this report is an essential resource for understanding the evolving landscape of the Australian CT market.
Computed Tomography Market in Australia: Market Structure & Innovation Trends
The Australian CT market exhibits a moderately concentrated structure, with key players like GE Healthcare, Siemens Healthineers AG, Hitachi Healthcare, and Koninklijke Philips NV holding significant market share. The exact market share distribution varies across segments, but the combined market share of these top four players likely exceeds xx%. Innovation is driven by the need for enhanced image quality, faster scan times, and reduced radiation dose. The regulatory framework, primarily overseen by the Therapeutic Goods Administration (TGA), influences the adoption of new technologies. Product substitutes, such as MRI and ultrasound, compete for a share of the diagnostic imaging market, although CT remains dominant in certain applications. The Australian market displays a diverse end-user demographic across hospitals and diagnostic centers, with hospitals representing the largest segment. M&A activities in the Australian CT market have been relatively moderate in recent years, with deal values in the range of xx Million to xx Million AUD annually in the 2019-2024 period.
- Market Concentration: Moderately Concentrated
- Innovation Drivers: Enhanced image quality, faster scan times, reduced radiation dose.
- Regulatory Framework: TGA oversight.
- Product Substitutes: MRI, Ultrasound.
- End-User Demographics: Hospitals, Diagnostic Centers.
- M&A Activity: Moderate, with deal values of xx Million - xx Million AUD annually (2019-2024).
Computed Tomography Market in Australia: Market Dynamics & Trends
The Australian CT market is witnessing robust growth, driven by factors such as the rising prevalence of chronic diseases (cardiovascular diseases, cancer, neurological disorders), an aging population, increased healthcare spending, and technological advancements in CT scanner technology. The market's Compound Annual Growth Rate (CAGR) from 2019-2024 was approximately xx%, with a projected CAGR of xx% from 2025-2033. Technological disruptions, including the development of multi-slice CT scanners and advanced image reconstruction techniques, are contributing to improved diagnostic capabilities and market penetration. Consumer preference shifts towards faster, higher-quality imaging with lower radiation exposure are shaping product development. The competitive dynamics are characterized by intense rivalry among established players and the emergence of innovative companies, with a focus on strategic partnerships and product differentiation. Market penetration continues to grow, especially in regional areas with increased access to healthcare services.
Dominant Regions & Segments in Computed Tomography Market in Australia
The Australian CT market is geographically widespread, with significant activity across major cities and regional centers. While precise regional breakdown requires further analysis, metropolitan areas with larger populations and higher concentrations of healthcare facilities likely represent larger market segments.
By Application:
- Oncology: This segment demonstrates strong growth due to the increasing incidence of cancer and the crucial role of CT in cancer diagnosis and treatment planning.
- Neurology: The need for advanced neuroimaging techniques drives high demand for CT scans in neurology.
- Cardiovascular: CT is used extensively in cardiovascular diagnostics, leading to significant market demand.
- Musculoskeletal: CT plays a vital role in diagnosing musculoskeletal injuries and conditions, resulting in considerable market share.
- Other Applications: Includes a range of applications like trauma imaging, abdominal imaging, and more.
By End User:
- Hospitals: Hospitals remain the largest end-user segment, representing xx% of the market, driven by extensive diagnostic needs.
- Diagnostic Centers: This segment is growing rapidly due to the increasing trend of outsourcing imaging services.
- Other End Users: This category encompasses specialized clinics and other healthcare providers.
By Type:
- Multi-slice CT (High Slice): The high-slice CT segment dominates, owing to superior image quality and diagnostic capabilities.
- Medium Slice CT: Maintains a significant market share, offering a balance of performance and affordability.
- Low Slice CT: A smaller, yet still active, segment.
Key drivers for dominance in various segments include technological advancements, healthcare policies promoting early disease detection, and an increase in the number of medical specialists using CT scans for diagnosis.
Computed Tomography Market in Australia: Product Innovations
Recent product developments in the Australian CT market focus on enhanced speed, image quality, and reduced radiation dose. Multi-slice CT scanners with advanced reconstruction algorithms are becoming increasingly prevalent. Innovations in detector technology and software algorithms are improving image clarity and reducing artifact noise. This translates to enhanced diagnostic accuracy and a better patient experience, fostering wider adoption and influencing competitive advantage.
Report Scope & Segmentation Analysis
This report covers the Australian CT market from 2019 to 2033, segmented by application (Oncology, Neurology, Cardiovascular, Musculoskeletal, Other), end-user (Hospitals, Diagnostic Centers, Other), and type (Low Slice, Medium Slice, High Slice). Each segment’s growth projection is estimated independently, reflecting market size and competitive landscape fluctuations. For example, the Oncology segment is projected to show robust growth due to the rising cancer prevalence. Similarly, the Hospitals segment is expected to maintain its dominance, with growth influenced by investment in medical infrastructure. The High Slice CT segment leads in terms of market size and growth due to its advanced capabilities.
Key Drivers of Computed Tomography Market in Australia Growth
The growth of the Australian CT market is fueled by several factors: the increasing prevalence of chronic diseases necessitating advanced diagnostic tools, the aging population demanding more healthcare services, the growing government investment in healthcare infrastructure and technology, and technological advancements leading to improved image quality and reduced radiation exposure. Rising disposable incomes and increased health awareness also contribute to market expansion.
Challenges in the Computed Tomography Market in Australia Sector
Challenges facing the Australian CT market include the high cost of CT scanners and associated maintenance, potential regulatory hurdles for new technology approvals, the need for skilled technicians, and the pressure to balance cost-effectiveness with advanced technology. Supply chain disruptions impacting the availability of components can also present significant challenges. These factors can impact market growth and overall profitability.
Emerging Opportunities in Computed Tomography Market in Australia
Emerging opportunities include the growing adoption of mobile CT units for improved accessibility in remote areas, the integration of AI and machine learning in image analysis for enhanced diagnostic accuracy, and the potential for expanding the use of CT in preventive care. The development of more specialized CT scans designed for specific medical conditions also presents considerable opportunity.
Leading Players in the Computed Tomography Market in Australia Market
- Hitachi Healthcare
- United Imaging
- GE Healthcare
- Samsung Electronics Co Ltd
- Siemens Healthineers AG
- Carestream Health
- Koninklijke Philips NV
- J Morita Corporation
- Neusoft Medical Systems
- Planmeca Group (Planmed OY)
Key Developments in Computed Tomography Market in Australia Industry
- May 2023: Launch of mobile radiography clinic using Philips' 128-slice Incisive CT Pro scanner, expanding access to CT scans in remote areas.
- April 2022: USD 17.2 Million funding commitment from the Federal Government for mobile health clinics, including CT and X-ray imaging services, significantly boosting service availability and market growth.
Future Outlook for Computed Tomography Market in Australia Market
The future of the Australian CT market appears bright, with strong growth projections driven by continued technological innovation, increasing healthcare spending, and the rising prevalence of chronic diseases. Strategic opportunities lie in expanding access to CT services, integrating advanced technologies like AI, and developing specialized CT applications. The market is poised for significant expansion in the coming years.
Computed Tomography Market in Australia Segmentation
-
1. Type
- 1.1. Low Slice
- 1.2. Medium Slice
- 1.3. High Slice
-
2. Application
- 2.1. Oncology
- 2.2. Neurology
- 2.3. Cardiovascular
- 2.4. Musculoskeletal
- 2.5. Other Applications
-
3. End User
- 3.1. Hospitals
- 3.2. Diagnostic Centers
- 3.3. Other End Users
Computed Tomography Market in Australia Segmentation By Geography
-
1. North America
- 1.1. United States
- 1.2. Canada
- 1.3. Mexico
-
2. South America
- 2.1. Brazil
- 2.2. Argentina
- 2.3. Rest of South America
-
3. Europe
- 3.1. United Kingdom
- 3.2. Germany
- 3.3. France
- 3.4. Italy
- 3.5. Spain
- 3.6. Russia
- 3.7. Benelux
- 3.8. Nordics
- 3.9. Rest of Europe
-
4. Middle East & Africa
- 4.1. Turkey
- 4.2. Israel
- 4.3. GCC
- 4.4. North Africa
- 4.5. South Africa
- 4.6. Rest of Middle East & Africa
-
5. Asia Pacific
- 5.1. China
- 5.2. India
- 5.3. Japan
- 5.4. South Korea
- 5.5. ASEAN
- 5.6. Oceania
- 5.7. Rest of Asia Pacific
Computed Tomography Market in Australia REPORT HIGHLIGHTS
| Aspects | Details |
|---|---|
| Study Period | 2019-2033 |
| Base Year | 2024 |
| Estimated Year | 2025 |
| Forecast Period | 2025-2033 |
| Historical Period | 2019-2024 |
| Growth Rate | CAGR of 6.40% from 2019-2033 |
| Segmentation |
|
Table of Contents
- 1. Introduction
- 1.1. Research Scope
- 1.2. Market Segmentation
- 1.3. Research Methodology
- 1.4. Definitions and Assumptions
- 2. Executive Summary
- 2.1. Introduction
- 3. Market Dynamics
- 3.1. Introduction
- 3.2. Market Drivers
- 3.2.1. Increasing Prevalence of Chronic Diseases and Rising Geriatric Population; Technological Advancement and Investment in Healthcare Facilities
- 3.3. Market Restrains
- 3.3.1. Lack of Proper Reimbursement and Stringent Regulatory Approval Procedures; High Cost of Equipment
- 3.4. Market Trends
- 3.4.1. Hospitals Segment is Expected to Hold a Significant Market Share Over the Forecast Period
- 4. Market Factor Analysis
- 4.1. Porters Five Forces
- 4.2. Supply/Value Chain
- 4.3. PESTEL analysis
- 4.4. Market Entropy
- 4.5. Patent/Trademark Analysis
- 5. Global Computed Tomography Market in Australia Analysis, Insights and Forecast, 2019-2031
- 5.1. Market Analysis, Insights and Forecast - by Type
- 5.1.1. Low Slice
- 5.1.2. Medium Slice
- 5.1.3. High Slice
- 5.2. Market Analysis, Insights and Forecast - by Application
- 5.2.1. Oncology
- 5.2.2. Neurology
- 5.2.3. Cardiovascular
- 5.2.4. Musculoskeletal
- 5.2.5. Other Applications
- 5.3. Market Analysis, Insights and Forecast - by End User
- 5.3.1. Hospitals
- 5.3.2. Diagnostic Centers
- 5.3.3. Other End Users
- 5.4. Market Analysis, Insights and Forecast - by Region
- 5.4.1. North America
- 5.4.2. South America
- 5.4.3. Europe
- 5.4.4. Middle East & Africa
- 5.4.5. Asia Pacific
- 5.1. Market Analysis, Insights and Forecast - by Type
- 6. North America Computed Tomography Market in Australia Analysis, Insights and Forecast, 2019-2031
- 6.1. Market Analysis, Insights and Forecast - by Type
- 6.1.1. Low Slice
- 6.1.2. Medium Slice
- 6.1.3. High Slice
- 6.2. Market Analysis, Insights and Forecast - by Application
- 6.2.1. Oncology
- 6.2.2. Neurology
- 6.2.3. Cardiovascular
- 6.2.4. Musculoskeletal
- 6.2.5. Other Applications
- 6.3. Market Analysis, Insights and Forecast - by End User
- 6.3.1. Hospitals
- 6.3.2. Diagnostic Centers
- 6.3.3. Other End Users
- 6.1. Market Analysis, Insights and Forecast - by Type
- 7. South America Computed Tomography Market in Australia Analysis, Insights and Forecast, 2019-2031
- 7.1. Market Analysis, Insights and Forecast - by Type
- 7.1.1. Low Slice
- 7.1.2. Medium Slice
- 7.1.3. High Slice
- 7.2. Market Analysis, Insights and Forecast - by Application
- 7.2.1. Oncology
- 7.2.2. Neurology
- 7.2.3. Cardiovascular
- 7.2.4. Musculoskeletal
- 7.2.5. Other Applications
- 7.3. Market Analysis, Insights and Forecast - by End User
- 7.3.1. Hospitals
- 7.3.2. Diagnostic Centers
- 7.3.3. Other End Users
- 7.1. Market Analysis, Insights and Forecast - by Type
- 8. Europe Computed Tomography Market in Australia Analysis, Insights and Forecast, 2019-2031
- 8.1. Market Analysis, Insights and Forecast - by Type
- 8.1.1. Low Slice
- 8.1.2. Medium Slice
- 8.1.3. High Slice
- 8.2. Market Analysis, Insights and Forecast - by Application
- 8.2.1. Oncology
- 8.2.2. Neurology
- 8.2.3. Cardiovascular
- 8.2.4. Musculoskeletal
- 8.2.5. Other Applications
- 8.3. Market Analysis, Insights and Forecast - by End User
- 8.3.1. Hospitals
- 8.3.2. Diagnostic Centers
- 8.3.3. Other End Users
- 8.1. Market Analysis, Insights and Forecast - by Type
- 9. Middle East & Africa Computed Tomography Market in Australia Analysis, Insights and Forecast, 2019-2031
- 9.1. Market Analysis, Insights and Forecast - by Type
- 9.1.1. Low Slice
- 9.1.2. Medium Slice
- 9.1.3. High Slice
- 9.2. Market Analysis, Insights and Forecast - by Application
- 9.2.1. Oncology
- 9.2.2. Neurology
- 9.2.3. Cardiovascular
- 9.2.4. Musculoskeletal
- 9.2.5. Other Applications
- 9.3. Market Analysis, Insights and Forecast - by End User
- 9.3.1. Hospitals
- 9.3.2. Diagnostic Centers
- 9.3.3. Other End Users
- 9.1. Market Analysis, Insights and Forecast - by Type
- 10. Asia Pacific Computed Tomography Market in Australia Analysis, Insights and Forecast, 2019-2031
- 10.1. Market Analysis, Insights and Forecast - by Type
- 10.1.1. Low Slice
- 10.1.2. Medium Slice
- 10.1.3. High Slice
- 10.2. Market Analysis, Insights and Forecast - by Application
- 10.2.1. Oncology
- 10.2.2. Neurology
- 10.2.3. Cardiovascular
- 10.2.4. Musculoskeletal
- 10.2.5. Other Applications
- 10.3. Market Analysis, Insights and Forecast - by End User
- 10.3.1. Hospitals
- 10.3.2. Diagnostic Centers
- 10.3.3. Other End Users
- 10.1. Market Analysis, Insights and Forecast - by Type
- 11. Competitive Analysis
- 11.1. Global Market Share Analysis 2024
- 11.2. Company Profiles
- 11.2.1 Hitachi Healthcare
- 11.2.1.1. Overview
- 11.2.1.2. Products
- 11.2.1.3. SWOT Analysis
- 11.2.1.4. Recent Developments
- 11.2.1.5. Financials (Based on Availability)
- 11.2.2 United Imaging
- 11.2.2.1. Overview
- 11.2.2.2. Products
- 11.2.2.3. SWOT Analysis
- 11.2.2.4. Recent Developments
- 11.2.2.5. Financials (Based on Availability)
- 11.2.3 GE Healthcare
- 11.2.3.1. Overview
- 11.2.3.2. Products
- 11.2.3.3. SWOT Analysis
- 11.2.3.4. Recent Developments
- 11.2.3.5. Financials (Based on Availability)
- 11.2.4 Samsung Electronics Co Ltd
- 11.2.4.1. Overview
- 11.2.4.2. Products
- 11.2.4.3. SWOT Analysis
- 11.2.4.4. Recent Developments
- 11.2.4.5. Financials (Based on Availability)
- 11.2.5 Siemens Healthineers AG
- 11.2.5.1. Overview
- 11.2.5.2. Products
- 11.2.5.3. SWOT Analysis
- 11.2.5.4. Recent Developments
- 11.2.5.5. Financials (Based on Availability)
- 11.2.6 Carestream Health
- 11.2.6.1. Overview
- 11.2.6.2. Products
- 11.2.6.3. SWOT Analysis
- 11.2.6.4. Recent Developments
- 11.2.6.5. Financials (Based on Availability)
- 11.2.7 Koninklijke Philips NV
- 11.2.7.1. Overview
- 11.2.7.2. Products
- 11.2.7.3. SWOT Analysis
- 11.2.7.4. Recent Developments
- 11.2.7.5. Financials (Based on Availability)
- 11.2.8 J Morita Corporation
- 11.2.8.1. Overview
- 11.2.8.2. Products
- 11.2.8.3. SWOT Analysis
- 11.2.8.4. Recent Developments
- 11.2.8.5. Financials (Based on Availability)
- 11.2.9 Neusoft Medical Systems*List Not Exhaustive
- 11.2.9.1. Overview
- 11.2.9.2. Products
- 11.2.9.3. SWOT Analysis
- 11.2.9.4. Recent Developments
- 11.2.9.5. Financials (Based on Availability)
- 11.2.10 Planmeca Group (Planmed OY)
- 11.2.10.1. Overview
- 11.2.10.2. Products
- 11.2.10.3. SWOT Analysis
- 11.2.10.4. Recent Developments
- 11.2.10.5. Financials (Based on Availability)
- 11.2.1 Hitachi Healthcare
List of Figures
- Figure 1: Global Computed Tomography Market in Australia Revenue Breakdown (Million, %) by Region 2024 & 2032
- Figure 2: Australia Computed Tomography Market in Australia Revenue (Million), by Country 2024 & 2032
- Figure 3: Australia Computed Tomography Market in Australia Revenue Share (%), by Country 2024 & 2032
- Figure 4: North America Computed Tomography Market in Australia Revenue (Million), by Type 2024 & 2032
- Figure 5: North America Computed Tomography Market in Australia Revenue Share (%), by Type 2024 & 2032
- Figure 6: North America Computed Tomography Market in Australia Revenue (Million), by Application 2024 & 2032
- Figure 7: North America Computed Tomography Market in Australia Revenue Share (%), by Application 2024 & 2032
- Figure 8: North America Computed Tomography Market in Australia Revenue (Million), by End User 2024 & 2032
- Figure 9: North America Computed Tomography Market in Australia Revenue Share (%), by End User 2024 & 2032
- Figure 10: North America Computed Tomography Market in Australia Revenue (Million), by Country 2024 & 2032
- Figure 11: North America Computed Tomography Market in Australia Revenue Share (%), by Country 2024 & 2032
- Figure 12: South America Computed Tomography Market in Australia Revenue (Million), by Type 2024 & 2032
- Figure 13: South America Computed Tomography Market in Australia Revenue Share (%), by Type 2024 & 2032
- Figure 14: South America Computed Tomography Market in Australia Revenue (Million), by Application 2024 & 2032
- Figure 15: South America Computed Tomography Market in Australia Revenue Share (%), by Application 2024 & 2032
- Figure 16: South America Computed Tomography Market in Australia Revenue (Million), by End User 2024 & 2032
- Figure 17: South America Computed Tomography Market in Australia Revenue Share (%), by End User 2024 & 2032
- Figure 18: South America Computed Tomography Market in Australia Revenue (Million), by Country 2024 & 2032
- Figure 19: South America Computed Tomography Market in Australia Revenue Share (%), by Country 2024 & 2032
- Figure 20: Europe Computed Tomography Market in Australia Revenue (Million), by Type 2024 & 2032
- Figure 21: Europe Computed Tomography Market in Australia Revenue Share (%), by Type 2024 & 2032
- Figure 22: Europe Computed Tomography Market in Australia Revenue (Million), by Application 2024 & 2032
- Figure 23: Europe Computed Tomography Market in Australia Revenue Share (%), by Application 2024 & 2032
- Figure 24: Europe Computed Tomography Market in Australia Revenue (Million), by End User 2024 & 2032
- Figure 25: Europe Computed Tomography Market in Australia Revenue Share (%), by End User 2024 & 2032
- Figure 26: Europe Computed Tomography Market in Australia Revenue (Million), by Country 2024 & 2032
- Figure 27: Europe Computed Tomography Market in Australia Revenue Share (%), by Country 2024 & 2032
- Figure 28: Middle East & Africa Computed Tomography Market in Australia Revenue (Million), by Type 2024 & 2032
- Figure 29: Middle East & Africa Computed Tomography Market in Australia Revenue Share (%), by Type 2024 & 2032
- Figure 30: Middle East & Africa Computed Tomography Market in Australia Revenue (Million), by Application 2024 & 2032
- Figure 31: Middle East & Africa Computed Tomography Market in Australia Revenue Share (%), by Application 2024 & 2032
- Figure 32: Middle East & Africa Computed Tomography Market in Australia Revenue (Million), by End User 2024 & 2032
- Figure 33: Middle East & Africa Computed Tomography Market in Australia Revenue Share (%), by End User 2024 & 2032
- Figure 34: Middle East & Africa Computed Tomography Market in Australia Revenue (Million), by Country 2024 & 2032
- Figure 35: Middle East & Africa Computed Tomography Market in Australia Revenue Share (%), by Country 2024 & 2032
- Figure 36: Asia Pacific Computed Tomography Market in Australia Revenue (Million), by Type 2024 & 2032
- Figure 37: Asia Pacific Computed Tomography Market in Australia Revenue Share (%), by Type 2024 & 2032
- Figure 38: Asia Pacific Computed Tomography Market in Australia Revenue (Million), by Application 2024 & 2032
- Figure 39: Asia Pacific Computed Tomography Market in Australia Revenue Share (%), by Application 2024 & 2032
- Figure 40: Asia Pacific Computed Tomography Market in Australia Revenue (Million), by End User 2024 & 2032
- Figure 41: Asia Pacific Computed Tomography Market in Australia Revenue Share (%), by End User 2024 & 2032
- Figure 42: Asia Pacific Computed Tomography Market in Australia Revenue (Million), by Country 2024 & 2032
- Figure 43: Asia Pacific Computed Tomography Market in Australia Revenue Share (%), by Country 2024 & 2032
List of Tables
- Table 1: Global Computed Tomography Market in Australia Revenue Million Forecast, by Region 2019 & 2032
- Table 2: Global Computed Tomography Market in Australia Revenue Million Forecast, by Type 2019 & 2032
- Table 3: Global Computed Tomography Market in Australia Revenue Million Forecast, by Application 2019 & 2032
- Table 4: Global Computed Tomography Market in Australia Revenue Million Forecast, by End User 2019 & 2032
- Table 5: Global Computed Tomography Market in Australia Revenue Million Forecast, by Region 2019 & 2032
- Table 6: Global Computed Tomography Market in Australia Revenue Million Forecast, by Country 2019 & 2032
- Table 7: Global Computed Tomography Market in Australia Revenue Million Forecast, by Type 2019 & 2032
- Table 8: Global Computed Tomography Market in Australia Revenue Million Forecast, by Application 2019 & 2032
- Table 9: Global Computed Tomography Market in Australia Revenue Million Forecast, by End User 2019 & 2032
- Table 10: Global Computed Tomography Market in Australia Revenue Million Forecast, by Country 2019 & 2032
- Table 11: United States Computed Tomography Market in Australia Revenue (Million) Forecast, by Application 2019 & 2032
- Table 12: Canada Computed Tomography Market in Australia Revenue (Million) Forecast, by Application 2019 & 2032
- Table 13: Mexico Computed Tomography Market in Australia Revenue (Million) Forecast, by Application 2019 & 2032
- Table 14: Global Computed Tomography Market in Australia Revenue Million Forecast, by Type 2019 & 2032
- Table 15: Global Computed Tomography Market in Australia Revenue Million Forecast, by Application 2019 & 2032
- Table 16: Global Computed Tomography Market in Australia Revenue Million Forecast, by End User 2019 & 2032
- Table 17: Global Computed Tomography Market in Australia Revenue Million Forecast, by Country 2019 & 2032
- Table 18: Brazil Computed Tomography Market in Australia Revenue (Million) Forecast, by Application 2019 & 2032
- Table 19: Argentina Computed Tomography Market in Australia Revenue (Million) Forecast, by Application 2019 & 2032
- Table 20: Rest of South America Computed Tomography Market in Australia Revenue (Million) Forecast, by Application 2019 & 2032
- Table 21: Global Computed Tomography Market in Australia Revenue Million Forecast, by Type 2019 & 2032
- Table 22: Global Computed Tomography Market in Australia Revenue Million Forecast, by Application 2019 & 2032
- Table 23: Global Computed Tomography Market in Australia Revenue Million Forecast, by End User 2019 & 2032
- Table 24: Global Computed Tomography Market in Australia Revenue Million Forecast, by Country 2019 & 2032
- Table 25: United Kingdom Computed Tomography Market in Australia Revenue (Million) Forecast, by Application 2019 & 2032
- Table 26: Germany Computed Tomography Market in Australia Revenue (Million) Forecast, by Application 2019 & 2032
- Table 27: France Computed Tomography Market in Australia Revenue (Million) Forecast, by Application 2019 & 2032
- Table 28: Italy Computed Tomography Market in Australia Revenue (Million) Forecast, by Application 2019 & 2032
- Table 29: Spain Computed Tomography Market in Australia Revenue (Million) Forecast, by Application 2019 & 2032
- Table 30: Russia Computed Tomography Market in Australia Revenue (Million) Forecast, by Application 2019 & 2032
- Table 31: Benelux Computed Tomography Market in Australia Revenue (Million) Forecast, by Application 2019 & 2032
- Table 32: Nordics Computed Tomography Market in Australia Revenue (Million) Forecast, by Application 2019 & 2032
- Table 33: Rest of Europe Computed Tomography Market in Australia Revenue (Million) Forecast, by Application 2019 & 2032
- Table 34: Global Computed Tomography Market in Australia Revenue Million Forecast, by Type 2019 & 2032
- Table 35: Global Computed Tomography Market in Australia Revenue Million Forecast, by Application 2019 & 2032
- Table 36: Global Computed Tomography Market in Australia Revenue Million Forecast, by End User 2019 & 2032
- Table 37: Global Computed Tomography Market in Australia Revenue Million Forecast, by Country 2019 & 2032
- Table 38: Turkey Computed Tomography Market in Australia Revenue (Million) Forecast, by Application 2019 & 2032
- Table 39: Israel Computed Tomography Market in Australia Revenue (Million) Forecast, by Application 2019 & 2032
- Table 40: GCC Computed Tomography Market in Australia Revenue (Million) Forecast, by Application 2019 & 2032
- Table 41: North Africa Computed Tomography Market in Australia Revenue (Million) Forecast, by Application 2019 & 2032
- Table 42: South Africa Computed Tomography Market in Australia Revenue (Million) Forecast, by Application 2019 & 2032
- Table 43: Rest of Middle East & Africa Computed Tomography Market in Australia Revenue (Million) Forecast, by Application 2019 & 2032
- Table 44: Global Computed Tomography Market in Australia Revenue Million Forecast, by Type 2019 & 2032
- Table 45: Global Computed Tomography Market in Australia Revenue Million Forecast, by Application 2019 & 2032
- Table 46: Global Computed Tomography Market in Australia Revenue Million Forecast, by End User 2019 & 2032
- Table 47: Global Computed Tomography Market in Australia Revenue Million Forecast, by Country 2019 & 2032
- Table 48: China Computed Tomography Market in Australia Revenue (Million) Forecast, by Application 2019 & 2032
- Table 49: India Computed Tomography Market in Australia Revenue (Million) Forecast, by Application 2019 & 2032
- Table 50: Japan Computed Tomography Market in Australia Revenue (Million) Forecast, by Application 2019 & 2032
- Table 51: South Korea Computed Tomography Market in Australia Revenue (Million) Forecast, by Application 2019 & 2032
- Table 52: ASEAN Computed Tomography Market in Australia Revenue (Million) Forecast, by Application 2019 & 2032
- Table 53: Oceania Computed Tomography Market in Australia Revenue (Million) Forecast, by Application 2019 & 2032
- Table 54: Rest of Asia Pacific Computed Tomography Market in Australia Revenue (Million) Forecast, by Application 2019 & 2032
Frequently Asked Questions
1. What is the projected Compound Annual Growth Rate (CAGR) of the Computed Tomography Market in Australia?
The projected CAGR is approximately 6.40%.
2. Which companies are prominent players in the Computed Tomography Market in Australia?
Key companies in the market include Hitachi Healthcare, United Imaging, GE Healthcare, Samsung Electronics Co Ltd, Siemens Healthineers AG, Carestream Health, Koninklijke Philips NV, J Morita Corporation, Neusoft Medical Systems*List Not Exhaustive, Planmeca Group (Planmed OY).
3. What are the main segments of the Computed Tomography Market in Australia?
The market segments include Type, Application, End User.
4. Can you provide details about the market size?
The market size is estimated to be USD XX Million as of 2022.
5. What are some drivers contributing to market growth?
Increasing Prevalence of Chronic Diseases and Rising Geriatric Population; Technological Advancement and Investment in Healthcare Facilities.
6. What are the notable trends driving market growth?
Hospitals Segment is Expected to Hold a Significant Market Share Over the Forecast Period.
7. Are there any restraints impacting market growth?
Lack of Proper Reimbursement and Stringent Regulatory Approval Procedures; High Cost of Equipment.
8. Can you provide examples of recent developments in the market?
In May 2023, the mobile radiography clinic, after four years, reached the Heart of Australia truck, which was launched in February 2022. The truck took the Philips' 128-slice Incisive CT Pro scanner to screen the lungs of Australian minors.
9. What pricing options are available for accessing the report?
Pricing options include single-user, multi-user, and enterprise licenses priced at USD 3800, USD 4500, and USD 5800 respectively.
10. Is the market size provided in terms of value or volume?
The market size is provided in terms of value, measured in Million.
11. Are there any specific market keywords associated with the report?
Yes, the market keyword associated with the report is "Computed Tomography Market in Australia," which aids in identifying and referencing the specific market segment covered.
12. How do I determine which pricing option suits my needs best?
The pricing options vary based on user requirements and access needs. Individual users may opt for single-user licenses, while businesses requiring broader access may choose multi-user or enterprise licenses for cost-effective access to the report.
13. Are there any additional resources or data provided in the Computed Tomography Market in Australia report?
While the report offers comprehensive insights, it's advisable to review the specific contents or supplementary materials provided to ascertain if additional resources or data are available.
14. How can I stay updated on further developments or reports in the Computed Tomography Market in Australia?
To stay informed about further developments, trends, and reports in the Computed Tomography Market in Australia, consider subscribing to industry newsletters, following relevant companies and organizations, or regularly checking reputable industry news sources and publications.
Methodology
Step 1 - Identification of Relevant Samples Size from Population Database


Step 2 - Approaches for Defining Global Market Size (Value, Volume* & Price*)

Note*: In applicable scenarios
Step 3 - Data Sources
Primary Research
- Web Analytics
- Survey Reports
- Research Institute
- Latest Research Reports
- Opinion Leaders
Secondary Research
- Annual Reports
- White Paper
- Latest Press Release
- Industry Association
- Paid Database
- Investor Presentations

Step 4 - Data Triangulation
Involves using different sources of information in order to increase the validity of a study
These sources are likely to be stakeholders in a program - participants, other researchers, program staff, other community members, and so on.
Then we put all data in single framework & apply various statistical tools to find out the dynamic on the market.
During the analysis stage, feedback from the stakeholder groups would be compared to determine areas of agreement as well as areas of divergence


