
Key Insights
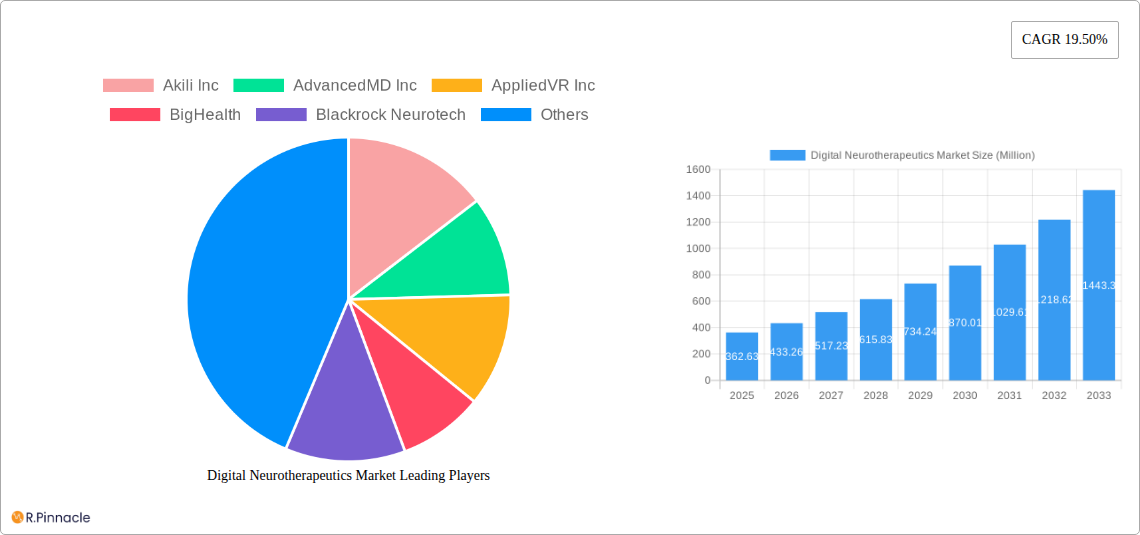
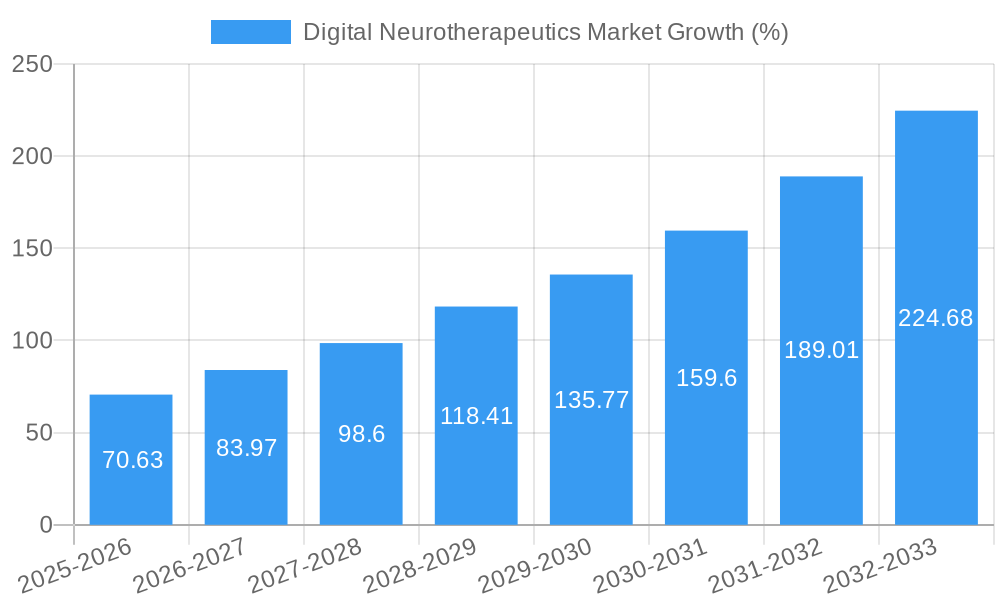
The digital neurotherapeutics market is experiencing rapid growth, projected to reach $362.63 million in 2025 and exhibiting a Compound Annual Growth Rate (CAGR) of 19.50% from 2025 to 2033. This expansion is driven by several key factors. Increasing prevalence of neurological disorders like Alzheimer's disease, Parkinson's disease, and stroke, coupled with the limitations of traditional treatments, fuels demand for innovative, accessible, and personalized therapeutic solutions. Digital neurotherapeutics, encompassing software-based interventions, telehealth platforms, and neuro-stimulation devices, offer promising alternatives, providing convenient, cost-effective, and potentially more effective treatment options compared to conventional methods. Furthermore, advancements in technology, such as artificial intelligence (AI) and virtual reality (VR), are enhancing the efficacy and personalization of these digital therapeutics, further driving market growth. Growing adoption by healthcare providers, increased research and development investments, and favorable regulatory landscapes also contribute significantly to the market's upward trajectory.
The market's segmentation is likely diverse, encompassing various therapeutic applications (e.g., depression, anxiety, chronic pain, cognitive impairment), delivery methods (e.g., mobile apps, web platforms, wearables), and patient demographics. Leading companies like Akili Inc., AppliedVR Inc., and BigHealth are actively developing and commercializing innovative digital neurotherapeutic solutions, contributing to market competitiveness and innovation. While challenges remain, such as ensuring data privacy and security, demonstrating clinical efficacy through robust clinical trials, and addressing reimbursement hurdles, the overall market outlook remains overwhelmingly positive, indicating substantial growth potential over the forecast period. Future expansion will be significantly influenced by continued technological advancements, successful clinical trial outcomes, and the ongoing integration of digital neurotherapeutics into mainstream healthcare practices.
Digital Neurotherapeutics Market: A Comprehensive Report (2019-2033)
This comprehensive report provides an in-depth analysis of the Digital Neurotherapeutics Market, covering the period from 2019 to 2033. With a focus on market structure, innovation trends, dynamics, and future projections, this report is an essential resource for industry professionals, investors, and researchers seeking to understand and capitalize on this rapidly evolving sector. The report utilizes data from 2019-2024 (Historical Period), with 2025 serving as both the Base Year and Estimated Year. The forecast period extends from 2025 to 2033. Expected market value projections are in Millions.
Digital Neurotherapeutics Market Market Structure & Innovation Trends
The Digital Neurotherapeutics market is characterized by a moderately concentrated landscape, with several key players vying for market share. Market concentration is estimated at xx%, with the top five companies holding approximately xx% of the total market share in 2025. Innovation is driven primarily by advancements in artificial intelligence (AI), machine learning (ML), and virtual reality (VR) technologies, which are being integrated into therapeutic applications. Regulatory frameworks, including FDA approvals and HIPAA compliance, significantly influence market growth. The market also faces competitive pressure from traditional neurotherapeutic methods.
- Market Concentration: xx% in 2025 (estimated)
- Top 5 Companies Market Share: xx% (estimated)
- M&A Activity: Significant M&A activity is anticipated, driven by the need for companies to expand their product portfolios and market reach. The total value of M&A deals in the Digital Neurotherapeutics market in 2024 was estimated to be $xx Million.
- Innovation Drivers: AI, ML, VR/AR technologies, Big Data analytics.
- Regulatory Landscape: Stringent regulations impact market entry and product approvals.
- Product Substitutes: Traditional therapies pose competitive pressure.
- End-User Demographics: Primarily patients with neurological disorders, including stroke, Alzheimer's, Parkinson's, and traumatic brain injury.
Digital Neurotherapeutics Market Market Dynamics & Trends
The Digital Neurotherapeutics market is experiencing robust growth, driven by increasing prevalence of neurological disorders, rising adoption of digital health solutions, and favorable reimbursement policies. Technological advancements, such as the integration of AI and VR, are further accelerating market expansion. Consumer preferences are shifting towards personalized and convenient digital therapies. The competitive landscape is intensely dynamic, with new entrants and established players constantly innovating to gain market share. The Compound Annual Growth Rate (CAGR) for the forecast period (2025-2033) is projected to be xx%. Market penetration is estimated at xx% in 2025 and is expected to reach xx% by 2033.
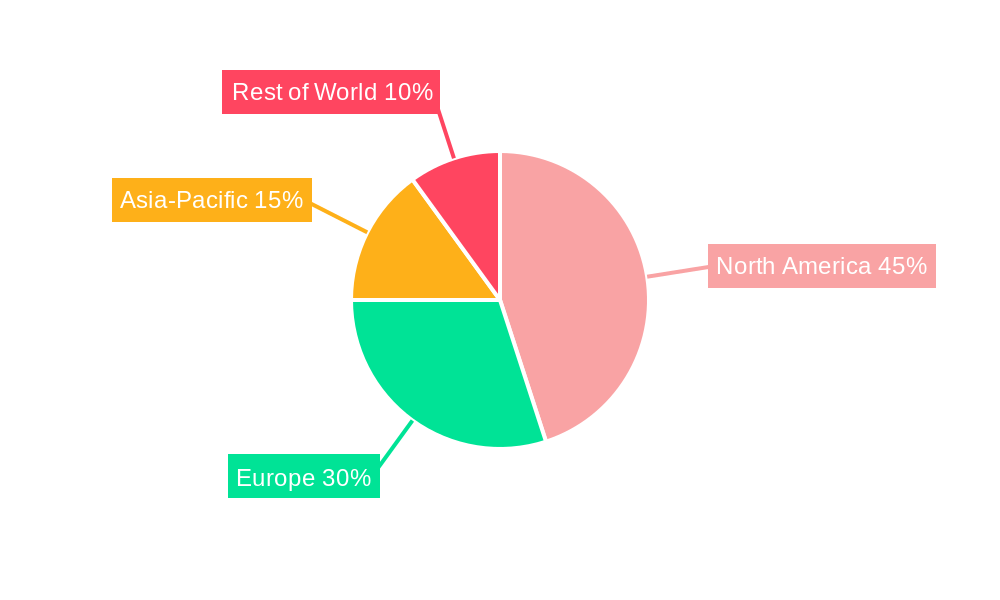
Dominant Regions & Segments in Digital Neurotherapeutics Market
North America currently dominates the Digital Neurotherapeutics market, driven by factors such as robust healthcare infrastructure, high technological adoption rates, and substantial investments in research and development.
- Key Drivers in North America:
- Well-established healthcare infrastructure
- High technological adoption rates
- Significant R&D investments
- Favorable regulatory environment.
- Dominance Analysis: North America's dominance stems from a confluence of factors, including high per capita healthcare expenditure, early adoption of digital health solutions, and the presence of major market players. Europe is a significant regional market, and Asia-Pacific is expected to experience considerable growth in the coming years.
Digital Neurotherapeutics Market Product Innovations
Recent product innovations highlight a strong focus on personalized and immersive therapies. The use of AI and ML algorithms allows for tailored treatment plans based on individual patient data. VR and AR technologies offer engaging and interactive experiences, enhancing patient engagement and treatment adherence. These innovations address unmet needs within the neurotherapeutic market, creating competitive advantages for companies that successfully integrate these technologies into their offerings.
Report Scope & Segmentation Analysis
This report segments the Digital Neurotherapeutics market based on several key parameters, including technology (AI, VR/AR, Telehealth), therapeutic area (cognitive impairment, stroke rehabilitation, mental health), and end-user (hospitals, clinics, home-based care). Each segment displays unique growth projections, market sizes, and competitive dynamics. For instance, the AI segment is expected to witness the highest CAGR, driven by rapid advancements in algorithm development and data analytics.
Key Drivers of Digital Neurotherapeutics Market Growth
Several key factors contribute to the Digital Neurotherapeutics market’s growth. The rising prevalence of neurological disorders globally fuels demand for effective treatment options. Advancements in digital technologies, particularly AI and VR, enable the development of more precise, personalized, and accessible therapies. Furthermore, increasing investments in research and development, combined with favorable regulatory policies in some regions, are driving market expansion.
Challenges in the Digital Neurotherapeutics Market Sector
The Digital Neurotherapeutics market faces challenges such as stringent regulatory approvals, concerns about data privacy and security, and reimbursement issues. The high cost of development and implementation of these advanced technologies can also limit market access in certain regions. Additionally, ensuring the efficacy and safety of these digital therapies requires rigorous clinical trials and ongoing monitoring. These factors could potentially constrain market growth if not effectively addressed.
Emerging Opportunities in Digital Neurotherapeutics Market
Emerging opportunities exist in areas such as the development of integrated platforms combining multiple therapeutic modalities, expansion into underserved markets, and creation of preventative digital neurotherapeutic solutions. The integration of wearable sensors for real-time data monitoring and personalized feedback holds significant potential. Furthermore, the development of AI-powered diagnostic tools could revolutionize early detection and intervention strategies.
Leading Players in the Digital Neurotherapeutics Market Market
- Akili Inc
- AdvancedMD Inc
- AppliedVR Inc
- BigHealth
- Blackrock Neurotech
- Cognivive Inc
- Neofect Co Ltd
- Omada Health Inc
- Neurotherapeutic Pediatric Therapies Inc
- Mindmaze
- List Not Exhaustive
Key Developments in Digital Neurotherapeutics Market Industry
- October 2023: MedRhythms reported that InTandem (MR-001), an evidence-based neurorehabilitation system using rhythmic auditory stimulation (RAS), became available for prescription for at-home use in adults with chronic stroke walking impairments. This signifies a significant advancement in accessible stroke rehabilitation.
- February 2024: The University of London's neurotherapeutics group launched the iTalkBetter app, a speech therapy tool for aphasia patients, demonstrating the growing role of mobile apps in neurorehabilitation.
Future Outlook for Digital Neurotherapeutics Market Market
The future of the Digital Neurotherapeutics market is promising. Continued technological advancements, coupled with an aging global population and increasing prevalence of neurological disorders, will drive substantial market growth. Strategic partnerships between technology companies and healthcare providers will play a critical role in expanding market reach and ensuring effective implementation of these innovative therapies. The focus on personalized and preventative care will further shape the market's trajectory.
Digital Neurotherapeutics Market Segmentation
-
1. Component
- 1.1. Software
- 1.2. Hardware
- 1.3. Services
-
2. Indication
- 2.1. Alzheimer’s Disease
- 2.2. Parkinson’s Disease
- 2.3. Multiple Sclerosis
- 2.4. Epilepsy
- 2.5. Other Indications
-
3. End User
- 3.1. Patients
- 3.2. Providers
- 3.3. Payers
- 3.4. Other End Users
Digital Neurotherapeutics Market Segmentation By Geography
-
1. North America
- 1.1. United States
- 1.2. Canada
- 1.3. Mexico
-
2. Europe
- 2.1. Germany
- 2.2. United Kingdom
- 2.3. France
- 2.4. Italy
- 2.5. Spain
- 2.6. Rest of Europe
-
3. Asia Pacific
- 3.1. China
- 3.2. Japan
- 3.3. India
- 3.4. Australia
- 3.5. South Korea
- 3.6. Rest of Asia Pacific
-
4. Middle East and Africa
- 4.1. GCC
- 4.2. South Africa
- 4.3. Rest of Middle East and Africa
-
5. South America
- 5.1. Brazil
- 5.2. Argentina
- 5.3. Rest of South America
Digital Neurotherapeutics Market REPORT HIGHLIGHTS
| Aspects | Details |
|---|---|
| Study Period | 2019-2033 |
| Base Year | 2024 |
| Estimated Year | 2025 |
| Forecast Period | 2025-2033 |
| Historical Period | 2019-2024 |
| Growth Rate | CAGR of 19.50% from 2019-2033 |
| Segmentation |
|
Table of Contents
- 1. Introduction
- 1.1. Research Scope
- 1.2. Market Segmentation
- 1.3. Research Methodology
- 1.4. Definitions and Assumptions
- 2. Executive Summary
- 2.1. Introduction
- 3. Market Dynamics
- 3.1. Introduction
- 3.2. Market Drivers
- 3.2.1. Rising Prevalence of Neurological Disorders; Growing Adoption of Digital Technology in Neurology Care
- 3.3. Market Restrains
- 3.3.1. Rising Prevalence of Neurological Disorders; Growing Adoption of Digital Technology in Neurology Care
- 3.4. Market Trends
- 3.4.1. The Multiple Sclerosis Segment is Expected to Hold Significant Market Share Over the Forecast Period
- 4. Market Factor Analysis
- 4.1. Porters Five Forces
- 4.2. Supply/Value Chain
- 4.3. PESTEL analysis
- 4.4. Market Entropy
- 4.5. Patent/Trademark Analysis
- 5. Global Digital Neurotherapeutics Market Analysis, Insights and Forecast, 2019-2031
- 5.1. Market Analysis, Insights and Forecast - by Component
- 5.1.1. Software
- 5.1.2. Hardware
- 5.1.3. Services
- 5.2. Market Analysis, Insights and Forecast - by Indication
- 5.2.1. Alzheimer’s Disease
- 5.2.2. Parkinson’s Disease
- 5.2.3. Multiple Sclerosis
- 5.2.4. Epilepsy
- 5.2.5. Other Indications
- 5.3. Market Analysis, Insights and Forecast - by End User
- 5.3.1. Patients
- 5.3.2. Providers
- 5.3.3. Payers
- 5.3.4. Other End Users
- 5.4. Market Analysis, Insights and Forecast - by Region
- 5.4.1. North America
- 5.4.2. Europe
- 5.4.3. Asia Pacific
- 5.4.4. Middle East and Africa
- 5.4.5. South America
- 5.1. Market Analysis, Insights and Forecast - by Component
- 6. North America Digital Neurotherapeutics Market Analysis, Insights and Forecast, 2019-2031
- 6.1. Market Analysis, Insights and Forecast - by Component
- 6.1.1. Software
- 6.1.2. Hardware
- 6.1.3. Services
- 6.2. Market Analysis, Insights and Forecast - by Indication
- 6.2.1. Alzheimer’s Disease
- 6.2.2. Parkinson’s Disease
- 6.2.3. Multiple Sclerosis
- 6.2.4. Epilepsy
- 6.2.5. Other Indications
- 6.3. Market Analysis, Insights and Forecast - by End User
- 6.3.1. Patients
- 6.3.2. Providers
- 6.3.3. Payers
- 6.3.4. Other End Users
- 6.1. Market Analysis, Insights and Forecast - by Component
- 7. Europe Digital Neurotherapeutics Market Analysis, Insights and Forecast, 2019-2031
- 7.1. Market Analysis, Insights and Forecast - by Component
- 7.1.1. Software
- 7.1.2. Hardware
- 7.1.3. Services
- 7.2. Market Analysis, Insights and Forecast - by Indication
- 7.2.1. Alzheimer’s Disease
- 7.2.2. Parkinson’s Disease
- 7.2.3. Multiple Sclerosis
- 7.2.4. Epilepsy
- 7.2.5. Other Indications
- 7.3. Market Analysis, Insights and Forecast - by End User
- 7.3.1. Patients
- 7.3.2. Providers
- 7.3.3. Payers
- 7.3.4. Other End Users
- 7.1. Market Analysis, Insights and Forecast - by Component
- 8. Asia Pacific Digital Neurotherapeutics Market Analysis, Insights and Forecast, 2019-2031
- 8.1. Market Analysis, Insights and Forecast - by Component
- 8.1.1. Software
- 8.1.2. Hardware
- 8.1.3. Services
- 8.2. Market Analysis, Insights and Forecast - by Indication
- 8.2.1. Alzheimer’s Disease
- 8.2.2. Parkinson’s Disease
- 8.2.3. Multiple Sclerosis
- 8.2.4. Epilepsy
- 8.2.5. Other Indications
- 8.3. Market Analysis, Insights and Forecast - by End User
- 8.3.1. Patients
- 8.3.2. Providers
- 8.3.3. Payers
- 8.3.4. Other End Users
- 8.1. Market Analysis, Insights and Forecast - by Component
- 9. Middle East and Africa Digital Neurotherapeutics Market Analysis, Insights and Forecast, 2019-2031
- 9.1. Market Analysis, Insights and Forecast - by Component
- 9.1.1. Software
- 9.1.2. Hardware
- 9.1.3. Services
- 9.2. Market Analysis, Insights and Forecast - by Indication
- 9.2.1. Alzheimer’s Disease
- 9.2.2. Parkinson’s Disease
- 9.2.3. Multiple Sclerosis
- 9.2.4. Epilepsy
- 9.2.5. Other Indications
- 9.3. Market Analysis, Insights and Forecast - by End User
- 9.3.1. Patients
- 9.3.2. Providers
- 9.3.3. Payers
- 9.3.4. Other End Users
- 9.1. Market Analysis, Insights and Forecast - by Component
- 10. South America Digital Neurotherapeutics Market Analysis, Insights and Forecast, 2019-2031
- 10.1. Market Analysis, Insights and Forecast - by Component
- 10.1.1. Software
- 10.1.2. Hardware
- 10.1.3. Services
- 10.2. Market Analysis, Insights and Forecast - by Indication
- 10.2.1. Alzheimer’s Disease
- 10.2.2. Parkinson’s Disease
- 10.2.3. Multiple Sclerosis
- 10.2.4. Epilepsy
- 10.2.5. Other Indications
- 10.3. Market Analysis, Insights and Forecast - by End User
- 10.3.1. Patients
- 10.3.2. Providers
- 10.3.3. Payers
- 10.3.4. Other End Users
- 10.1. Market Analysis, Insights and Forecast - by Component
- 11. Competitive Analysis
- 11.1. Global Market Share Analysis 2024
- 11.2. Company Profiles
- 11.2.1 Akili Inc
- 11.2.1.1. Overview
- 11.2.1.2. Products
- 11.2.1.3. SWOT Analysis
- 11.2.1.4. Recent Developments
- 11.2.1.5. Financials (Based on Availability)
- 11.2.2 AdvancedMD Inc
- 11.2.2.1. Overview
- 11.2.2.2. Products
- 11.2.2.3. SWOT Analysis
- 11.2.2.4. Recent Developments
- 11.2.2.5. Financials (Based on Availability)
- 11.2.3 AppliedVR Inc
- 11.2.3.1. Overview
- 11.2.3.2. Products
- 11.2.3.3. SWOT Analysis
- 11.2.3.4. Recent Developments
- 11.2.3.5. Financials (Based on Availability)
- 11.2.4 BigHealth
- 11.2.4.1. Overview
- 11.2.4.2. Products
- 11.2.4.3. SWOT Analysis
- 11.2.4.4. Recent Developments
- 11.2.4.5. Financials (Based on Availability)
- 11.2.5 Blackrock Neurotech
- 11.2.5.1. Overview
- 11.2.5.2. Products
- 11.2.5.3. SWOT Analysis
- 11.2.5.4. Recent Developments
- 11.2.5.5. Financials (Based on Availability)
- 11.2.6 Cognivive Inc
- 11.2.6.1. Overview
- 11.2.6.2. Products
- 11.2.6.3. SWOT Analysis
- 11.2.6.4. Recent Developments
- 11.2.6.5. Financials (Based on Availability)
- 11.2.7 Neofect Co Ltd
- 11.2.7.1. Overview
- 11.2.7.2. Products
- 11.2.7.3. SWOT Analysis
- 11.2.7.4. Recent Developments
- 11.2.7.5. Financials (Based on Availability)
- 11.2.8 Omada Health Inc
- 11.2.8.1. Overview
- 11.2.8.2. Products
- 11.2.8.3. SWOT Analysis
- 11.2.8.4. Recent Developments
- 11.2.8.5. Financials (Based on Availability)
- 11.2.9 Neurotherapeutic Pediatric Therapies Inc
- 11.2.9.1. Overview
- 11.2.9.2. Products
- 11.2.9.3. SWOT Analysis
- 11.2.9.4. Recent Developments
- 11.2.9.5. Financials (Based on Availability)
- 11.2.10 Mindmaze*List Not Exhaustive
- 11.2.10.1. Overview
- 11.2.10.2. Products
- 11.2.10.3. SWOT Analysis
- 11.2.10.4. Recent Developments
- 11.2.10.5. Financials (Based on Availability)
- 11.2.1 Akili Inc
List of Figures
- Figure 1: Global Digital Neurotherapeutics Market Revenue Breakdown (Million, %) by Region 2024 & 2032
- Figure 2: Global Digital Neurotherapeutics Market Volume Breakdown (Million, %) by Region 2024 & 2032
- Figure 3: North America Digital Neurotherapeutics Market Revenue (Million), by Component 2024 & 2032
- Figure 4: North America Digital Neurotherapeutics Market Volume (Million), by Component 2024 & 2032
- Figure 5: North America Digital Neurotherapeutics Market Revenue Share (%), by Component 2024 & 2032
- Figure 6: North America Digital Neurotherapeutics Market Volume Share (%), by Component 2024 & 2032
- Figure 7: North America Digital Neurotherapeutics Market Revenue (Million), by Indication 2024 & 2032
- Figure 8: North America Digital Neurotherapeutics Market Volume (Million), by Indication 2024 & 2032
- Figure 9: North America Digital Neurotherapeutics Market Revenue Share (%), by Indication 2024 & 2032
- Figure 10: North America Digital Neurotherapeutics Market Volume Share (%), by Indication 2024 & 2032
- Figure 11: North America Digital Neurotherapeutics Market Revenue (Million), by End User 2024 & 2032
- Figure 12: North America Digital Neurotherapeutics Market Volume (Million), by End User 2024 & 2032
- Figure 13: North America Digital Neurotherapeutics Market Revenue Share (%), by End User 2024 & 2032
- Figure 14: North America Digital Neurotherapeutics Market Volume Share (%), by End User 2024 & 2032
- Figure 15: North America Digital Neurotherapeutics Market Revenue (Million), by Country 2024 & 2032
- Figure 16: North America Digital Neurotherapeutics Market Volume (Million), by Country 2024 & 2032
- Figure 17: North America Digital Neurotherapeutics Market Revenue Share (%), by Country 2024 & 2032
- Figure 18: North America Digital Neurotherapeutics Market Volume Share (%), by Country 2024 & 2032
- Figure 19: Europe Digital Neurotherapeutics Market Revenue (Million), by Component 2024 & 2032
- Figure 20: Europe Digital Neurotherapeutics Market Volume (Million), by Component 2024 & 2032
- Figure 21: Europe Digital Neurotherapeutics Market Revenue Share (%), by Component 2024 & 2032
- Figure 22: Europe Digital Neurotherapeutics Market Volume Share (%), by Component 2024 & 2032
- Figure 23: Europe Digital Neurotherapeutics Market Revenue (Million), by Indication 2024 & 2032
- Figure 24: Europe Digital Neurotherapeutics Market Volume (Million), by Indication 2024 & 2032
- Figure 25: Europe Digital Neurotherapeutics Market Revenue Share (%), by Indication 2024 & 2032
- Figure 26: Europe Digital Neurotherapeutics Market Volume Share (%), by Indication 2024 & 2032
- Figure 27: Europe Digital Neurotherapeutics Market Revenue (Million), by End User 2024 & 2032
- Figure 28: Europe Digital Neurotherapeutics Market Volume (Million), by End User 2024 & 2032
- Figure 29: Europe Digital Neurotherapeutics Market Revenue Share (%), by End User 2024 & 2032
- Figure 30: Europe Digital Neurotherapeutics Market Volume Share (%), by End User 2024 & 2032
- Figure 31: Europe Digital Neurotherapeutics Market Revenue (Million), by Country 2024 & 2032
- Figure 32: Europe Digital Neurotherapeutics Market Volume (Million), by Country 2024 & 2032
- Figure 33: Europe Digital Neurotherapeutics Market Revenue Share (%), by Country 2024 & 2032
- Figure 34: Europe Digital Neurotherapeutics Market Volume Share (%), by Country 2024 & 2032
- Figure 35: Asia Pacific Digital Neurotherapeutics Market Revenue (Million), by Component 2024 & 2032
- Figure 36: Asia Pacific Digital Neurotherapeutics Market Volume (Million), by Component 2024 & 2032
- Figure 37: Asia Pacific Digital Neurotherapeutics Market Revenue Share (%), by Component 2024 & 2032
- Figure 38: Asia Pacific Digital Neurotherapeutics Market Volume Share (%), by Component 2024 & 2032
- Figure 39: Asia Pacific Digital Neurotherapeutics Market Revenue (Million), by Indication 2024 & 2032
- Figure 40: Asia Pacific Digital Neurotherapeutics Market Volume (Million), by Indication 2024 & 2032
- Figure 41: Asia Pacific Digital Neurotherapeutics Market Revenue Share (%), by Indication 2024 & 2032
- Figure 42: Asia Pacific Digital Neurotherapeutics Market Volume Share (%), by Indication 2024 & 2032
- Figure 43: Asia Pacific Digital Neurotherapeutics Market Revenue (Million), by End User 2024 & 2032
- Figure 44: Asia Pacific Digital Neurotherapeutics Market Volume (Million), by End User 2024 & 2032
- Figure 45: Asia Pacific Digital Neurotherapeutics Market Revenue Share (%), by End User 2024 & 2032
- Figure 46: Asia Pacific Digital Neurotherapeutics Market Volume Share (%), by End User 2024 & 2032
- Figure 47: Asia Pacific Digital Neurotherapeutics Market Revenue (Million), by Country 2024 & 2032
- Figure 48: Asia Pacific Digital Neurotherapeutics Market Volume (Million), by Country 2024 & 2032
- Figure 49: Asia Pacific Digital Neurotherapeutics Market Revenue Share (%), by Country 2024 & 2032
- Figure 50: Asia Pacific Digital Neurotherapeutics Market Volume Share (%), by Country 2024 & 2032
- Figure 51: Middle East and Africa Digital Neurotherapeutics Market Revenue (Million), by Component 2024 & 2032
- Figure 52: Middle East and Africa Digital Neurotherapeutics Market Volume (Million), by Component 2024 & 2032
- Figure 53: Middle East and Africa Digital Neurotherapeutics Market Revenue Share (%), by Component 2024 & 2032
- Figure 54: Middle East and Africa Digital Neurotherapeutics Market Volume Share (%), by Component 2024 & 2032
- Figure 55: Middle East and Africa Digital Neurotherapeutics Market Revenue (Million), by Indication 2024 & 2032
- Figure 56: Middle East and Africa Digital Neurotherapeutics Market Volume (Million), by Indication 2024 & 2032
- Figure 57: Middle East and Africa Digital Neurotherapeutics Market Revenue Share (%), by Indication 2024 & 2032
- Figure 58: Middle East and Africa Digital Neurotherapeutics Market Volume Share (%), by Indication 2024 & 2032
- Figure 59: Middle East and Africa Digital Neurotherapeutics Market Revenue (Million), by End User 2024 & 2032
- Figure 60: Middle East and Africa Digital Neurotherapeutics Market Volume (Million), by End User 2024 & 2032
- Figure 61: Middle East and Africa Digital Neurotherapeutics Market Revenue Share (%), by End User 2024 & 2032
- Figure 62: Middle East and Africa Digital Neurotherapeutics Market Volume Share (%), by End User 2024 & 2032
- Figure 63: Middle East and Africa Digital Neurotherapeutics Market Revenue (Million), by Country 2024 & 2032
- Figure 64: Middle East and Africa Digital Neurotherapeutics Market Volume (Million), by Country 2024 & 2032
- Figure 65: Middle East and Africa Digital Neurotherapeutics Market Revenue Share (%), by Country 2024 & 2032
- Figure 66: Middle East and Africa Digital Neurotherapeutics Market Volume Share (%), by Country 2024 & 2032
- Figure 67: South America Digital Neurotherapeutics Market Revenue (Million), by Component 2024 & 2032
- Figure 68: South America Digital Neurotherapeutics Market Volume (Million), by Component 2024 & 2032
- Figure 69: South America Digital Neurotherapeutics Market Revenue Share (%), by Component 2024 & 2032
- Figure 70: South America Digital Neurotherapeutics Market Volume Share (%), by Component 2024 & 2032
- Figure 71: South America Digital Neurotherapeutics Market Revenue (Million), by Indication 2024 & 2032
- Figure 72: South America Digital Neurotherapeutics Market Volume (Million), by Indication 2024 & 2032
- Figure 73: South America Digital Neurotherapeutics Market Revenue Share (%), by Indication 2024 & 2032
- Figure 74: South America Digital Neurotherapeutics Market Volume Share (%), by Indication 2024 & 2032
- Figure 75: South America Digital Neurotherapeutics Market Revenue (Million), by End User 2024 & 2032
- Figure 76: South America Digital Neurotherapeutics Market Volume (Million), by End User 2024 & 2032
- Figure 77: South America Digital Neurotherapeutics Market Revenue Share (%), by End User 2024 & 2032
- Figure 78: South America Digital Neurotherapeutics Market Volume Share (%), by End User 2024 & 2032
- Figure 79: South America Digital Neurotherapeutics Market Revenue (Million), by Country 2024 & 2032
- Figure 80: South America Digital Neurotherapeutics Market Volume (Million), by Country 2024 & 2032
- Figure 81: South America Digital Neurotherapeutics Market Revenue Share (%), by Country 2024 & 2032
- Figure 82: South America Digital Neurotherapeutics Market Volume Share (%), by Country 2024 & 2032
List of Tables
- Table 1: Global Digital Neurotherapeutics Market Revenue Million Forecast, by Region 2019 & 2032
- Table 2: Global Digital Neurotherapeutics Market Volume Million Forecast, by Region 2019 & 2032
- Table 3: Global Digital Neurotherapeutics Market Revenue Million Forecast, by Component 2019 & 2032
- Table 4: Global Digital Neurotherapeutics Market Volume Million Forecast, by Component 2019 & 2032
- Table 5: Global Digital Neurotherapeutics Market Revenue Million Forecast, by Indication 2019 & 2032
- Table 6: Global Digital Neurotherapeutics Market Volume Million Forecast, by Indication 2019 & 2032
- Table 7: Global Digital Neurotherapeutics Market Revenue Million Forecast, by End User 2019 & 2032
- Table 8: Global Digital Neurotherapeutics Market Volume Million Forecast, by End User 2019 & 2032
- Table 9: Global Digital Neurotherapeutics Market Revenue Million Forecast, by Region 2019 & 2032
- Table 10: Global Digital Neurotherapeutics Market Volume Million Forecast, by Region 2019 & 2032
- Table 11: Global Digital Neurotherapeutics Market Revenue Million Forecast, by Component 2019 & 2032
- Table 12: Global Digital Neurotherapeutics Market Volume Million Forecast, by Component 2019 & 2032
- Table 13: Global Digital Neurotherapeutics Market Revenue Million Forecast, by Indication 2019 & 2032
- Table 14: Global Digital Neurotherapeutics Market Volume Million Forecast, by Indication 2019 & 2032
- Table 15: Global Digital Neurotherapeutics Market Revenue Million Forecast, by End User 2019 & 2032
- Table 16: Global Digital Neurotherapeutics Market Volume Million Forecast, by End User 2019 & 2032
- Table 17: Global Digital Neurotherapeutics Market Revenue Million Forecast, by Country 2019 & 2032
- Table 18: Global Digital Neurotherapeutics Market Volume Million Forecast, by Country 2019 & 2032
- Table 19: United States Digital Neurotherapeutics Market Revenue (Million) Forecast, by Application 2019 & 2032
- Table 20: United States Digital Neurotherapeutics Market Volume (Million) Forecast, by Application 2019 & 2032
- Table 21: Canada Digital Neurotherapeutics Market Revenue (Million) Forecast, by Application 2019 & 2032
- Table 22: Canada Digital Neurotherapeutics Market Volume (Million) Forecast, by Application 2019 & 2032
- Table 23: Mexico Digital Neurotherapeutics Market Revenue (Million) Forecast, by Application 2019 & 2032
- Table 24: Mexico Digital Neurotherapeutics Market Volume (Million) Forecast, by Application 2019 & 2032
- Table 25: Global Digital Neurotherapeutics Market Revenue Million Forecast, by Component 2019 & 2032
- Table 26: Global Digital Neurotherapeutics Market Volume Million Forecast, by Component 2019 & 2032
- Table 27: Global Digital Neurotherapeutics Market Revenue Million Forecast, by Indication 2019 & 2032
- Table 28: Global Digital Neurotherapeutics Market Volume Million Forecast, by Indication 2019 & 2032
- Table 29: Global Digital Neurotherapeutics Market Revenue Million Forecast, by End User 2019 & 2032
- Table 30: Global Digital Neurotherapeutics Market Volume Million Forecast, by End User 2019 & 2032
- Table 31: Global Digital Neurotherapeutics Market Revenue Million Forecast, by Country 2019 & 2032
- Table 32: Global Digital Neurotherapeutics Market Volume Million Forecast, by Country 2019 & 2032
- Table 33: Germany Digital Neurotherapeutics Market Revenue (Million) Forecast, by Application 2019 & 2032
- Table 34: Germany Digital Neurotherapeutics Market Volume (Million) Forecast, by Application 2019 & 2032
- Table 35: United Kingdom Digital Neurotherapeutics Market Revenue (Million) Forecast, by Application 2019 & 2032
- Table 36: United Kingdom Digital Neurotherapeutics Market Volume (Million) Forecast, by Application 2019 & 2032
- Table 37: France Digital Neurotherapeutics Market Revenue (Million) Forecast, by Application 2019 & 2032
- Table 38: France Digital Neurotherapeutics Market Volume (Million) Forecast, by Application 2019 & 2032
- Table 39: Italy Digital Neurotherapeutics Market Revenue (Million) Forecast, by Application 2019 & 2032
- Table 40: Italy Digital Neurotherapeutics Market Volume (Million) Forecast, by Application 2019 & 2032
- Table 41: Spain Digital Neurotherapeutics Market Revenue (Million) Forecast, by Application 2019 & 2032
- Table 42: Spain Digital Neurotherapeutics Market Volume (Million) Forecast, by Application 2019 & 2032
- Table 43: Rest of Europe Digital Neurotherapeutics Market Revenue (Million) Forecast, by Application 2019 & 2032
- Table 44: Rest of Europe Digital Neurotherapeutics Market Volume (Million) Forecast, by Application 2019 & 2032
- Table 45: Global Digital Neurotherapeutics Market Revenue Million Forecast, by Component 2019 & 2032
- Table 46: Global Digital Neurotherapeutics Market Volume Million Forecast, by Component 2019 & 2032
- Table 47: Global Digital Neurotherapeutics Market Revenue Million Forecast, by Indication 2019 & 2032
- Table 48: Global Digital Neurotherapeutics Market Volume Million Forecast, by Indication 2019 & 2032
- Table 49: Global Digital Neurotherapeutics Market Revenue Million Forecast, by End User 2019 & 2032
- Table 50: Global Digital Neurotherapeutics Market Volume Million Forecast, by End User 2019 & 2032
- Table 51: Global Digital Neurotherapeutics Market Revenue Million Forecast, by Country 2019 & 2032
- Table 52: Global Digital Neurotherapeutics Market Volume Million Forecast, by Country 2019 & 2032
- Table 53: China Digital Neurotherapeutics Market Revenue (Million) Forecast, by Application 2019 & 2032
- Table 54: China Digital Neurotherapeutics Market Volume (Million) Forecast, by Application 2019 & 2032
- Table 55: Japan Digital Neurotherapeutics Market Revenue (Million) Forecast, by Application 2019 & 2032
- Table 56: Japan Digital Neurotherapeutics Market Volume (Million) Forecast, by Application 2019 & 2032
- Table 57: India Digital Neurotherapeutics Market Revenue (Million) Forecast, by Application 2019 & 2032
- Table 58: India Digital Neurotherapeutics Market Volume (Million) Forecast, by Application 2019 & 2032
- Table 59: Australia Digital Neurotherapeutics Market Revenue (Million) Forecast, by Application 2019 & 2032
- Table 60: Australia Digital Neurotherapeutics Market Volume (Million) Forecast, by Application 2019 & 2032
- Table 61: South Korea Digital Neurotherapeutics Market Revenue (Million) Forecast, by Application 2019 & 2032
- Table 62: South Korea Digital Neurotherapeutics Market Volume (Million) Forecast, by Application 2019 & 2032
- Table 63: Rest of Asia Pacific Digital Neurotherapeutics Market Revenue (Million) Forecast, by Application 2019 & 2032
- Table 64: Rest of Asia Pacific Digital Neurotherapeutics Market Volume (Million) Forecast, by Application 2019 & 2032
- Table 65: Global Digital Neurotherapeutics Market Revenue Million Forecast, by Component 2019 & 2032
- Table 66: Global Digital Neurotherapeutics Market Volume Million Forecast, by Component 2019 & 2032
- Table 67: Global Digital Neurotherapeutics Market Revenue Million Forecast, by Indication 2019 & 2032
- Table 68: Global Digital Neurotherapeutics Market Volume Million Forecast, by Indication 2019 & 2032
- Table 69: Global Digital Neurotherapeutics Market Revenue Million Forecast, by End User 2019 & 2032
- Table 70: Global Digital Neurotherapeutics Market Volume Million Forecast, by End User 2019 & 2032
- Table 71: Global Digital Neurotherapeutics Market Revenue Million Forecast, by Country 2019 & 2032
- Table 72: Global Digital Neurotherapeutics Market Volume Million Forecast, by Country 2019 & 2032
- Table 73: GCC Digital Neurotherapeutics Market Revenue (Million) Forecast, by Application 2019 & 2032
- Table 74: GCC Digital Neurotherapeutics Market Volume (Million) Forecast, by Application 2019 & 2032
- Table 75: South Africa Digital Neurotherapeutics Market Revenue (Million) Forecast, by Application 2019 & 2032
- Table 76: South Africa Digital Neurotherapeutics Market Volume (Million) Forecast, by Application 2019 & 2032
- Table 77: Rest of Middle East and Africa Digital Neurotherapeutics Market Revenue (Million) Forecast, by Application 2019 & 2032
- Table 78: Rest of Middle East and Africa Digital Neurotherapeutics Market Volume (Million) Forecast, by Application 2019 & 2032
- Table 79: Global Digital Neurotherapeutics Market Revenue Million Forecast, by Component 2019 & 2032
- Table 80: Global Digital Neurotherapeutics Market Volume Million Forecast, by Component 2019 & 2032
- Table 81: Global Digital Neurotherapeutics Market Revenue Million Forecast, by Indication 2019 & 2032
- Table 82: Global Digital Neurotherapeutics Market Volume Million Forecast, by Indication 2019 & 2032
- Table 83: Global Digital Neurotherapeutics Market Revenue Million Forecast, by End User 2019 & 2032
- Table 84: Global Digital Neurotherapeutics Market Volume Million Forecast, by End User 2019 & 2032
- Table 85: Global Digital Neurotherapeutics Market Revenue Million Forecast, by Country 2019 & 2032
- Table 86: Global Digital Neurotherapeutics Market Volume Million Forecast, by Country 2019 & 2032
- Table 87: Brazil Digital Neurotherapeutics Market Revenue (Million) Forecast, by Application 2019 & 2032
- Table 88: Brazil Digital Neurotherapeutics Market Volume (Million) Forecast, by Application 2019 & 2032
- Table 89: Argentina Digital Neurotherapeutics Market Revenue (Million) Forecast, by Application 2019 & 2032
- Table 90: Argentina Digital Neurotherapeutics Market Volume (Million) Forecast, by Application 2019 & 2032
- Table 91: Rest of South America Digital Neurotherapeutics Market Revenue (Million) Forecast, by Application 2019 & 2032
- Table 92: Rest of South America Digital Neurotherapeutics Market Volume (Million) Forecast, by Application 2019 & 2032
Frequently Asked Questions
1. What is the projected Compound Annual Growth Rate (CAGR) of the Digital Neurotherapeutics Market?
The projected CAGR is approximately 19.50%.
2. Which companies are prominent players in the Digital Neurotherapeutics Market?
Key companies in the market include Akili Inc, AdvancedMD Inc, AppliedVR Inc, BigHealth, Blackrock Neurotech, Cognivive Inc, Neofect Co Ltd, Omada Health Inc, Neurotherapeutic Pediatric Therapies Inc, Mindmaze*List Not Exhaustive.
3. What are the main segments of the Digital Neurotherapeutics Market?
The market segments include Component, Indication, End User.
4. Can you provide details about the market size?
The market size is estimated to be USD 362.63 Million as of 2022.
5. What are some drivers contributing to market growth?
Rising Prevalence of Neurological Disorders; Growing Adoption of Digital Technology in Neurology Care.
6. What are the notable trends driving market growth?
The Multiple Sclerosis Segment is Expected to Hold Significant Market Share Over the Forecast Period.
7. Are there any restraints impacting market growth?
Rising Prevalence of Neurological Disorders; Growing Adoption of Digital Technology in Neurology Care.
8. Can you provide examples of recent developments in the market?
February 2024: The University of London's neurotherapeutics group launched the iTalkBetter app. This app provides speech therapy for people with language disorder aphasia, which has been found to improve their ability to talk significantly.
9. What pricing options are available for accessing the report?
Pricing options include single-user, multi-user, and enterprise licenses priced at USD 4750, USD 5250, and USD 8750 respectively.
10. Is the market size provided in terms of value or volume?
The market size is provided in terms of value, measured in Million and volume, measured in Million.
11. Are there any specific market keywords associated with the report?
Yes, the market keyword associated with the report is "Digital Neurotherapeutics Market," which aids in identifying and referencing the specific market segment covered.
12. How do I determine which pricing option suits my needs best?
The pricing options vary based on user requirements and access needs. Individual users may opt for single-user licenses, while businesses requiring broader access may choose multi-user or enterprise licenses for cost-effective access to the report.
13. Are there any additional resources or data provided in the Digital Neurotherapeutics Market report?
While the report offers comprehensive insights, it's advisable to review the specific contents or supplementary materials provided to ascertain if additional resources or data are available.
14. How can I stay updated on further developments or reports in the Digital Neurotherapeutics Market?
To stay informed about further developments, trends, and reports in the Digital Neurotherapeutics Market, consider subscribing to industry newsletters, following relevant companies and organizations, or regularly checking reputable industry news sources and publications.
Methodology
Step 1 - Identification of Relevant Samples Size from Population Database


Step 2 - Approaches for Defining Global Market Size (Value, Volume* & Price*)

Note*: In applicable scenarios
Step 3 - Data Sources
Primary Research
- Web Analytics
- Survey Reports
- Research Institute
- Latest Research Reports
- Opinion Leaders
Secondary Research
- Annual Reports
- White Paper
- Latest Press Release
- Industry Association
- Paid Database
- Investor Presentations

Step 4 - Data Triangulation
Involves using different sources of information in order to increase the validity of a study
These sources are likely to be stakeholders in a program - participants, other researchers, program staff, other community members, and so on.
Then we put all data in single framework & apply various statistical tools to find out the dynamic on the market.
During the analysis stage, feedback from the stakeholder groups would be compared to determine areas of agreement as well as areas of divergence


