
Key Insights
The Contrast Enhanced Ultrasound (CEUS) market is experiencing robust growth, driven by several key factors. The increasing prevalence of chronic diseases such as liver and kidney diseases, cardiovascular disorders, and cancer, is a major catalyst. These conditions often require accurate and timely diagnosis, and CEUS offers a valuable non-invasive imaging modality, providing superior visualization of blood flow and tissue perfusion compared to traditional ultrasound. Technological advancements, such as the development of more sensitive and specific contrast agents and improved ultrasound equipment with higher resolution, are further enhancing the market's growth trajectory. The shift toward minimally invasive procedures and the increasing preference for cost-effective diagnostic tools also contribute significantly to the expanding adoption of CEUS. Furthermore, the rising demand for point-of-care ultrasound in various settings, including emergency rooms and primary care clinics, further fuels market expansion. The global market is segmented by product type (equipment and contrast agents) and technology (targeted and non-targeted), with the targeted CEUS segment expected to demonstrate faster growth due to its enhanced diagnostic capabilities.
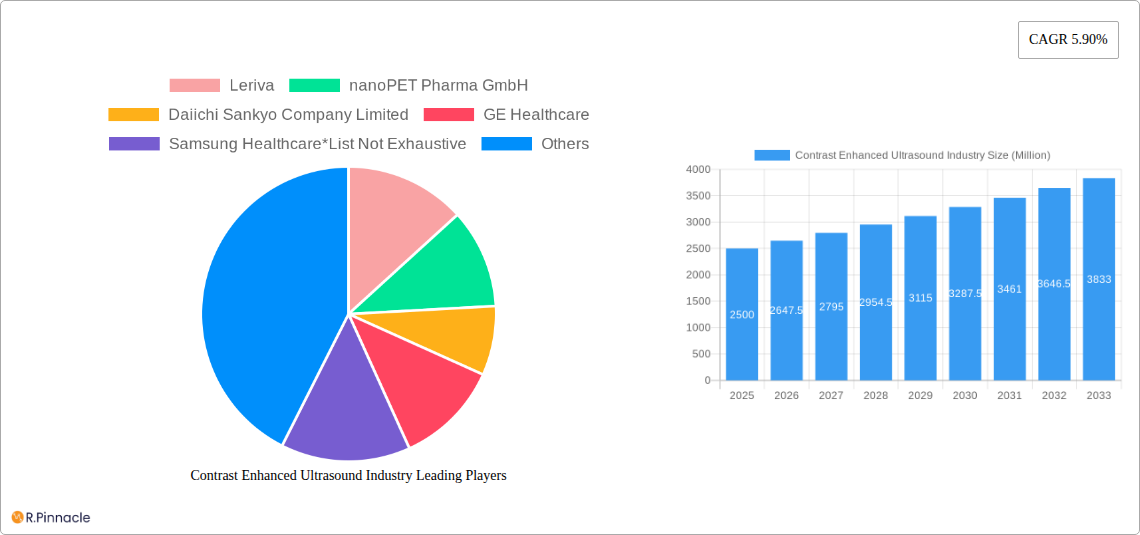
Competitive landscape analysis reveals a mix of established players like GE Healthcare, Siemens Healthineers, and Philips, alongside emerging companies focusing on innovative contrast agents and advanced technologies. The geographic distribution showcases strong market presence in North America and Europe, driven by advanced healthcare infrastructure and high adoption rates. However, the Asia-Pacific region exhibits substantial growth potential due to increasing healthcare expenditure, rising awareness of CEUS advantages, and a growing patient pool. While regulatory hurdles and the availability of alternative imaging techniques might pose some challenges, the overall market outlook for CEUS remains highly positive, with consistent growth anticipated in the coming years, spurred by the aforementioned drivers. The market is projected to maintain a significant compound annual growth rate (CAGR) throughout the forecast period.
Contrast Enhanced Ultrasound (CEUS) Industry Report: 2019-2033
This comprehensive report provides an in-depth analysis of the Contrast Enhanced Ultrasound (CEUS) industry, offering invaluable insights for industry professionals, investors, and strategic decision-makers. With a detailed examination of market dynamics, technological advancements, and competitive landscapes, this report projects a robust future for the CEUS market, reaching xx Million by 2033. The study period covers 2019-2033, with 2025 as the base and estimated year.
Contrast Enhanced Ultrasound Industry Market Structure & Innovation Trends
The CEUS market exhibits a moderately concentrated structure, with key players like GE Healthcare, Philips, and Siemens Healthineers holding significant market share. However, smaller companies and innovative startups are also contributing to market growth through specialized contrast agents and advanced imaging technologies. The market is driven by advancements in ultrasound technology, increasing prevalence of chronic diseases necessitating advanced diagnostic tools, and rising demand for minimally invasive procedures.
- Market Concentration: The top 5 players account for approximately xx% of the global market share in 2025.
- Innovation Drivers: Miniaturization, improved image resolution, AI integration, and targeted contrast agents are key innovation drivers.
- Regulatory Landscape: Stringent regulatory approvals (e.g., FDA 510(k) clearance) influence market entry and product adoption.
- Product Substitutes: Other imaging modalities (CT, MRI) pose competitive threats, though CEUS offers advantages in cost-effectiveness and portability.
- M&A Activity: The past five years have witnessed xx Million in M&A deals, mainly focused on enhancing technological capabilities and expanding market reach. Examples include [mention specific acquisitions if available with deal values].
- End-User Demographics: The primary end-users are hospitals, diagnostic imaging centers, and specialized clinics.
Contrast Enhanced Ultrasound Industry Market Dynamics & Trends
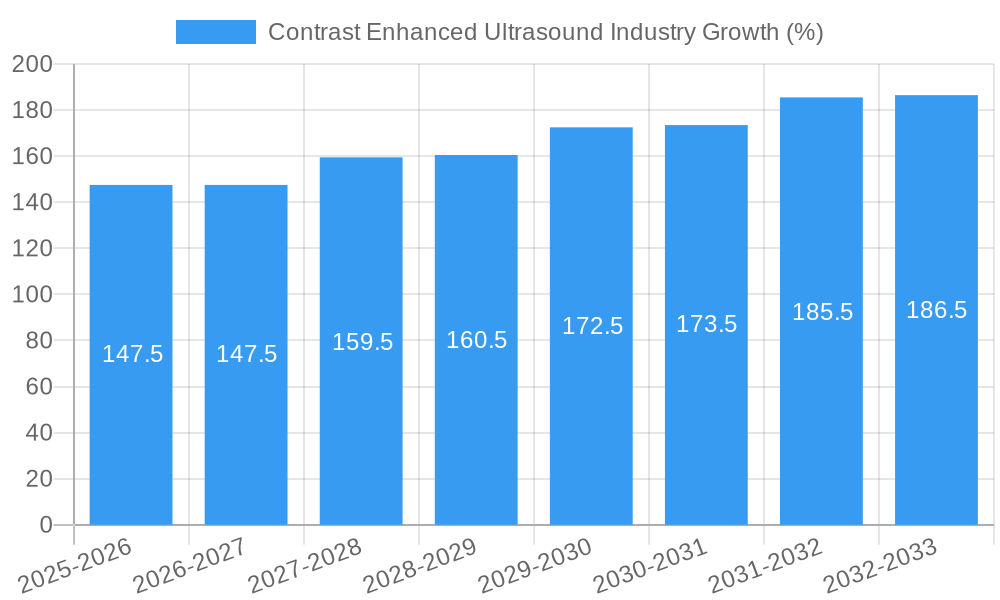
The global CEUS market is experiencing significant growth, driven by factors such as technological advancements, increasing prevalence of liver diseases, and rising demand for non-invasive diagnostic tools. The market is projected to grow at a Compound Annual Growth Rate (CAGR) of xx% during the forecast period (2025-2033). Technological disruptions, such as the integration of AI and machine learning, are improving image analysis and diagnostic accuracy, fueling market expansion. The market penetration of CEUS is increasing in emerging markets due to rising healthcare expenditure and improved healthcare infrastructure. The competitive dynamics are characterized by ongoing innovation, strategic partnerships, and acquisitions, leading to increased market consolidation. The market size is expected to reach xx Million by 2033.
Dominant Regions & Segments in Contrast Enhanced Ultrasound Industry
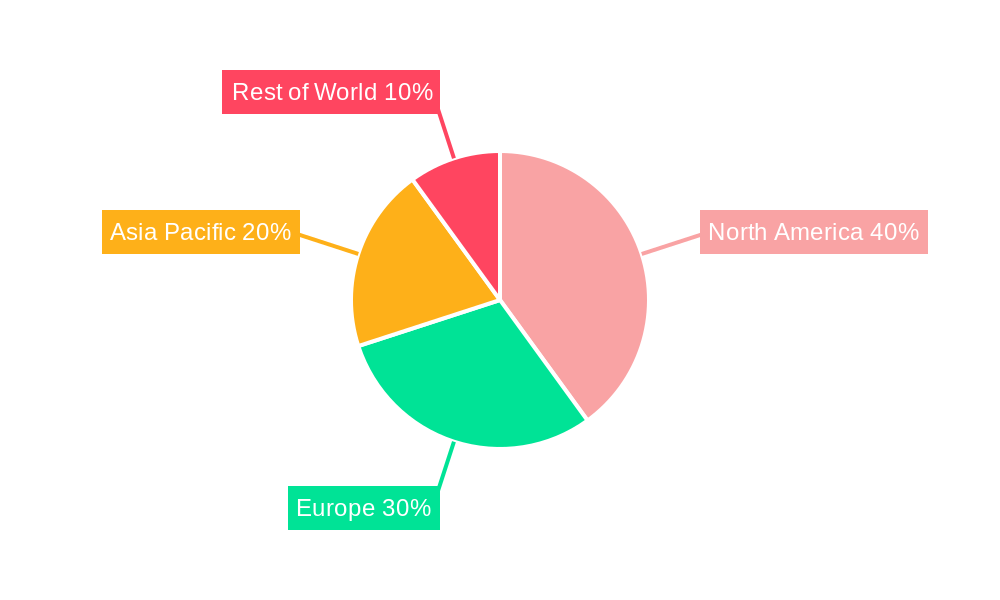
North America currently holds the largest market share due to high adoption rates, advanced healthcare infrastructure, and strong regulatory support. However, Asia-Pacific is witnessing rapid growth fueled by increasing healthcare spending and rising prevalence of chronic diseases.
By Region:
- North America: High adoption of advanced technologies, strong regulatory framework, well-established healthcare infrastructure.
- Europe: Steady growth driven by increasing awareness of CEUS benefits and rising healthcare expenditure.
- Asia-Pacific: Fastest-growing region driven by increasing healthcare expenditure, rising prevalence of liver diseases, and expanding healthcare infrastructure.
By Product Type:
- Equipment: This segment holds the largest share, driven by continuous technological advancements and increased demand for high-quality imaging systems.
- Contrast Agents: The contrast agents segment is expected to experience substantial growth due to the development of new, targeted contrast agents with improved efficacy and safety profiles.
By Technology:
- Non-targeted: This segment currently dominates the market due to its established usage and lower cost.
- Targeted: The targeted contrast agents segment is showing promising growth due to enhanced diagnostic capabilities and improved specificity.
Contrast Enhanced Ultrasound Industry Product Innovations
Recent innovations include the integration of AI for improved image analysis, the development of targeted contrast agents for enhanced specificity, and miniaturized ultrasound systems for improved portability. These innovations improve diagnostic accuracy, reduce procedure times, and expand the range of clinical applications. This is further complemented by the release of new transducers and software updates by major players like Siemens Healthineers and Philips, enhancing the capabilities of existing systems.
Report Scope & Segmentation Analysis
This report segments the CEUS market by product type (Equipment, Contrast Agents) and technology (Non-targeted, Targeted). Each segment’s analysis includes market size, growth projections, and competitive dynamics. The equipment segment is further divided into portable and stationary systems, while the contrast agents segment is classified by type and application. The targeted technology segment is expected to witness faster growth driven by enhanced specificity and accuracy.
Key Drivers of Contrast Enhanced Ultrasound Industry Growth
The CEUS market's growth is propelled by several factors, including the increasing prevalence of liver diseases, a growing preference for minimally invasive diagnostic procedures, continuous technological advancements, and favorable regulatory environments in key markets. The integration of AI and machine learning is also contributing significantly to improved diagnostic accuracy.
Challenges in the Contrast Enhanced Ultrasound Industry Sector
The CEUS market faces challenges such as high initial investment costs for equipment, the need for skilled professionals to operate the systems, and competition from other imaging modalities. Supply chain disruptions and fluctuations in raw material costs also impact market growth. Regulatory hurdles and reimbursement policies further pose challenges to widespread adoption.
Emerging Opportunities in Contrast Enhanced Ultrasound Industry
Emerging opportunities include the development of novel contrast agents with improved safety profiles and enhanced targeting capabilities, the integration of CEUS with other imaging modalities for advanced diagnostics, and expansion into new clinical applications. The rising demand in emerging economies also presents significant growth potential.
Leading Players in the Contrast Enhanced Ultrasound Industry Market
- Leriva
- nanoPET Pharma GmbH
- Daiichi Sankyo Company Limited
- GE Healthcare
- Samsung Healthcare
- Trivitron Healthcare Pvt Ltd
- Siemens Healthineers AG
- Lantheus Medical Imaging Inc
- Bracco Diagnostic Inc
- Koninklijke Philips NV
- Esaote SPA
- Shenzhen Mindray Bio-Medical Electronics Co Ltd
Key Developments in Contrast Enhanced Ultrasound Industry
- June 2022: Siemens Healthineers launched its refreshed Acuson ultrasound systems, featuring new transducers with CEUS capabilities and extended battery life.
- November 2021: Royal Philips received FDA 510(k) clearance for its Liver Fat Quantification tools, enhancing its ultrasound systems' capabilities for liver assessment.
Future Outlook for Contrast Enhanced Ultrasound Industry Market
The CEUS market is poised for continued growth driven by technological advancements, increasing demand for minimally invasive procedures, and rising prevalence of chronic diseases. Strategic partnerships, acquisitions, and expansion into new applications will further shape market dynamics. The market is expected to witness significant expansion in emerging markets with improved healthcare infrastructure.
Contrast Enhanced Ultrasound Industry Segmentation
-
1. Product Type
- 1.1. Equipment
- 1.2. Contrast Agents
-
2. Technology
- 2.1. Non-targeted
- 2.2. Targeted
Contrast Enhanced Ultrasound Industry Segmentation By Geography
-
1. North America
- 1.1. United States
- 1.2. Canada
- 1.3. Mexico
-
2. Europe
- 2.1. Germany
- 2.2. United Kingdom
- 2.3. France
- 2.4. Italy
- 2.5. Spain
- 2.6. Rest of Europe
-
3. Asia Pacific
- 3.1. China
- 3.2. Japan
- 3.3. India
- 3.4. Australia
- 3.5. South Korea
- 3.6. Rest of Asia Pacific
-
4. Middle East and Africa
- 4.1. GCC
- 4.2. South Africa
- 4.3. Rest of Middle East and Africa
-
5. South America
- 5.1. Brazil
- 5.2. Argentina
- 5.3. Rest of South America
Contrast Enhanced Ultrasound Industry REPORT HIGHLIGHTS
| Aspects | Details |
|---|---|
| Study Period | 2019-2033 |
| Base Year | 2024 |
| Estimated Year | 2025 |
| Forecast Period | 2025-2033 |
| Historical Period | 2019-2024 |
| Growth Rate | CAGR of 5.90% from 2019-2033 |
| Segmentation |
|
Table of Contents
- 1. Introduction
- 1.1. Research Scope
- 1.2. Market Segmentation
- 1.3. Research Methodology
- 1.4. Definitions and Assumptions
- 2. Executive Summary
- 2.1. Introduction
- 3. Market Dynamics
- 3.1. Introduction
- 3.2. Market Drivers
- 3.2.1. Increasing Prevalence of Long-term Diseases and Complex Comorbidities; Technical Advancements in Contrast-enhanced Ultrasound Imaging; Increasing Investments by Government and Private Organization
- 3.3. Market Restrains
- 3.3.1. High Cost Associated with the Devices and Procedures; Shortage of Helium
- 3.4. Market Trends
- 3.4.1. Contrast Agent Segment is Expected to Grow During the Forecast Period
- 4. Market Factor Analysis
- 4.1. Porters Five Forces
- 4.2. Supply/Value Chain
- 4.3. PESTEL analysis
- 4.4. Market Entropy
- 4.5. Patent/Trademark Analysis
- 5. Global Contrast Enhanced Ultrasound Industry Analysis, Insights and Forecast, 2019-2031
- 5.1. Market Analysis, Insights and Forecast - by Product Type
- 5.1.1. Equipment
- 5.1.2. Contrast Agents
- 5.2. Market Analysis, Insights and Forecast - by Technology
- 5.2.1. Non-targeted
- 5.2.2. Targeted
- 5.3. Market Analysis, Insights and Forecast - by Region
- 5.3.1. North America
- 5.3.2. Europe
- 5.3.3. Asia Pacific
- 5.3.4. Middle East and Africa
- 5.3.5. South America
- 5.1. Market Analysis, Insights and Forecast - by Product Type
- 6. North America Contrast Enhanced Ultrasound Industry Analysis, Insights and Forecast, 2019-2031
- 6.1. Market Analysis, Insights and Forecast - by Product Type
- 6.1.1. Equipment
- 6.1.2. Contrast Agents
- 6.2. Market Analysis, Insights and Forecast - by Technology
- 6.2.1. Non-targeted
- 6.2.2. Targeted
- 6.1. Market Analysis, Insights and Forecast - by Product Type
- 7. Europe Contrast Enhanced Ultrasound Industry Analysis, Insights and Forecast, 2019-2031
- 7.1. Market Analysis, Insights and Forecast - by Product Type
- 7.1.1. Equipment
- 7.1.2. Contrast Agents
- 7.2. Market Analysis, Insights and Forecast - by Technology
- 7.2.1. Non-targeted
- 7.2.2. Targeted
- 7.1. Market Analysis, Insights and Forecast - by Product Type
- 8. Asia Pacific Contrast Enhanced Ultrasound Industry Analysis, Insights and Forecast, 2019-2031
- 8.1. Market Analysis, Insights and Forecast - by Product Type
- 8.1.1. Equipment
- 8.1.2. Contrast Agents
- 8.2. Market Analysis, Insights and Forecast - by Technology
- 8.2.1. Non-targeted
- 8.2.2. Targeted
- 8.1. Market Analysis, Insights and Forecast - by Product Type
- 9. Middle East and Africa Contrast Enhanced Ultrasound Industry Analysis, Insights and Forecast, 2019-2031
- 9.1. Market Analysis, Insights and Forecast - by Product Type
- 9.1.1. Equipment
- 9.1.2. Contrast Agents
- 9.2. Market Analysis, Insights and Forecast - by Technology
- 9.2.1. Non-targeted
- 9.2.2. Targeted
- 9.1. Market Analysis, Insights and Forecast - by Product Type
- 10. South America Contrast Enhanced Ultrasound Industry Analysis, Insights and Forecast, 2019-2031
- 10.1. Market Analysis, Insights and Forecast - by Product Type
- 10.1.1. Equipment
- 10.1.2. Contrast Agents
- 10.2. Market Analysis, Insights and Forecast - by Technology
- 10.2.1. Non-targeted
- 10.2.2. Targeted
- 10.1. Market Analysis, Insights and Forecast - by Product Type
- 11. North America Contrast Enhanced Ultrasound Industry Analysis, Insights and Forecast, 2019-2031
- 11.1. Market Analysis, Insights and Forecast - By Country/Sub-region
- 11.1.1 United States
- 11.1.2 Canada
- 11.1.3 Mexico
- 12. Europe Contrast Enhanced Ultrasound Industry Analysis, Insights and Forecast, 2019-2031
- 12.1. Market Analysis, Insights and Forecast - By Country/Sub-region
- 12.1.1 Germany
- 12.1.2 United Kingdom
- 12.1.3 France
- 12.1.4 Italy
- 12.1.5 Spain
- 12.1.6 Rest of Europe
- 13. Asia Pacific Contrast Enhanced Ultrasound Industry Analysis, Insights and Forecast, 2019-2031
- 13.1. Market Analysis, Insights and Forecast - By Country/Sub-region
- 13.1.1 China
- 13.1.2 Japan
- 13.1.3 India
- 13.1.4 Australia
- 13.1.5 South Korea
- 13.1.6 Rest of Asia Pacific
- 14. Middle East and Africa Contrast Enhanced Ultrasound Industry Analysis, Insights and Forecast, 2019-2031
- 14.1. Market Analysis, Insights and Forecast - By Country/Sub-region
- 14.1.1 GCC
- 14.1.2 South Africa
- 14.1.3 Rest of Middle East and Africa
- 15. South America Contrast Enhanced Ultrasound Industry Analysis, Insights and Forecast, 2019-2031
- 15.1. Market Analysis, Insights and Forecast - By Country/Sub-region
- 15.1.1 Brazil
- 15.1.2 Argentina
- 15.1.3 Rest of South America
- 16. Competitive Analysis
- 16.1. Global Market Share Analysis 2024
- 16.2. Company Profiles
- 16.2.1 Leriva
- 16.2.1.1. Overview
- 16.2.1.2. Products
- 16.2.1.3. SWOT Analysis
- 16.2.1.4. Recent Developments
- 16.2.1.5. Financials (Based on Availability)
- 16.2.2 nanoPET Pharma GmbH
- 16.2.2.1. Overview
- 16.2.2.2. Products
- 16.2.2.3. SWOT Analysis
- 16.2.2.4. Recent Developments
- 16.2.2.5. Financials (Based on Availability)
- 16.2.3 Daiichi Sankyo Company Limited
- 16.2.3.1. Overview
- 16.2.3.2. Products
- 16.2.3.3. SWOT Analysis
- 16.2.3.4. Recent Developments
- 16.2.3.5. Financials (Based on Availability)
- 16.2.4 GE Healthcare
- 16.2.4.1. Overview
- 16.2.4.2. Products
- 16.2.4.3. SWOT Analysis
- 16.2.4.4. Recent Developments
- 16.2.4.5. Financials (Based on Availability)
- 16.2.5 Samsung Healthcare*List Not Exhaustive
- 16.2.5.1. Overview
- 16.2.5.2. Products
- 16.2.5.3. SWOT Analysis
- 16.2.5.4. Recent Developments
- 16.2.5.5. Financials (Based on Availability)
- 16.2.6 Trivitron Healthcare Pvt Ltd
- 16.2.6.1. Overview
- 16.2.6.2. Products
- 16.2.6.3. SWOT Analysis
- 16.2.6.4. Recent Developments
- 16.2.6.5. Financials (Based on Availability)
- 16.2.7 Siemens Healthineers AG
- 16.2.7.1. Overview
- 16.2.7.2. Products
- 16.2.7.3. SWOT Analysis
- 16.2.7.4. Recent Developments
- 16.2.7.5. Financials (Based on Availability)
- 16.2.8 Lantheus Medical Imaging Inc
- 16.2.8.1. Overview
- 16.2.8.2. Products
- 16.2.8.3. SWOT Analysis
- 16.2.8.4. Recent Developments
- 16.2.8.5. Financials (Based on Availability)
- 16.2.9 Bracco Diagnostic Inc
- 16.2.9.1. Overview
- 16.2.9.2. Products
- 16.2.9.3. SWOT Analysis
- 16.2.9.4. Recent Developments
- 16.2.9.5. Financials (Based on Availability)
- 16.2.10 Koninklijke Philips NV
- 16.2.10.1. Overview
- 16.2.10.2. Products
- 16.2.10.3. SWOT Analysis
- 16.2.10.4. Recent Developments
- 16.2.10.5. Financials (Based on Availability)
- 16.2.11 Esaote SPA
- 16.2.11.1. Overview
- 16.2.11.2. Products
- 16.2.11.3. SWOT Analysis
- 16.2.11.4. Recent Developments
- 16.2.11.5. Financials (Based on Availability)
- 16.2.12 Shenzhen Mindray Bio-Medical Electronics Co Ltd
- 16.2.12.1. Overview
- 16.2.12.2. Products
- 16.2.12.3. SWOT Analysis
- 16.2.12.4. Recent Developments
- 16.2.12.5. Financials (Based on Availability)
- 16.2.1 Leriva
List of Figures
- Figure 1: Global Contrast Enhanced Ultrasound Industry Revenue Breakdown (Million, %) by Region 2024 & 2032
- Figure 2: North America Contrast Enhanced Ultrasound Industry Revenue (Million), by Country 2024 & 2032
- Figure 3: North America Contrast Enhanced Ultrasound Industry Revenue Share (%), by Country 2024 & 2032
- Figure 4: Europe Contrast Enhanced Ultrasound Industry Revenue (Million), by Country 2024 & 2032
- Figure 5: Europe Contrast Enhanced Ultrasound Industry Revenue Share (%), by Country 2024 & 2032
- Figure 6: Asia Pacific Contrast Enhanced Ultrasound Industry Revenue (Million), by Country 2024 & 2032
- Figure 7: Asia Pacific Contrast Enhanced Ultrasound Industry Revenue Share (%), by Country 2024 & 2032
- Figure 8: Middle East and Africa Contrast Enhanced Ultrasound Industry Revenue (Million), by Country 2024 & 2032
- Figure 9: Middle East and Africa Contrast Enhanced Ultrasound Industry Revenue Share (%), by Country 2024 & 2032
- Figure 10: South America Contrast Enhanced Ultrasound Industry Revenue (Million), by Country 2024 & 2032
- Figure 11: South America Contrast Enhanced Ultrasound Industry Revenue Share (%), by Country 2024 & 2032
- Figure 12: North America Contrast Enhanced Ultrasound Industry Revenue (Million), by Product Type 2024 & 2032
- Figure 13: North America Contrast Enhanced Ultrasound Industry Revenue Share (%), by Product Type 2024 & 2032
- Figure 14: North America Contrast Enhanced Ultrasound Industry Revenue (Million), by Technology 2024 & 2032
- Figure 15: North America Contrast Enhanced Ultrasound Industry Revenue Share (%), by Technology 2024 & 2032
- Figure 16: North America Contrast Enhanced Ultrasound Industry Revenue (Million), by Country 2024 & 2032
- Figure 17: North America Contrast Enhanced Ultrasound Industry Revenue Share (%), by Country 2024 & 2032
- Figure 18: Europe Contrast Enhanced Ultrasound Industry Revenue (Million), by Product Type 2024 & 2032
- Figure 19: Europe Contrast Enhanced Ultrasound Industry Revenue Share (%), by Product Type 2024 & 2032
- Figure 20: Europe Contrast Enhanced Ultrasound Industry Revenue (Million), by Technology 2024 & 2032
- Figure 21: Europe Contrast Enhanced Ultrasound Industry Revenue Share (%), by Technology 2024 & 2032
- Figure 22: Europe Contrast Enhanced Ultrasound Industry Revenue (Million), by Country 2024 & 2032
- Figure 23: Europe Contrast Enhanced Ultrasound Industry Revenue Share (%), by Country 2024 & 2032
- Figure 24: Asia Pacific Contrast Enhanced Ultrasound Industry Revenue (Million), by Product Type 2024 & 2032
- Figure 25: Asia Pacific Contrast Enhanced Ultrasound Industry Revenue Share (%), by Product Type 2024 & 2032
- Figure 26: Asia Pacific Contrast Enhanced Ultrasound Industry Revenue (Million), by Technology 2024 & 2032
- Figure 27: Asia Pacific Contrast Enhanced Ultrasound Industry Revenue Share (%), by Technology 2024 & 2032
- Figure 28: Asia Pacific Contrast Enhanced Ultrasound Industry Revenue (Million), by Country 2024 & 2032
- Figure 29: Asia Pacific Contrast Enhanced Ultrasound Industry Revenue Share (%), by Country 2024 & 2032
- Figure 30: Middle East and Africa Contrast Enhanced Ultrasound Industry Revenue (Million), by Product Type 2024 & 2032
- Figure 31: Middle East and Africa Contrast Enhanced Ultrasound Industry Revenue Share (%), by Product Type 2024 & 2032
- Figure 32: Middle East and Africa Contrast Enhanced Ultrasound Industry Revenue (Million), by Technology 2024 & 2032
- Figure 33: Middle East and Africa Contrast Enhanced Ultrasound Industry Revenue Share (%), by Technology 2024 & 2032
- Figure 34: Middle East and Africa Contrast Enhanced Ultrasound Industry Revenue (Million), by Country 2024 & 2032
- Figure 35: Middle East and Africa Contrast Enhanced Ultrasound Industry Revenue Share (%), by Country 2024 & 2032
- Figure 36: South America Contrast Enhanced Ultrasound Industry Revenue (Million), by Product Type 2024 & 2032
- Figure 37: South America Contrast Enhanced Ultrasound Industry Revenue Share (%), by Product Type 2024 & 2032
- Figure 38: South America Contrast Enhanced Ultrasound Industry Revenue (Million), by Technology 2024 & 2032
- Figure 39: South America Contrast Enhanced Ultrasound Industry Revenue Share (%), by Technology 2024 & 2032
- Figure 40: South America Contrast Enhanced Ultrasound Industry Revenue (Million), by Country 2024 & 2032
- Figure 41: South America Contrast Enhanced Ultrasound Industry Revenue Share (%), by Country 2024 & 2032
List of Tables
- Table 1: Global Contrast Enhanced Ultrasound Industry Revenue Million Forecast, by Region 2019 & 2032
- Table 2: Global Contrast Enhanced Ultrasound Industry Revenue Million Forecast, by Product Type 2019 & 2032
- Table 3: Global Contrast Enhanced Ultrasound Industry Revenue Million Forecast, by Technology 2019 & 2032
- Table 4: Global Contrast Enhanced Ultrasound Industry Revenue Million Forecast, by Region 2019 & 2032
- Table 5: Global Contrast Enhanced Ultrasound Industry Revenue Million Forecast, by Country 2019 & 2032
- Table 6: United States Contrast Enhanced Ultrasound Industry Revenue (Million) Forecast, by Application 2019 & 2032
- Table 7: Canada Contrast Enhanced Ultrasound Industry Revenue (Million) Forecast, by Application 2019 & 2032
- Table 8: Mexico Contrast Enhanced Ultrasound Industry Revenue (Million) Forecast, by Application 2019 & 2032
- Table 9: Global Contrast Enhanced Ultrasound Industry Revenue Million Forecast, by Country 2019 & 2032
- Table 10: Germany Contrast Enhanced Ultrasound Industry Revenue (Million) Forecast, by Application 2019 & 2032
- Table 11: United Kingdom Contrast Enhanced Ultrasound Industry Revenue (Million) Forecast, by Application 2019 & 2032
- Table 12: France Contrast Enhanced Ultrasound Industry Revenue (Million) Forecast, by Application 2019 & 2032
- Table 13: Italy Contrast Enhanced Ultrasound Industry Revenue (Million) Forecast, by Application 2019 & 2032
- Table 14: Spain Contrast Enhanced Ultrasound Industry Revenue (Million) Forecast, by Application 2019 & 2032
- Table 15: Rest of Europe Contrast Enhanced Ultrasound Industry Revenue (Million) Forecast, by Application 2019 & 2032
- Table 16: Global Contrast Enhanced Ultrasound Industry Revenue Million Forecast, by Country 2019 & 2032
- Table 17: China Contrast Enhanced Ultrasound Industry Revenue (Million) Forecast, by Application 2019 & 2032
- Table 18: Japan Contrast Enhanced Ultrasound Industry Revenue (Million) Forecast, by Application 2019 & 2032
- Table 19: India Contrast Enhanced Ultrasound Industry Revenue (Million) Forecast, by Application 2019 & 2032
- Table 20: Australia Contrast Enhanced Ultrasound Industry Revenue (Million) Forecast, by Application 2019 & 2032
- Table 21: South Korea Contrast Enhanced Ultrasound Industry Revenue (Million) Forecast, by Application 2019 & 2032
- Table 22: Rest of Asia Pacific Contrast Enhanced Ultrasound Industry Revenue (Million) Forecast, by Application 2019 & 2032
- Table 23: Global Contrast Enhanced Ultrasound Industry Revenue Million Forecast, by Country 2019 & 2032
- Table 24: GCC Contrast Enhanced Ultrasound Industry Revenue (Million) Forecast, by Application 2019 & 2032
- Table 25: South Africa Contrast Enhanced Ultrasound Industry Revenue (Million) Forecast, by Application 2019 & 2032
- Table 26: Rest of Middle East and Africa Contrast Enhanced Ultrasound Industry Revenue (Million) Forecast, by Application 2019 & 2032
- Table 27: Global Contrast Enhanced Ultrasound Industry Revenue Million Forecast, by Country 2019 & 2032
- Table 28: Brazil Contrast Enhanced Ultrasound Industry Revenue (Million) Forecast, by Application 2019 & 2032
- Table 29: Argentina Contrast Enhanced Ultrasound Industry Revenue (Million) Forecast, by Application 2019 & 2032
- Table 30: Rest of South America Contrast Enhanced Ultrasound Industry Revenue (Million) Forecast, by Application 2019 & 2032
- Table 31: Global Contrast Enhanced Ultrasound Industry Revenue Million Forecast, by Product Type 2019 & 2032
- Table 32: Global Contrast Enhanced Ultrasound Industry Revenue Million Forecast, by Technology 2019 & 2032
- Table 33: Global Contrast Enhanced Ultrasound Industry Revenue Million Forecast, by Country 2019 & 2032
- Table 34: United States Contrast Enhanced Ultrasound Industry Revenue (Million) Forecast, by Application 2019 & 2032
- Table 35: Canada Contrast Enhanced Ultrasound Industry Revenue (Million) Forecast, by Application 2019 & 2032
- Table 36: Mexico Contrast Enhanced Ultrasound Industry Revenue (Million) Forecast, by Application 2019 & 2032
- Table 37: Global Contrast Enhanced Ultrasound Industry Revenue Million Forecast, by Product Type 2019 & 2032
- Table 38: Global Contrast Enhanced Ultrasound Industry Revenue Million Forecast, by Technology 2019 & 2032
- Table 39: Global Contrast Enhanced Ultrasound Industry Revenue Million Forecast, by Country 2019 & 2032
- Table 40: Germany Contrast Enhanced Ultrasound Industry Revenue (Million) Forecast, by Application 2019 & 2032
- Table 41: United Kingdom Contrast Enhanced Ultrasound Industry Revenue (Million) Forecast, by Application 2019 & 2032
- Table 42: France Contrast Enhanced Ultrasound Industry Revenue (Million) Forecast, by Application 2019 & 2032
- Table 43: Italy Contrast Enhanced Ultrasound Industry Revenue (Million) Forecast, by Application 2019 & 2032
- Table 44: Spain Contrast Enhanced Ultrasound Industry Revenue (Million) Forecast, by Application 2019 & 2032
- Table 45: Rest of Europe Contrast Enhanced Ultrasound Industry Revenue (Million) Forecast, by Application 2019 & 2032
- Table 46: Global Contrast Enhanced Ultrasound Industry Revenue Million Forecast, by Product Type 2019 & 2032
- Table 47: Global Contrast Enhanced Ultrasound Industry Revenue Million Forecast, by Technology 2019 & 2032
- Table 48: Global Contrast Enhanced Ultrasound Industry Revenue Million Forecast, by Country 2019 & 2032
- Table 49: China Contrast Enhanced Ultrasound Industry Revenue (Million) Forecast, by Application 2019 & 2032
- Table 50: Japan Contrast Enhanced Ultrasound Industry Revenue (Million) Forecast, by Application 2019 & 2032
- Table 51: India Contrast Enhanced Ultrasound Industry Revenue (Million) Forecast, by Application 2019 & 2032
- Table 52: Australia Contrast Enhanced Ultrasound Industry Revenue (Million) Forecast, by Application 2019 & 2032
- Table 53: South Korea Contrast Enhanced Ultrasound Industry Revenue (Million) Forecast, by Application 2019 & 2032
- Table 54: Rest of Asia Pacific Contrast Enhanced Ultrasound Industry Revenue (Million) Forecast, by Application 2019 & 2032
- Table 55: Global Contrast Enhanced Ultrasound Industry Revenue Million Forecast, by Product Type 2019 & 2032
- Table 56: Global Contrast Enhanced Ultrasound Industry Revenue Million Forecast, by Technology 2019 & 2032
- Table 57: Global Contrast Enhanced Ultrasound Industry Revenue Million Forecast, by Country 2019 & 2032
- Table 58: GCC Contrast Enhanced Ultrasound Industry Revenue (Million) Forecast, by Application 2019 & 2032
- Table 59: South Africa Contrast Enhanced Ultrasound Industry Revenue (Million) Forecast, by Application 2019 & 2032
- Table 60: Rest of Middle East and Africa Contrast Enhanced Ultrasound Industry Revenue (Million) Forecast, by Application 2019 & 2032
- Table 61: Global Contrast Enhanced Ultrasound Industry Revenue Million Forecast, by Product Type 2019 & 2032
- Table 62: Global Contrast Enhanced Ultrasound Industry Revenue Million Forecast, by Technology 2019 & 2032
- Table 63: Global Contrast Enhanced Ultrasound Industry Revenue Million Forecast, by Country 2019 & 2032
- Table 64: Brazil Contrast Enhanced Ultrasound Industry Revenue (Million) Forecast, by Application 2019 & 2032
- Table 65: Argentina Contrast Enhanced Ultrasound Industry Revenue (Million) Forecast, by Application 2019 & 2032
- Table 66: Rest of South America Contrast Enhanced Ultrasound Industry Revenue (Million) Forecast, by Application 2019 & 2032
Frequently Asked Questions
1. What is the projected Compound Annual Growth Rate (CAGR) of the Contrast Enhanced Ultrasound Industry?
The projected CAGR is approximately 5.90%.
2. Which companies are prominent players in the Contrast Enhanced Ultrasound Industry?
Key companies in the market include Leriva, nanoPET Pharma GmbH, Daiichi Sankyo Company Limited, GE Healthcare, Samsung Healthcare*List Not Exhaustive, Trivitron Healthcare Pvt Ltd, Siemens Healthineers AG, Lantheus Medical Imaging Inc, Bracco Diagnostic Inc, Koninklijke Philips NV, Esaote SPA, Shenzhen Mindray Bio-Medical Electronics Co Ltd.
3. What are the main segments of the Contrast Enhanced Ultrasound Industry?
The market segments include Product Type, Technology.
4. Can you provide details about the market size?
The market size is estimated to be USD XX Million as of 2022.
5. What are some drivers contributing to market growth?
Increasing Prevalence of Long-term Diseases and Complex Comorbidities; Technical Advancements in Contrast-enhanced Ultrasound Imaging; Increasing Investments by Government and Private Organization.
6. What are the notable trends driving market growth?
Contrast Agent Segment is Expected to Grow During the Forecast Period.
7. Are there any restraints impacting market growth?
High Cost Associated with the Devices and Procedures; Shortage of Helium.
8. Can you provide examples of recent developments in the market?
In June 2022, Siemens Healthineers launched its refreshed Acuson family of ultrasounds at the European Congress of Radiology (ECR) in Vienna. The company introduced 12 new transducers across four ultrasound systems, including the Acuson Juniper 2.0 Integrated Battery Support. This allows up to 75 minutes of unplugged scanning for a rapid bedside assessment, and providers can access the new 6C1 single crystal transducer equipped with contrast-enhanced ultrasound (CEUS) and liver elastography to deliver a comprehensive liver evaluation.
9. What pricing options are available for accessing the report?
Pricing options include single-user, multi-user, and enterprise licenses priced at USD 4750, USD 5250, and USD 8750 respectively.
10. Is the market size provided in terms of value or volume?
The market size is provided in terms of value, measured in Million.
11. Are there any specific market keywords associated with the report?
Yes, the market keyword associated with the report is "Contrast Enhanced Ultrasound Industry," which aids in identifying and referencing the specific market segment covered.
12. How do I determine which pricing option suits my needs best?
The pricing options vary based on user requirements and access needs. Individual users may opt for single-user licenses, while businesses requiring broader access may choose multi-user or enterprise licenses for cost-effective access to the report.
13. Are there any additional resources or data provided in the Contrast Enhanced Ultrasound Industry report?
While the report offers comprehensive insights, it's advisable to review the specific contents or supplementary materials provided to ascertain if additional resources or data are available.
14. How can I stay updated on further developments or reports in the Contrast Enhanced Ultrasound Industry?
To stay informed about further developments, trends, and reports in the Contrast Enhanced Ultrasound Industry, consider subscribing to industry newsletters, following relevant companies and organizations, or regularly checking reputable industry news sources and publications.
Methodology
Step 1 - Identification of Relevant Samples Size from Population Database


Step 2 - Approaches for Defining Global Market Size (Value, Volume* & Price*)

Note*: In applicable scenarios
Step 3 - Data Sources
Primary Research
- Web Analytics
- Survey Reports
- Research Institute
- Latest Research Reports
- Opinion Leaders
Secondary Research
- Annual Reports
- White Paper
- Latest Press Release
- Industry Association
- Paid Database
- Investor Presentations

Step 4 - Data Triangulation
Involves using different sources of information in order to increase the validity of a study
These sources are likely to be stakeholders in a program - participants, other researchers, program staff, other community members, and so on.
Then we put all data in single framework & apply various statistical tools to find out the dynamic on the market.
During the analysis stage, feedback from the stakeholder groups would be compared to determine areas of agreement as well as areas of divergence


