
Key Insights
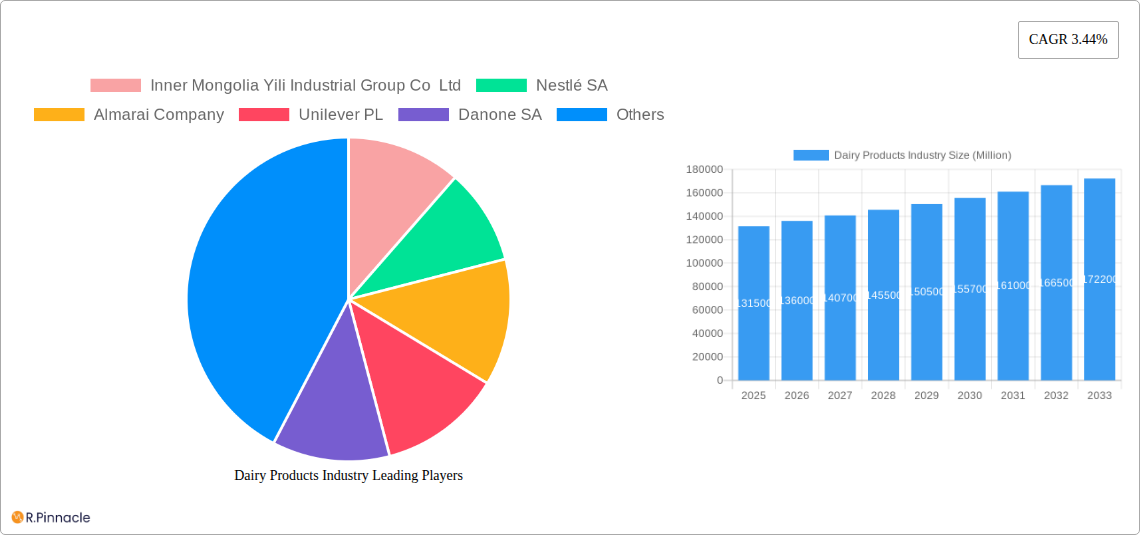
The global dairy products market, valued at $131.5 billion in 2025, is projected to experience steady growth, driven by rising global populations and increasing demand for convenient and nutritious food options. A Compound Annual Growth Rate (CAGR) of 3.44% from 2025 to 2033 suggests a substantial market expansion over the forecast period. Key growth drivers include the rising popularity of dairy-based functional foods and beverages, catering to health-conscious consumers seeking enhanced nutritional benefits. Furthermore, the increasing adoption of innovative packaging solutions, extending shelf life and improving product preservation, is contributing to market expansion. Geographic expansion into developing markets with growing disposable incomes will also fuel growth. However, fluctuating milk prices due to factors like climate change and animal diseases represent a significant restraint. Furthermore, growing concerns regarding lactose intolerance and the rise of plant-based alternatives pose challenges to the industry's continued growth. Market segmentation reveals a diverse landscape, with off-trade channels (supermarkets and convenience stores) holding a larger share than on-trade (restaurants and cafes). Within product categories, milk remains dominant, followed by yogurt and cheese, with continuous innovation in product offerings like Greek yogurt and specialty cheeses driving segment-specific growth. Major players such as Nestle, Danone, and Yili are investing heavily in R&D and strategic acquisitions to maintain their market positions and capitalize on emerging trends.
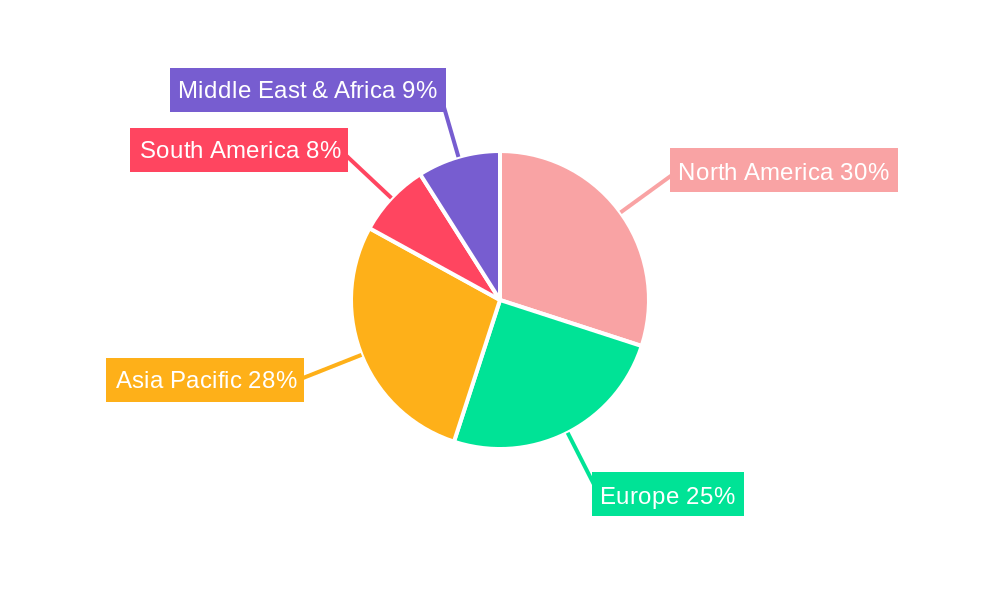
The distribution channels will continue to evolve, with online sales gaining traction. The industry faces increasing pressure to enhance sustainability practices throughout its supply chain in response to growing environmental concerns. Regional variations in market dynamics exist, with North America and Europe holding significant market share, while the Asia-Pacific region shows considerable potential for future growth, driven by rapid economic development and changing dietary habits. The competitive landscape is highly consolidated, with leading players constantly engaged in innovation and market consolidation strategies. The forecast period (2025-2033) will likely witness continued product diversification, strategic partnerships, and a strong focus on sustainability to address emerging consumer preferences and regulatory changes. Successful players will need to effectively navigate the challenges posed by price volatility, health concerns, and competitive pressures from alternative products.
Dairy Products Industry: A Comprehensive Market Report (2019-2033)
This in-depth report provides a comprehensive analysis of the global dairy products industry, covering market structure, dynamics, leading players, and future outlook. With a study period spanning 2019-2033, a base year of 2025, and a forecast period of 2025-2033, this report offers invaluable insights for industry professionals, investors, and stakeholders. The report leverages extensive data analysis to provide actionable strategies for navigating this dynamic market. The market size is projected to reach xx Million by 2033.
Dairy Products Industry Market Structure & Innovation Trends
This section analyzes the competitive landscape of the dairy products industry, focusing on market concentration, innovation drivers, regulatory frameworks, product substitutes, end-user demographics, and mergers and acquisitions (M&A) activities. Key players such as Inner Mongolia Yili Industrial Group Co Ltd, Nestlé SA, Almarai Company, Unilever PL, Danone SA, Arla Foods Amba, Dairy Farmers of America Inc, Fonterra Co-operative Group Limited, Gujarat Co-operative Milk Marketing Federation Ltd, Saputo Inc, Groupe Lactalis, and China Mengniu Dairy Company Ltd are examined for their market share and strategic moves.
The industry exhibits a moderately concentrated structure, with a few major players holding significant market share. Innovation is driven by consumer demand for healthier and more convenient options, leading to the development of products like organic milk, plant-based alternatives, and functional dairy products. Regulatory frameworks concerning food safety and labeling significantly influence industry practices. The presence of substitutes, such as plant-based milks, challenges traditional dairy products. End-user demographics are evolving, with growing demand from health-conscious consumers and those seeking convenient options. M&A activity is significant, with deals such as China Mengniu's acquisition of Bellamy's Australia highlighting the industry's consolidation trend. Examples of M&A deal values include China Mengniu's USD 1 Billion acquisition. The average market share of top 5 companies is estimated at xx%.
Dairy Products Industry Market Dynamics & Trends
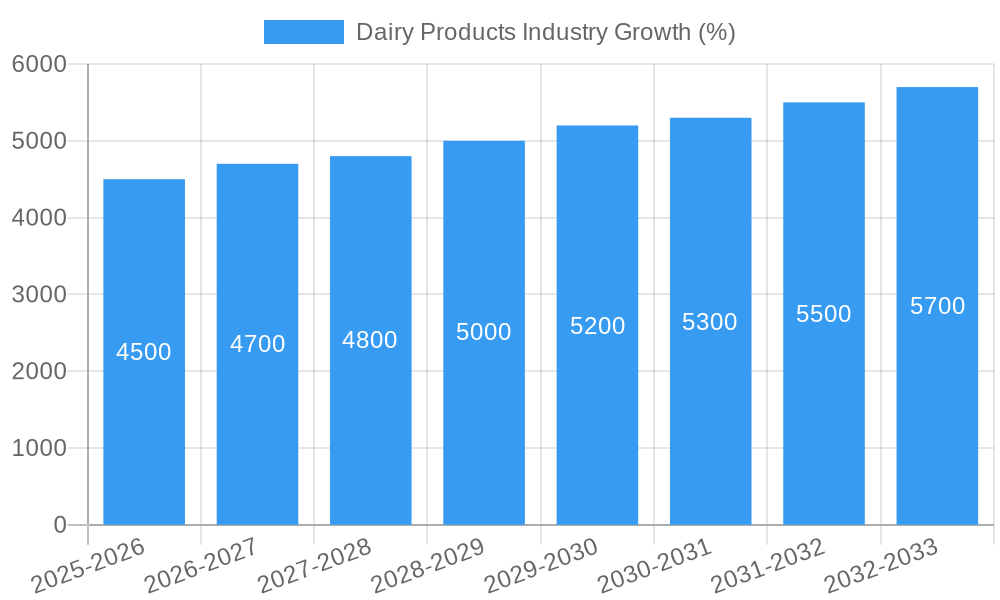
This section delves into the key market dynamics shaping the dairy products industry. The report analyzes market growth drivers, including rising disposable incomes, changing consumer preferences, and increasing demand for convenient and healthy dairy products. Technological advancements, such as improved processing techniques and packaging solutions, are also discussed. The impact of consumer preferences for organic, sustainable, and ethically sourced dairy products is examined. The report explores competitive dynamics, highlighting the strategies employed by major players to gain market share and maintain competitiveness. The Compound Annual Growth Rate (CAGR) for the forecast period is estimated at xx%, with market penetration projected to reach xx% by 2033.
Dominant Regions & Segments in Dairy Products Industry
This section identifies the leading regions and segments within the dairy products industry. Analysis is presented for distribution channels (off-trade: supermarkets, convenience stores; on-trade: restaurants, cafes, hotels) and product categories (milk: cow's milk, goat's milk; butter: salted, unsalted; yogurt: Greek yogurt, plain yogurt; cheese: Cheddar, mozzarella; others: warehouse clubs, gas stations).
Key Drivers of Regional Dominance:
- North America: Strong consumer demand for dairy products, advanced infrastructure, and established distribution networks.
- Europe: Large dairy farming sector, established brands, and high per capita consumption.
- Asia-Pacific: Rapid economic growth, rising disposable incomes, and increasing urbanization leading to higher dairy consumption.
Dominant Segments:
- Cow's milk: Remains the largest segment due to widespread availability and affordability.
- Supermarkets & Convenience stores: Dominate the off-trade distribution channel due to extensive reach and customer convenience.
The detailed dominance analysis showcases the market share of each region and segment, providing insights into market potential and growth opportunities. Growth is primarily driven by increasing demand for convenience and healthier options in developed economies, while developing economies are experiencing growth due to rising disposable incomes and urbanization.
Dairy Products Industry Product Innovations
The dairy industry is constantly evolving to meet changing consumer demands. Recent innovations include lactose-free milk, high-protein yogurts, and functional dairy products enriched with vitamins and minerals. Technological advances in processing and packaging enhance shelf life and product quality. These innovations cater to health-conscious consumers and reflect the industry's response to market trends. The focus is on sustainability and ethical sourcing, leading to the rise of organic and sustainably produced dairy products.
Report Scope & Segmentation Analysis
This report provides a comprehensive analysis of the dairy products market, segmented by distribution channel (off-trade: supermarkets, convenience stores; on-trade: restaurants, cafes, hotels), product category (milk: cow's milk, goat's milk; butter: salted, unsalted; yogurt: Greek yogurt, plain yogurt; cheese: Cheddar, mozzarella), and other distribution channels (warehouse clubs, gas stations). Each segment's growth projections, market sizes, and competitive dynamics are explored. The off-trade segment holds the largest market share, driven by the widespread presence of supermarkets and convenience stores. Cow's milk remains the dominant product category.
Key Drivers of Dairy Products Industry Growth
Several factors are driving growth in the dairy industry. Rising disposable incomes in developing countries are increasing demand for dairy products. Health-conscious consumers are fueling the growth of organic and functional dairy products. Technological advancements are improving processing efficiency and extending shelf life. Government initiatives supporting dairy farming and promoting dairy consumption also contribute to market growth.
Challenges in the Dairy Products Industry Sector
The dairy industry faces several challenges, including fluctuating milk prices, increased regulatory scrutiny, and growing competition from plant-based alternatives. Supply chain disruptions and environmental concerns regarding dairy farming practices pose additional hurdles. These factors can significantly impact profitability and sustainability.
Emerging Opportunities in Dairy Products Industry
The dairy industry presents exciting opportunities. Growth in emerging markets offers significant potential for expansion. The development of innovative dairy products catering to specific dietary needs and preferences (e.g., lactose-free, vegan) presents new avenues for growth. Sustainable and ethical sourcing practices are becoming increasingly important and present opportunities for companies to differentiate themselves.
Leading Players in the Dairy Products Industry Market
- Inner Mongolia Yili Industrial Group Co Ltd
- Nestlé SA
- Almarai Company
- Unilever PL
- Danone SA
- Arla Foods Amba
- Dairy Farmers of America Inc
- Fonterra Co-operative Group Limited
- Gujarat Co-operative Milk Marketing Federation Ltd
- Saputo Inc
- Groupe Lactalis
- China Mengniu Dairy Company Ltd
Key Developments in Dairy Products Industry
- September 2023: China Mengniu acquired organic infant formula producer Bellamy's Australia for USD 1 billion, expanding its presence in the premium infant formula market.
- October 2022: Unilever partnered with ASAP for the distribution of its ice cream goods, enhancing its reach and leveraging the online platform.
- August 2022: Dairy Farmers of America acquired two shelf-extended facilities of SmithFoods, aiming to capitalize on growing demand for longer shelf-life products.
Future Outlook for Dairy Products Industry Market
The dairy industry's future is promising, with continued growth driven by increasing demand in emerging markets, innovation in product development, and a growing focus on sustainability. Strategic partnerships and acquisitions will shape the competitive landscape. Companies that adapt to changing consumer preferences and adopt sustainable practices will be best positioned for success.
Dairy Products Industry Segmentation
-
1. Category
-
1.1. Butter
-
1.1.1. By Product Type
- 1.1.1.1. Cultured Butter
- 1.1.1.2. Uncultured Butter
-
1.1.1. By Product Type
-
1.2. Cheese
- 1.2.1. Natural Cheese
- 1.2.2. Processed Cheese
-
1.3. Cream
- 1.3.1. Double Cream
- 1.3.2. Single Cream
- 1.3.3. Whipping Cream
- 1.3.4. Others
-
1.4. Dairy Desserts
- 1.4.1. Cheesecakes
- 1.4.2. Frozen Desserts
- 1.4.3. Ice Cream
- 1.4.4. Mousses
-
1.5. Milk
- 1.5.1. Condensed milk
- 1.5.2. Flavored Milk
- 1.5.3. Fresh Milk
- 1.5.4. Powdered Milk
- 1.5.5. UHT Milk
- 1.6. Sour Milk Drinks
-
1.7. Yogurt
- 1.7.1. Flavored Yogurt
- 1.7.2. Unflavored Yogurt
-
1.1. Butter
-
2. Distribution Channel
-
2.1. Off-Trade
- 2.1.1. Convenience Stores
- 2.1.2. Online Retail
- 2.1.3. Specialist Retailers
- 2.1.4. Supermarkets and Hypermarkets
- 2.1.5. Others (Warehouse clubs, gas stations, etc.)
- 2.2. On-Trade
-
2.1. Off-Trade
Dairy Products Industry Segmentation By Geography
-
1. North America
- 1.1. United States
- 1.2. Canada
- 1.3. Mexico
-
2. South America
- 2.1. Brazil
- 2.2. Argentina
- 2.3. Rest of South America
-
3. Europe
- 3.1. United Kingdom
- 3.2. Germany
- 3.3. France
- 3.4. Italy
- 3.5. Spain
- 3.6. Russia
- 3.7. Benelux
- 3.8. Nordics
- 3.9. Rest of Europe
-
4. Middle East & Africa
- 4.1. Turkey
- 4.2. Israel
- 4.3. GCC
- 4.4. North Africa
- 4.5. South Africa
- 4.6. Rest of Middle East & Africa
-
5. Asia Pacific
- 5.1. China
- 5.2. India
- 5.3. Japan
- 5.4. South Korea
- 5.5. ASEAN
- 5.6. Oceania
- 5.7. Rest of Asia Pacific
Dairy Products Industry REPORT HIGHLIGHTS
| Aspects | Details |
|---|---|
| Study Period | 2019-2033 |
| Base Year | 2024 |
| Estimated Year | 2025 |
| Forecast Period | 2025-2033 |
| Historical Period | 2019-2024 |
| Growth Rate | CAGR of 3.44% from 2019-2033 |
| Segmentation |
|
Table of Contents
- 1. Introduction
- 1.1. Research Scope
- 1.2. Market Segmentation
- 1.3. Research Methodology
- 1.4. Definitions and Assumptions
- 2. Executive Summary
- 2.1. Introduction
- 3. Market Dynamics
- 3.1. Introduction
- 3.2. Market Drivers
- 3.2.1. Rising Demand for Clean Label Food & Beverage Products; Rising Demand for Dairy Products
- 3.3. Market Restrains
- 3.3.1. Presence of Preservatives in Ready Meals may Hamper the Market Growth
- 3.4. Market Trends
- 3.4.1. OTHER KEY INDUSTRY TRENDS COVERED IN THE REPORT
- 4. Market Factor Analysis
- 4.1. Porters Five Forces
- 4.2. Supply/Value Chain
- 4.3. PESTEL analysis
- 4.4. Market Entropy
- 4.5. Patent/Trademark Analysis
- 5. Global Dairy Products Industry Analysis, Insights and Forecast, 2019-2031
- 5.1. Market Analysis, Insights and Forecast - by Category
- 5.1.1. Butter
- 5.1.1.1. By Product Type
- 5.1.1.1.1. Cultured Butter
- 5.1.1.1.2. Uncultured Butter
- 5.1.1.1. By Product Type
- 5.1.2. Cheese
- 5.1.2.1. Natural Cheese
- 5.1.2.2. Processed Cheese
- 5.1.3. Cream
- 5.1.3.1. Double Cream
- 5.1.3.2. Single Cream
- 5.1.3.3. Whipping Cream
- 5.1.3.4. Others
- 5.1.4. Dairy Desserts
- 5.1.4.1. Cheesecakes
- 5.1.4.2. Frozen Desserts
- 5.1.4.3. Ice Cream
- 5.1.4.4. Mousses
- 5.1.5. Milk
- 5.1.5.1. Condensed milk
- 5.1.5.2. Flavored Milk
- 5.1.5.3. Fresh Milk
- 5.1.5.4. Powdered Milk
- 5.1.5.5. UHT Milk
- 5.1.6. Sour Milk Drinks
- 5.1.7. Yogurt
- 5.1.7.1. Flavored Yogurt
- 5.1.7.2. Unflavored Yogurt
- 5.1.1. Butter
- 5.2. Market Analysis, Insights and Forecast - by Distribution Channel
- 5.2.1. Off-Trade
- 5.2.1.1. Convenience Stores
- 5.2.1.2. Online Retail
- 5.2.1.3. Specialist Retailers
- 5.2.1.4. Supermarkets and Hypermarkets
- 5.2.1.5. Others (Warehouse clubs, gas stations, etc.)
- 5.2.2. On-Trade
- 5.2.1. Off-Trade
- 5.3. Market Analysis, Insights and Forecast - by Region
- 5.3.1. North America
- 5.3.2. South America
- 5.3.3. Europe
- 5.3.4. Middle East & Africa
- 5.3.5. Asia Pacific
- 5.1. Market Analysis, Insights and Forecast - by Category
- 6. North America Dairy Products Industry Analysis, Insights and Forecast, 2019-2031
- 6.1. Market Analysis, Insights and Forecast - by Category
- 6.1.1. Butter
- 6.1.1.1. By Product Type
- 6.1.1.1.1. Cultured Butter
- 6.1.1.1.2. Uncultured Butter
- 6.1.1.1. By Product Type
- 6.1.2. Cheese
- 6.1.2.1. Natural Cheese
- 6.1.2.2. Processed Cheese
- 6.1.3. Cream
- 6.1.3.1. Double Cream
- 6.1.3.2. Single Cream
- 6.1.3.3. Whipping Cream
- 6.1.3.4. Others
- 6.1.4. Dairy Desserts
- 6.1.4.1. Cheesecakes
- 6.1.4.2. Frozen Desserts
- 6.1.4.3. Ice Cream
- 6.1.4.4. Mousses
- 6.1.5. Milk
- 6.1.5.1. Condensed milk
- 6.1.5.2. Flavored Milk
- 6.1.5.3. Fresh Milk
- 6.1.5.4. Powdered Milk
- 6.1.5.5. UHT Milk
- 6.1.6. Sour Milk Drinks
- 6.1.7. Yogurt
- 6.1.7.1. Flavored Yogurt
- 6.1.7.2. Unflavored Yogurt
- 6.1.1. Butter
- 6.2. Market Analysis, Insights and Forecast - by Distribution Channel
- 6.2.1. Off-Trade
- 6.2.1.1. Convenience Stores
- 6.2.1.2. Online Retail
- 6.2.1.3. Specialist Retailers
- 6.2.1.4. Supermarkets and Hypermarkets
- 6.2.1.5. Others (Warehouse clubs, gas stations, etc.)
- 6.2.2. On-Trade
- 6.2.1. Off-Trade
- 6.1. Market Analysis, Insights and Forecast - by Category
- 7. South America Dairy Products Industry Analysis, Insights and Forecast, 2019-2031
- 7.1. Market Analysis, Insights and Forecast - by Category
- 7.1.1. Butter
- 7.1.1.1. By Product Type
- 7.1.1.1.1. Cultured Butter
- 7.1.1.1.2. Uncultured Butter
- 7.1.1.1. By Product Type
- 7.1.2. Cheese
- 7.1.2.1. Natural Cheese
- 7.1.2.2. Processed Cheese
- 7.1.3. Cream
- 7.1.3.1. Double Cream
- 7.1.3.2. Single Cream
- 7.1.3.3. Whipping Cream
- 7.1.3.4. Others
- 7.1.4. Dairy Desserts
- 7.1.4.1. Cheesecakes
- 7.1.4.2. Frozen Desserts
- 7.1.4.3. Ice Cream
- 7.1.4.4. Mousses
- 7.1.5. Milk
- 7.1.5.1. Condensed milk
- 7.1.5.2. Flavored Milk
- 7.1.5.3. Fresh Milk
- 7.1.5.4. Powdered Milk
- 7.1.5.5. UHT Milk
- 7.1.6. Sour Milk Drinks
- 7.1.7. Yogurt
- 7.1.7.1. Flavored Yogurt
- 7.1.7.2. Unflavored Yogurt
- 7.1.1. Butter
- 7.2. Market Analysis, Insights and Forecast - by Distribution Channel
- 7.2.1. Off-Trade
- 7.2.1.1. Convenience Stores
- 7.2.1.2. Online Retail
- 7.2.1.3. Specialist Retailers
- 7.2.1.4. Supermarkets and Hypermarkets
- 7.2.1.5. Others (Warehouse clubs, gas stations, etc.)
- 7.2.2. On-Trade
- 7.2.1. Off-Trade
- 7.1. Market Analysis, Insights and Forecast - by Category
- 8. Europe Dairy Products Industry Analysis, Insights and Forecast, 2019-2031
- 8.1. Market Analysis, Insights and Forecast - by Category
- 8.1.1. Butter
- 8.1.1.1. By Product Type
- 8.1.1.1.1. Cultured Butter
- 8.1.1.1.2. Uncultured Butter
- 8.1.1.1. By Product Type
- 8.1.2. Cheese
- 8.1.2.1. Natural Cheese
- 8.1.2.2. Processed Cheese
- 8.1.3. Cream
- 8.1.3.1. Double Cream
- 8.1.3.2. Single Cream
- 8.1.3.3. Whipping Cream
- 8.1.3.4. Others
- 8.1.4. Dairy Desserts
- 8.1.4.1. Cheesecakes
- 8.1.4.2. Frozen Desserts
- 8.1.4.3. Ice Cream
- 8.1.4.4. Mousses
- 8.1.5. Milk
- 8.1.5.1. Condensed milk
- 8.1.5.2. Flavored Milk
- 8.1.5.3. Fresh Milk
- 8.1.5.4. Powdered Milk
- 8.1.5.5. UHT Milk
- 8.1.6. Sour Milk Drinks
- 8.1.7. Yogurt
- 8.1.7.1. Flavored Yogurt
- 8.1.7.2. Unflavored Yogurt
- 8.1.1. Butter
- 8.2. Market Analysis, Insights and Forecast - by Distribution Channel
- 8.2.1. Off-Trade
- 8.2.1.1. Convenience Stores
- 8.2.1.2. Online Retail
- 8.2.1.3. Specialist Retailers
- 8.2.1.4. Supermarkets and Hypermarkets
- 8.2.1.5. Others (Warehouse clubs, gas stations, etc.)
- 8.2.2. On-Trade
- 8.2.1. Off-Trade
- 8.1. Market Analysis, Insights and Forecast - by Category
- 9. Middle East & Africa Dairy Products Industry Analysis, Insights and Forecast, 2019-2031
- 9.1. Market Analysis, Insights and Forecast - by Category
- 9.1.1. Butter
- 9.1.1.1. By Product Type
- 9.1.1.1.1. Cultured Butter
- 9.1.1.1.2. Uncultured Butter
- 9.1.1.1. By Product Type
- 9.1.2. Cheese
- 9.1.2.1. Natural Cheese
- 9.1.2.2. Processed Cheese
- 9.1.3. Cream
- 9.1.3.1. Double Cream
- 9.1.3.2. Single Cream
- 9.1.3.3. Whipping Cream
- 9.1.3.4. Others
- 9.1.4. Dairy Desserts
- 9.1.4.1. Cheesecakes
- 9.1.4.2. Frozen Desserts
- 9.1.4.3. Ice Cream
- 9.1.4.4. Mousses
- 9.1.5. Milk
- 9.1.5.1. Condensed milk
- 9.1.5.2. Flavored Milk
- 9.1.5.3. Fresh Milk
- 9.1.5.4. Powdered Milk
- 9.1.5.5. UHT Milk
- 9.1.6. Sour Milk Drinks
- 9.1.7. Yogurt
- 9.1.7.1. Flavored Yogurt
- 9.1.7.2. Unflavored Yogurt
- 9.1.1. Butter
- 9.2. Market Analysis, Insights and Forecast - by Distribution Channel
- 9.2.1. Off-Trade
- 9.2.1.1. Convenience Stores
- 9.2.1.2. Online Retail
- 9.2.1.3. Specialist Retailers
- 9.2.1.4. Supermarkets and Hypermarkets
- 9.2.1.5. Others (Warehouse clubs, gas stations, etc.)
- 9.2.2. On-Trade
- 9.2.1. Off-Trade
- 9.1. Market Analysis, Insights and Forecast - by Category
- 10. Asia Pacific Dairy Products Industry Analysis, Insights and Forecast, 2019-2031
- 10.1. Market Analysis, Insights and Forecast - by Category
- 10.1.1. Butter
- 10.1.1.1. By Product Type
- 10.1.1.1.1. Cultured Butter
- 10.1.1.1.2. Uncultured Butter
- 10.1.1.1. By Product Type
- 10.1.2. Cheese
- 10.1.2.1. Natural Cheese
- 10.1.2.2. Processed Cheese
- 10.1.3. Cream
- 10.1.3.1. Double Cream
- 10.1.3.2. Single Cream
- 10.1.3.3. Whipping Cream
- 10.1.3.4. Others
- 10.1.4. Dairy Desserts
- 10.1.4.1. Cheesecakes
- 10.1.4.2. Frozen Desserts
- 10.1.4.3. Ice Cream
- 10.1.4.4. Mousses
- 10.1.5. Milk
- 10.1.5.1. Condensed milk
- 10.1.5.2. Flavored Milk
- 10.1.5.3. Fresh Milk
- 10.1.5.4. Powdered Milk
- 10.1.5.5. UHT Milk
- 10.1.6. Sour Milk Drinks
- 10.1.7. Yogurt
- 10.1.7.1. Flavored Yogurt
- 10.1.7.2. Unflavored Yogurt
- 10.1.1. Butter
- 10.2. Market Analysis, Insights and Forecast - by Distribution Channel
- 10.2.1. Off-Trade
- 10.2.1.1. Convenience Stores
- 10.2.1.2. Online Retail
- 10.2.1.3. Specialist Retailers
- 10.2.1.4. Supermarkets and Hypermarkets
- 10.2.1.5. Others (Warehouse clubs, gas stations, etc.)
- 10.2.2. On-Trade
- 10.2.1. Off-Trade
- 10.1. Market Analysis, Insights and Forecast - by Category
- 11. North America Dairy Products Industry Analysis, Insights and Forecast, 2019-2031
- 11.1. Market Analysis, Insights and Forecast - By Country/Sub-region
- 11.1.1 United States
- 11.1.2 Canada
- 11.1.3 Mexico
- 12. South America Dairy Products Industry Analysis, Insights and Forecast, 2019-2031
- 12.1. Market Analysis, Insights and Forecast - By Country/Sub-region
- 12.1.1 Brazil
- 12.1.2 Argentina
- 12.1.3 Rest of South America
- 13. Europe Dairy Products Industry Analysis, Insights and Forecast, 2019-2031
- 13.1. Market Analysis, Insights and Forecast - By Country/Sub-region
- 13.1.1 Germany
- 13.1.2 France
- 13.1.3 Italy
- 13.1.4 United Kingdom
- 13.1.5 Netherlands
- 13.1.6 Rest of Europe
- 14. Asia Pacific Dairy Products Industry Analysis, Insights and Forecast, 2019-2031
- 14.1. Market Analysis, Insights and Forecast - By Country/Sub-region
- 14.1.1 China
- 14.1.2 Japan
- 14.1.3 India
- 14.1.4 South Korea
- 14.1.5 Taiwan
- 14.1.6 Australia
- 14.1.7 Rest of Asia-Pacific
- 15. Middle East & Africa Dairy Products Industry Analysis, Insights and Forecast, 2019-2031
- 15.1. Market Analysis, Insights and Forecast - By Country/Sub-region
- 15.1.1 UAE
- 15.1.2 South Africa
- 15.1.3 Saudi Arabia
- 15.1.4 Rest of MEA
- 16. Competitive Analysis
- 16.1. Global Market Share Analysis 2024
- 16.2. Company Profiles
- 16.2.1 Inner Mongolia Yili Industrial Group Co Ltd
- 16.2.1.1. Overview
- 16.2.1.2. Products
- 16.2.1.3. SWOT Analysis
- 16.2.1.4. Recent Developments
- 16.2.1.5. Financials (Based on Availability)
- 16.2.2 Nestlé SA
- 16.2.2.1. Overview
- 16.2.2.2. Products
- 16.2.2.3. SWOT Analysis
- 16.2.2.4. Recent Developments
- 16.2.2.5. Financials (Based on Availability)
- 16.2.3 Almarai Company
- 16.2.3.1. Overview
- 16.2.3.2. Products
- 16.2.3.3. SWOT Analysis
- 16.2.3.4. Recent Developments
- 16.2.3.5. Financials (Based on Availability)
- 16.2.4 Unilever PL
- 16.2.4.1. Overview
- 16.2.4.2. Products
- 16.2.4.3. SWOT Analysis
- 16.2.4.4. Recent Developments
- 16.2.4.5. Financials (Based on Availability)
- 16.2.5 Danone SA
- 16.2.5.1. Overview
- 16.2.5.2. Products
- 16.2.5.3. SWOT Analysis
- 16.2.5.4. Recent Developments
- 16.2.5.5. Financials (Based on Availability)
- 16.2.6 Arla Foods Amba
- 16.2.6.1. Overview
- 16.2.6.2. Products
- 16.2.6.3. SWOT Analysis
- 16.2.6.4. Recent Developments
- 16.2.6.5. Financials (Based on Availability)
- 16.2.7 Dairy Farmers of America Inc
- 16.2.7.1. Overview
- 16.2.7.2. Products
- 16.2.7.3. SWOT Analysis
- 16.2.7.4. Recent Developments
- 16.2.7.5. Financials (Based on Availability)
- 16.2.8 Fonterra Co-operative Group Limited
- 16.2.8.1. Overview
- 16.2.8.2. Products
- 16.2.8.3. SWOT Analysis
- 16.2.8.4. Recent Developments
- 16.2.8.5. Financials (Based on Availability)
- 16.2.9 Gujarat Co-operative Milk Marketing Federation Ltd
- 16.2.9.1. Overview
- 16.2.9.2. Products
- 16.2.9.3. SWOT Analysis
- 16.2.9.4. Recent Developments
- 16.2.9.5. Financials (Based on Availability)
- 16.2.10 Saputo Inc
- 16.2.10.1. Overview
- 16.2.10.2. Products
- 16.2.10.3. SWOT Analysis
- 16.2.10.4. Recent Developments
- 16.2.10.5. Financials (Based on Availability)
- 16.2.11 Groupe Lactalis
- 16.2.11.1. Overview
- 16.2.11.2. Products
- 16.2.11.3. SWOT Analysis
- 16.2.11.4. Recent Developments
- 16.2.11.5. Financials (Based on Availability)
- 16.2.12 China Mengniu Dairy Company Ltd
- 16.2.12.1. Overview
- 16.2.12.2. Products
- 16.2.12.3. SWOT Analysis
- 16.2.12.4. Recent Developments
- 16.2.12.5. Financials (Based on Availability)
- 16.2.1 Inner Mongolia Yili Industrial Group Co Ltd
List of Figures
- Figure 1: Global Dairy Products Industry Revenue Breakdown (Million, %) by Region 2024 & 2032
- Figure 2: North America Dairy Products Industry Revenue (Million), by Country 2024 & 2032
- Figure 3: North America Dairy Products Industry Revenue Share (%), by Country 2024 & 2032
- Figure 4: South America Dairy Products Industry Revenue (Million), by Country 2024 & 2032
- Figure 5: South America Dairy Products Industry Revenue Share (%), by Country 2024 & 2032
- Figure 6: Europe Dairy Products Industry Revenue (Million), by Country 2024 & 2032
- Figure 7: Europe Dairy Products Industry Revenue Share (%), by Country 2024 & 2032
- Figure 8: Asia Pacific Dairy Products Industry Revenue (Million), by Country 2024 & 2032
- Figure 9: Asia Pacific Dairy Products Industry Revenue Share (%), by Country 2024 & 2032
- Figure 10: Middle East & Africa Dairy Products Industry Revenue (Million), by Country 2024 & 2032
- Figure 11: Middle East & Africa Dairy Products Industry Revenue Share (%), by Country 2024 & 2032
- Figure 12: North America Dairy Products Industry Revenue (Million), by Category 2024 & 2032
- Figure 13: North America Dairy Products Industry Revenue Share (%), by Category 2024 & 2032
- Figure 14: North America Dairy Products Industry Revenue (Million), by Distribution Channel 2024 & 2032
- Figure 15: North America Dairy Products Industry Revenue Share (%), by Distribution Channel 2024 & 2032
- Figure 16: North America Dairy Products Industry Revenue (Million), by Country 2024 & 2032
- Figure 17: North America Dairy Products Industry Revenue Share (%), by Country 2024 & 2032
- Figure 18: South America Dairy Products Industry Revenue (Million), by Category 2024 & 2032
- Figure 19: South America Dairy Products Industry Revenue Share (%), by Category 2024 & 2032
- Figure 20: South America Dairy Products Industry Revenue (Million), by Distribution Channel 2024 & 2032
- Figure 21: South America Dairy Products Industry Revenue Share (%), by Distribution Channel 2024 & 2032
- Figure 22: South America Dairy Products Industry Revenue (Million), by Country 2024 & 2032
- Figure 23: South America Dairy Products Industry Revenue Share (%), by Country 2024 & 2032
- Figure 24: Europe Dairy Products Industry Revenue (Million), by Category 2024 & 2032
- Figure 25: Europe Dairy Products Industry Revenue Share (%), by Category 2024 & 2032
- Figure 26: Europe Dairy Products Industry Revenue (Million), by Distribution Channel 2024 & 2032
- Figure 27: Europe Dairy Products Industry Revenue Share (%), by Distribution Channel 2024 & 2032
- Figure 28: Europe Dairy Products Industry Revenue (Million), by Country 2024 & 2032
- Figure 29: Europe Dairy Products Industry Revenue Share (%), by Country 2024 & 2032
- Figure 30: Middle East & Africa Dairy Products Industry Revenue (Million), by Category 2024 & 2032
- Figure 31: Middle East & Africa Dairy Products Industry Revenue Share (%), by Category 2024 & 2032
- Figure 32: Middle East & Africa Dairy Products Industry Revenue (Million), by Distribution Channel 2024 & 2032
- Figure 33: Middle East & Africa Dairy Products Industry Revenue Share (%), by Distribution Channel 2024 & 2032
- Figure 34: Middle East & Africa Dairy Products Industry Revenue (Million), by Country 2024 & 2032
- Figure 35: Middle East & Africa Dairy Products Industry Revenue Share (%), by Country 2024 & 2032
- Figure 36: Asia Pacific Dairy Products Industry Revenue (Million), by Category 2024 & 2032
- Figure 37: Asia Pacific Dairy Products Industry Revenue Share (%), by Category 2024 & 2032
- Figure 38: Asia Pacific Dairy Products Industry Revenue (Million), by Distribution Channel 2024 & 2032
- Figure 39: Asia Pacific Dairy Products Industry Revenue Share (%), by Distribution Channel 2024 & 2032
- Figure 40: Asia Pacific Dairy Products Industry Revenue (Million), by Country 2024 & 2032
- Figure 41: Asia Pacific Dairy Products Industry Revenue Share (%), by Country 2024 & 2032
List of Tables
- Table 1: Global Dairy Products Industry Revenue Million Forecast, by Region 2019 & 2032
- Table 2: Global Dairy Products Industry Revenue Million Forecast, by Category 2019 & 2032
- Table 3: Global Dairy Products Industry Revenue Million Forecast, by Distribution Channel 2019 & 2032
- Table 4: Global Dairy Products Industry Revenue Million Forecast, by Region 2019 & 2032
- Table 5: Global Dairy Products Industry Revenue Million Forecast, by Country 2019 & 2032
- Table 6: United States Dairy Products Industry Revenue (Million) Forecast, by Application 2019 & 2032
- Table 7: Canada Dairy Products Industry Revenue (Million) Forecast, by Application 2019 & 2032
- Table 8: Mexico Dairy Products Industry Revenue (Million) Forecast, by Application 2019 & 2032
- Table 9: Global Dairy Products Industry Revenue Million Forecast, by Country 2019 & 2032
- Table 10: Brazil Dairy Products Industry Revenue (Million) Forecast, by Application 2019 & 2032
- Table 11: Argentina Dairy Products Industry Revenue (Million) Forecast, by Application 2019 & 2032
- Table 12: Rest of South America Dairy Products Industry Revenue (Million) Forecast, by Application 2019 & 2032
- Table 13: Global Dairy Products Industry Revenue Million Forecast, by Country 2019 & 2032
- Table 14: Germany Dairy Products Industry Revenue (Million) Forecast, by Application 2019 & 2032
- Table 15: France Dairy Products Industry Revenue (Million) Forecast, by Application 2019 & 2032
- Table 16: Italy Dairy Products Industry Revenue (Million) Forecast, by Application 2019 & 2032
- Table 17: United Kingdom Dairy Products Industry Revenue (Million) Forecast, by Application 2019 & 2032
- Table 18: Netherlands Dairy Products Industry Revenue (Million) Forecast, by Application 2019 & 2032
- Table 19: Rest of Europe Dairy Products Industry Revenue (Million) Forecast, by Application 2019 & 2032
- Table 20: Global Dairy Products Industry Revenue Million Forecast, by Country 2019 & 2032
- Table 21: China Dairy Products Industry Revenue (Million) Forecast, by Application 2019 & 2032
- Table 22: Japan Dairy Products Industry Revenue (Million) Forecast, by Application 2019 & 2032
- Table 23: India Dairy Products Industry Revenue (Million) Forecast, by Application 2019 & 2032
- Table 24: South Korea Dairy Products Industry Revenue (Million) Forecast, by Application 2019 & 2032
- Table 25: Taiwan Dairy Products Industry Revenue (Million) Forecast, by Application 2019 & 2032
- Table 26: Australia Dairy Products Industry Revenue (Million) Forecast, by Application 2019 & 2032
- Table 27: Rest of Asia-Pacific Dairy Products Industry Revenue (Million) Forecast, by Application 2019 & 2032
- Table 28: Global Dairy Products Industry Revenue Million Forecast, by Country 2019 & 2032
- Table 29: UAE Dairy Products Industry Revenue (Million) Forecast, by Application 2019 & 2032
- Table 30: South Africa Dairy Products Industry Revenue (Million) Forecast, by Application 2019 & 2032
- Table 31: Saudi Arabia Dairy Products Industry Revenue (Million) Forecast, by Application 2019 & 2032
- Table 32: Rest of MEA Dairy Products Industry Revenue (Million) Forecast, by Application 2019 & 2032
- Table 33: Global Dairy Products Industry Revenue Million Forecast, by Category 2019 & 2032
- Table 34: Global Dairy Products Industry Revenue Million Forecast, by Distribution Channel 2019 & 2032
- Table 35: Global Dairy Products Industry Revenue Million Forecast, by Country 2019 & 2032
- Table 36: United States Dairy Products Industry Revenue (Million) Forecast, by Application 2019 & 2032
- Table 37: Canada Dairy Products Industry Revenue (Million) Forecast, by Application 2019 & 2032
- Table 38: Mexico Dairy Products Industry Revenue (Million) Forecast, by Application 2019 & 2032
- Table 39: Global Dairy Products Industry Revenue Million Forecast, by Category 2019 & 2032
- Table 40: Global Dairy Products Industry Revenue Million Forecast, by Distribution Channel 2019 & 2032
- Table 41: Global Dairy Products Industry Revenue Million Forecast, by Country 2019 & 2032
- Table 42: Brazil Dairy Products Industry Revenue (Million) Forecast, by Application 2019 & 2032
- Table 43: Argentina Dairy Products Industry Revenue (Million) Forecast, by Application 2019 & 2032
- Table 44: Rest of South America Dairy Products Industry Revenue (Million) Forecast, by Application 2019 & 2032
- Table 45: Global Dairy Products Industry Revenue Million Forecast, by Category 2019 & 2032
- Table 46: Global Dairy Products Industry Revenue Million Forecast, by Distribution Channel 2019 & 2032
- Table 47: Global Dairy Products Industry Revenue Million Forecast, by Country 2019 & 2032
- Table 48: United Kingdom Dairy Products Industry Revenue (Million) Forecast, by Application 2019 & 2032
- Table 49: Germany Dairy Products Industry Revenue (Million) Forecast, by Application 2019 & 2032
- Table 50: France Dairy Products Industry Revenue (Million) Forecast, by Application 2019 & 2032
- Table 51: Italy Dairy Products Industry Revenue (Million) Forecast, by Application 2019 & 2032
- Table 52: Spain Dairy Products Industry Revenue (Million) Forecast, by Application 2019 & 2032
- Table 53: Russia Dairy Products Industry Revenue (Million) Forecast, by Application 2019 & 2032
- Table 54: Benelux Dairy Products Industry Revenue (Million) Forecast, by Application 2019 & 2032
- Table 55: Nordics Dairy Products Industry Revenue (Million) Forecast, by Application 2019 & 2032
- Table 56: Rest of Europe Dairy Products Industry Revenue (Million) Forecast, by Application 2019 & 2032
- Table 57: Global Dairy Products Industry Revenue Million Forecast, by Category 2019 & 2032
- Table 58: Global Dairy Products Industry Revenue Million Forecast, by Distribution Channel 2019 & 2032
- Table 59: Global Dairy Products Industry Revenue Million Forecast, by Country 2019 & 2032
- Table 60: Turkey Dairy Products Industry Revenue (Million) Forecast, by Application 2019 & 2032
- Table 61: Israel Dairy Products Industry Revenue (Million) Forecast, by Application 2019 & 2032
- Table 62: GCC Dairy Products Industry Revenue (Million) Forecast, by Application 2019 & 2032
- Table 63: North Africa Dairy Products Industry Revenue (Million) Forecast, by Application 2019 & 2032
- Table 64: South Africa Dairy Products Industry Revenue (Million) Forecast, by Application 2019 & 2032
- Table 65: Rest of Middle East & Africa Dairy Products Industry Revenue (Million) Forecast, by Application 2019 & 2032
- Table 66: Global Dairy Products Industry Revenue Million Forecast, by Category 2019 & 2032
- Table 67: Global Dairy Products Industry Revenue Million Forecast, by Distribution Channel 2019 & 2032
- Table 68: Global Dairy Products Industry Revenue Million Forecast, by Country 2019 & 2032
- Table 69: China Dairy Products Industry Revenue (Million) Forecast, by Application 2019 & 2032
- Table 70: India Dairy Products Industry Revenue (Million) Forecast, by Application 2019 & 2032
- Table 71: Japan Dairy Products Industry Revenue (Million) Forecast, by Application 2019 & 2032
- Table 72: South Korea Dairy Products Industry Revenue (Million) Forecast, by Application 2019 & 2032
- Table 73: ASEAN Dairy Products Industry Revenue (Million) Forecast, by Application 2019 & 2032
- Table 74: Oceania Dairy Products Industry Revenue (Million) Forecast, by Application 2019 & 2032
- Table 75: Rest of Asia Pacific Dairy Products Industry Revenue (Million) Forecast, by Application 2019 & 2032
Frequently Asked Questions
1. What is the projected Compound Annual Growth Rate (CAGR) of the Dairy Products Industry?
The projected CAGR is approximately 3.44%.
2. Which companies are prominent players in the Dairy Products Industry?
Key companies in the market include Inner Mongolia Yili Industrial Group Co Ltd, Nestlé SA, Almarai Company, Unilever PL, Danone SA, Arla Foods Amba, Dairy Farmers of America Inc, Fonterra Co-operative Group Limited, Gujarat Co-operative Milk Marketing Federation Ltd, Saputo Inc, Groupe Lactalis, China Mengniu Dairy Company Ltd.
3. What are the main segments of the Dairy Products Industry?
The market segments include Category, Distribution Channel.
4. Can you provide details about the market size?
The market size is estimated to be USD 131.5 Million as of 2022.
5. What are some drivers contributing to market growth?
Rising Demand for Clean Label Food & Beverage Products; Rising Demand for Dairy Products.
6. What are the notable trends driving market growth?
OTHER KEY INDUSTRY TRENDS COVERED IN THE REPORT.
7. Are there any restraints impacting market growth?
Presence of Preservatives in Ready Meals may Hamper the Market Growth.
8. Can you provide examples of recent developments in the market?
September 2023: China Mengniu acquired organic infant formula producer Bellamy's Australia for USD 1 billion.October 2022: Unilever partnered with ASAP for the distribution of its ice cream goods. As per the partnership, ASAP will also deliver ice cream and treats from Unilever's virtual storefront, The Ice Cream Shop.August 2022: Dairy Farmers of America acquired two shelf-extended facilities of SmithFoods. The strategy of this acquisition was to assist the corporation in capitalizing on the market's growing demand for products with extended shelf lives.
9. What pricing options are available for accessing the report?
Pricing options include single-user, multi-user, and enterprise licenses priced at USD 3800, USD 4500, and USD 5800 respectively.
10. Is the market size provided in terms of value or volume?
The market size is provided in terms of value, measured in Million.
11. Are there any specific market keywords associated with the report?
Yes, the market keyword associated with the report is "Dairy Products Industry," which aids in identifying and referencing the specific market segment covered.
12. How do I determine which pricing option suits my needs best?
The pricing options vary based on user requirements and access needs. Individual users may opt for single-user licenses, while businesses requiring broader access may choose multi-user or enterprise licenses for cost-effective access to the report.
13. Are there any additional resources or data provided in the Dairy Products Industry report?
While the report offers comprehensive insights, it's advisable to review the specific contents or supplementary materials provided to ascertain if additional resources or data are available.
14. How can I stay updated on further developments or reports in the Dairy Products Industry?
To stay informed about further developments, trends, and reports in the Dairy Products Industry, consider subscribing to industry newsletters, following relevant companies and organizations, or regularly checking reputable industry news sources and publications.
Methodology
Step 1 - Identification of Relevant Samples Size from Population Database


Step 2 - Approaches for Defining Global Market Size (Value, Volume* & Price*)

Note*: In applicable scenarios
Step 3 - Data Sources
Primary Research
- Web Analytics
- Survey Reports
- Research Institute
- Latest Research Reports
- Opinion Leaders
Secondary Research
- Annual Reports
- White Paper
- Latest Press Release
- Industry Association
- Paid Database
- Investor Presentations

Step 4 - Data Triangulation
Involves using different sources of information in order to increase the validity of a study
These sources are likely to be stakeholders in a program - participants, other researchers, program staff, other community members, and so on.
Then we put all data in single framework & apply various statistical tools to find out the dynamic on the market.
During the analysis stage, feedback from the stakeholder groups would be compared to determine areas of agreement as well as areas of divergence


