
Key Insights
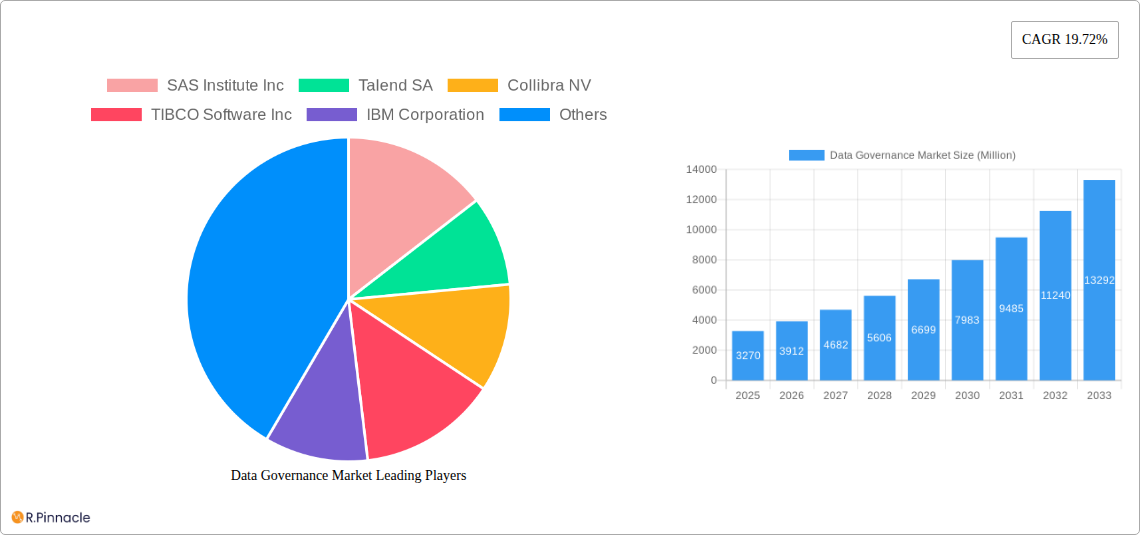
The global Data Governance market, valued at $3.27 billion in 2025, is projected to experience robust growth, exhibiting a Compound Annual Growth Rate (CAGR) of 19.72% from 2025 to 2033. This significant expansion is driven by several key factors. The increasing volume and complexity of data generated by organizations across diverse sectors necessitate robust data governance frameworks to ensure data quality, compliance, and security. Rising regulatory pressures, such as GDPR and CCPA, are further compelling businesses to invest in comprehensive data governance solutions to mitigate risks and maintain regulatory compliance. Moreover, the burgeoning adoption of cloud computing and big data analytics is fueling demand for effective data governance strategies to manage and utilize these vast datasets effectively. The market is segmented by deployment (cloud, on-premise), organization size (large-scale, small- and medium-scale businesses), component (software, service), business function (operations, IT, legal, finance, others), and end-user industry (IT & Telecom, healthcare, retail, defense, BFSI, others). North America currently holds a dominant market share due to early adoption of data governance technologies and stringent regulatory environments, however, regions like Asia-Pacific are expected to witness significant growth in the coming years fueled by increasing digitalization and expanding data infrastructure.
The competitive landscape comprises a mix of established players like SAS Institute, IBM, Informatica, and Microsoft, alongside emerging innovative companies. These companies are strategically focusing on developing advanced data governance solutions that leverage artificial intelligence and machine learning to enhance data quality, automate processes, and improve overall efficiency. Future market growth will depend on factors including advancements in data governance technologies, increasing adoption of cloud-based solutions, the expansion of big data analytics, and the evolution of data privacy regulations. Strategic partnerships and mergers & acquisitions will continue to shape the market dynamics, with companies striving to expand their product portfolios and broaden their geographic reach. The market's trajectory suggests continued strong growth, driven by the escalating need for data quality, security, and compliance in an increasingly data-driven world.
Data Governance Market Report: 2019-2033 Forecast
This comprehensive report provides a detailed analysis of the Data Governance Market, offering invaluable insights for industry professionals, investors, and strategic decision-makers. We delve into market structure, dynamics, dominant segments, and leading players, projecting growth trends through 2033. The study period covers 2019-2033, with 2025 as the base and estimated year.
Data Governance Market Structure & Innovation Trends
The Data Governance market is experiencing significant growth, driven by increasing data volumes, stringent regulatory compliance needs, and the rising demand for data-driven decision-making. Market concentration is moderate, with several key players holding substantial market share. However, the landscape is dynamic, marked by continuous innovation and strategic mergers and acquisitions (M&A).
- Market Concentration: The top 5 players (e.g., Informatica, IBM, SAS Institute, Collibra, and Talend) account for approximately xx% of the market share in 2025. The remaining share is distributed among numerous smaller players and niche providers.
- Innovation Drivers: Artificial intelligence (AI), machine learning (ML), and cloud computing are key drivers of innovation, enabling more efficient data governance solutions. The emergence of generative AI is poised to further revolutionize the field.
- Regulatory Frameworks: Regulations like GDPR and CCPA are significantly impacting the market, driving demand for robust data governance solutions to ensure compliance.
- Product Substitutes: While dedicated data governance solutions are preferred, alternative approaches like basic data management tools and manual processes still exist, but their limitations are increasingly apparent in the face of growing data complexity.
- End-User Demographics: The market caters to a broad range of organizations, from small and medium-sized businesses (SMBs) to large enterprises across diverse industries. Large-scale businesses currently account for a larger market share due to their higher data volumes and stringent compliance requirements.
- M&A Activities: The market has witnessed several significant M&A deals in recent years, with deal values totaling xx Million in 2024. These activities indicate consolidation within the market and a drive to expand capabilities and market reach. Consolidation is expected to continue in the forecast period.
Data Governance Market Dynamics & Trends
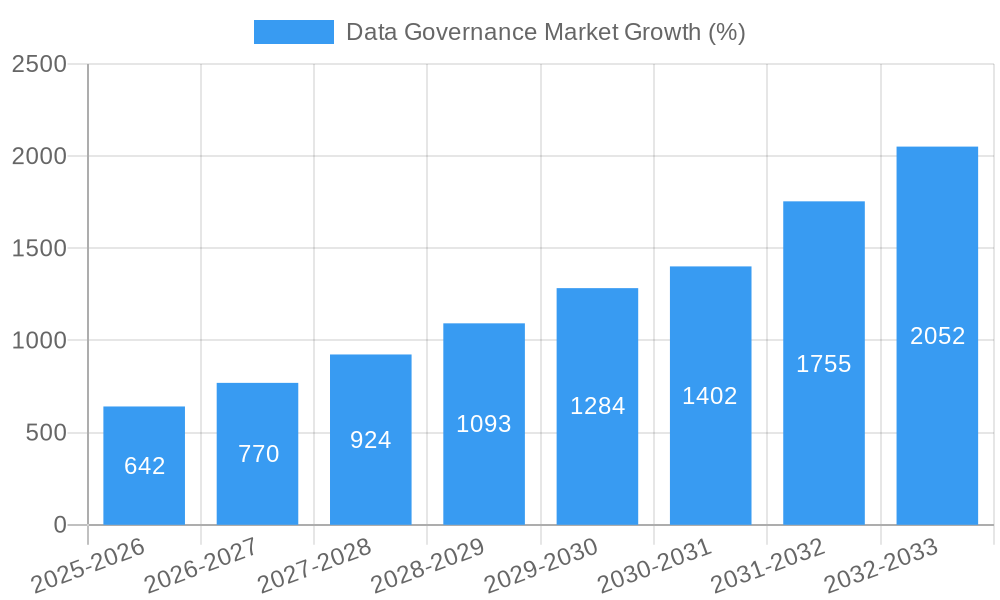
The Data Governance market is characterized by robust growth, with a projected Compound Annual Growth Rate (CAGR) of xx% during the forecast period (2025-2033). This growth is fueled by several key factors:
- Increased Data Volumes: The exponential growth of data across various industries is a primary driver, creating a pressing need for effective data governance solutions.
- Stringent Data Privacy Regulations: Compliance with evolving data privacy regulations (e.g., GDPR, CCPA) is driving adoption of robust data governance technologies.
- Growing Demand for Data-Driven Decision Making: Organizations are increasingly relying on data for strategic decision-making, necessitating improved data quality and governance.
- Technological Advancements: AI, ML, and cloud computing are significantly improving data governance capabilities, making solutions more efficient and accessible.
- Rise of Big Data and Cloud Adoption: The proliferation of big data and the increasing adoption of cloud-based solutions are expanding the market further.
- Market Penetration: Market penetration is currently at xx% in 2025 and is expected to reach xx% by 2033.
Dominant Regions & Segments in Data Governance Market
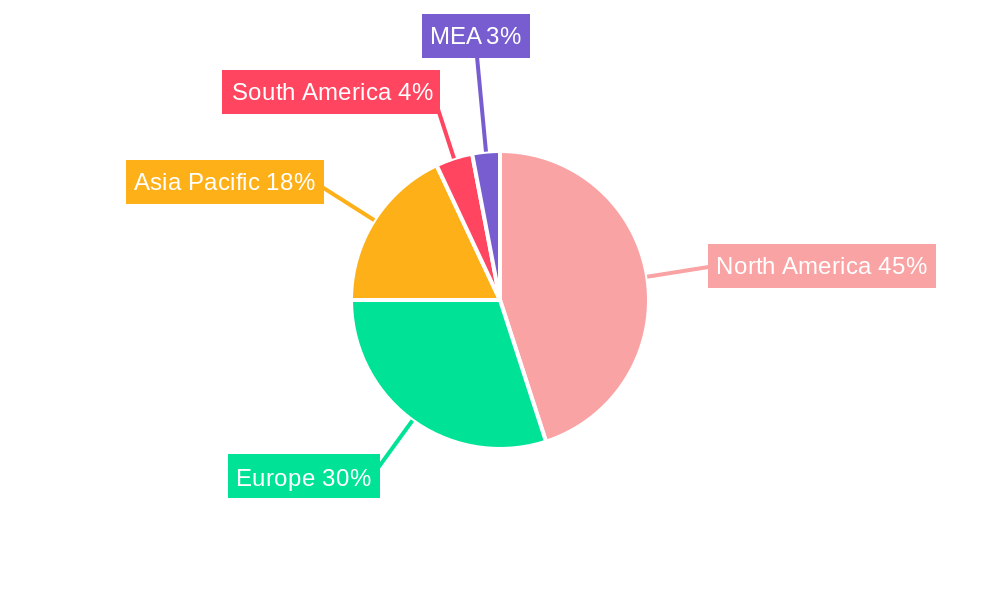
North America currently holds the largest market share, followed by Europe. However, Asia-Pacific is expected to experience the fastest growth rate during the forecast period.
- Key Drivers: Strong technological infrastructure, high adoption of cloud computing, and stringent data privacy regulations are key drivers in North America and Europe. In the Asia-Pacific region, growing digitalization and increasing government investments in digital infrastructure are fueling market growth.
Segment Dominance:
- Deployment: Cloud deployment is the dominant segment, driven by its scalability, flexibility, and cost-effectiveness.
- Organization Size: Large-scale businesses constitute a significant portion of the market due to their higher data volumes and complex data governance needs.
- Component: Software solutions dominate the market, followed by services.
- Business Function: Operation and IT functions currently represent the largest segment, with increasing adoption across legal, finance, and other business functions.
- End-user Industry: The IT and Telecom sector currently leads the market, followed by BFSI and Healthcare.
Data Governance Market Product Innovations
Recent innovations focus on integrating AI/ML for automated data quality monitoring, improved data classification, and streamlined compliance workflows. Cloud-based solutions are increasingly incorporating advanced analytics and reporting capabilities to provide better insights into data quality and compliance status. This enhances market fit by providing more user-friendly, scalable, and cost-effective solutions.
Report Scope & Segmentation Analysis
This report segments the Data Governance market across various parameters:
- Deployment: Cloud and On-premise
- Organization Size: Large-scale Business and Small- and Medium-scale Business
- Component: Software and Service
- Business Function: Operation and IT, Legal, Finance, and Other Business Functions
- End-user Industry: IT and Telecom, Healthcare, Retail, Defense, BFSI, and Other End-user Industries
Each segment's growth projections, market sizes, and competitive dynamics are analyzed in detail within the full report.
Key Drivers of Data Governance Market Growth
The market's growth is driven by several factors including increasing data volumes, stringent data privacy regulations (GDPR, CCPA), the rising demand for data-driven decision-making, technological advancements (AI, ML, cloud computing), and growing adoption of big data analytics. Government initiatives promoting data-driven economies further bolster market expansion.
Challenges in the Data Governance Market Sector
Challenges include the complexity of implementing data governance solutions, high implementation costs, lack of skilled professionals, resistance to change within organizations, and ensuring interoperability between different data governance tools. Data security and privacy concerns also pose significant challenges, particularly with increasingly stringent regulations. The overall impact of these challenges is estimated to restrain market growth by approximately xx% in 2025.
Emerging Opportunities in Data Governance Market
Emerging opportunities include the growing adoption of AI and ML for automated data governance, the increasing demand for data governance solutions in emerging markets, and the development of innovative solutions for specific industries (e.g., healthcare, finance). The integration of data governance with other technologies, such as blockchain, presents further growth potential.
Leading Players in the Data Governance Market Market
- SAS Institute Inc
- Talend SA
- Collibra NV
- TIBCO Software Inc
- IBM Corporation
- Informatica Inc
- Microsoft Corporation
- Symantec Corporation (Norton Lifelock)
- Alation Inc
- Varonis Systems Inc
- Oracle Corporation
- Alfresco Software Inc
- SAP SE
Key Developments in Data Governance Market Industry
- June 2023: Oracle announced plans to develop powerful generative AI services for organizations, collaborating with Cohere. This strengthens its data governance offerings with AI-powered automation.
- May 2023: Informatica unveiled significant innovations to its AI-Powered Intelligent Data Management Cloud (IDMC), enhancing data engineering, MDM applications, and data governance capabilities. This improves efficiency and accelerates value delivery for enterprises.
Future Outlook for Data Governance Market Market
The Data Governance market is poised for continued robust growth, driven by technological advancements, increasing data volumes, and stringent regulatory compliance needs. Strategic partnerships, acquisitions, and investments in AI/ML capabilities will further shape the market landscape, offering lucrative opportunities for both established players and new entrants. The market is expected to reach xx Million by 2033, presenting significant growth potential for stakeholders.
Data Governance Market Segmentation
-
1. Deployment
- 1.1. Cloud
- 1.2. On-premise
-
2. Organization Size
- 2.1. Large-scale Business
- 2.2. Small- and Medium-scale Business
-
3. Component
- 3.1. Software
- 3.2. Service
-
4. Business Function
- 4.1. Operation and IT
- 4.2. Legal
- 4.3. Finance
- 4.4. Other Business Functions
-
5. End-user Industry
- 5.1. IT and Telecom
- 5.2. Healthcare
- 5.3. Retail
- 5.4. Defense
- 5.5. BFSI
- 5.6. Other End-user Industries
Data Governance Market Segmentation By Geography
- 1. North America
- 2. Europe
- 3. Asia Pacific
- 4. Latin America
- 5. Middle East and Africa
Data Governance Market REPORT HIGHLIGHTS
| Aspects | Details |
|---|---|
| Study Period | 2019-2033 |
| Base Year | 2024 |
| Estimated Year | 2025 |
| Forecast Period | 2025-2033 |
| Historical Period | 2019-2024 |
| Growth Rate | CAGR of 19.72% from 2019-2033 |
| Segmentation |
|
Table of Contents
- 1. Introduction
- 1.1. Research Scope
- 1.2. Market Segmentation
- 1.3. Research Methodology
- 1.4. Definitions and Assumptions
- 2. Executive Summary
- 2.1. Introduction
- 3. Market Dynamics
- 3.1. Introduction
- 3.2. Market Drivers
- 3.2.1. Rising Regulatory and Compliance Mandates; Growth of Data Volume
- 3.3. Market Restrains
- 3.3.1. Varying Structure of Regulatory Policies and Data Address Validation
- 3.4. Market Trends
- 3.4.1. Healthcare Sector Expected to Exhibit Significant Growth Rate
- 4. Market Factor Analysis
- 4.1. Porters Five Forces
- 4.2. Supply/Value Chain
- 4.3. PESTEL analysis
- 4.4. Market Entropy
- 4.5. Patent/Trademark Analysis
- 5. Global Data Governance Market Analysis, Insights and Forecast, 2019-2031
- 5.1. Market Analysis, Insights and Forecast - by Deployment
- 5.1.1. Cloud
- 5.1.2. On-premise
- 5.2. Market Analysis, Insights and Forecast - by Organization Size
- 5.2.1. Large-scale Business
- 5.2.2. Small- and Medium-scale Business
- 5.3. Market Analysis, Insights and Forecast - by Component
- 5.3.1. Software
- 5.3.2. Service
- 5.4. Market Analysis, Insights and Forecast - by Business Function
- 5.4.1. Operation and IT
- 5.4.2. Legal
- 5.4.3. Finance
- 5.4.4. Other Business Functions
- 5.5. Market Analysis, Insights and Forecast - by End-user Industry
- 5.5.1. IT and Telecom
- 5.5.2. Healthcare
- 5.5.3. Retail
- 5.5.4. Defense
- 5.5.5. BFSI
- 5.5.6. Other End-user Industries
- 5.6. Market Analysis, Insights and Forecast - by Region
- 5.6.1. North America
- 5.6.2. Europe
- 5.6.3. Asia Pacific
- 5.6.4. Latin America
- 5.6.5. Middle East and Africa
- 5.1. Market Analysis, Insights and Forecast - by Deployment
- 6. North America Data Governance Market Analysis, Insights and Forecast, 2019-2031
- 6.1. Market Analysis, Insights and Forecast - by Deployment
- 6.1.1. Cloud
- 6.1.2. On-premise
- 6.2. Market Analysis, Insights and Forecast - by Organization Size
- 6.2.1. Large-scale Business
- 6.2.2. Small- and Medium-scale Business
- 6.3. Market Analysis, Insights and Forecast - by Component
- 6.3.1. Software
- 6.3.2. Service
- 6.4. Market Analysis, Insights and Forecast - by Business Function
- 6.4.1. Operation and IT
- 6.4.2. Legal
- 6.4.3. Finance
- 6.4.4. Other Business Functions
- 6.5. Market Analysis, Insights and Forecast - by End-user Industry
- 6.5.1. IT and Telecom
- 6.5.2. Healthcare
- 6.5.3. Retail
- 6.5.4. Defense
- 6.5.5. BFSI
- 6.5.6. Other End-user Industries
- 6.1. Market Analysis, Insights and Forecast - by Deployment
- 7. Europe Data Governance Market Analysis, Insights and Forecast, 2019-2031
- 7.1. Market Analysis, Insights and Forecast - by Deployment
- 7.1.1. Cloud
- 7.1.2. On-premise
- 7.2. Market Analysis, Insights and Forecast - by Organization Size
- 7.2.1. Large-scale Business
- 7.2.2. Small- and Medium-scale Business
- 7.3. Market Analysis, Insights and Forecast - by Component
- 7.3.1. Software
- 7.3.2. Service
- 7.4. Market Analysis, Insights and Forecast - by Business Function
- 7.4.1. Operation and IT
- 7.4.2. Legal
- 7.4.3. Finance
- 7.4.4. Other Business Functions
- 7.5. Market Analysis, Insights and Forecast - by End-user Industry
- 7.5.1. IT and Telecom
- 7.5.2. Healthcare
- 7.5.3. Retail
- 7.5.4. Defense
- 7.5.5. BFSI
- 7.5.6. Other End-user Industries
- 7.1. Market Analysis, Insights and Forecast - by Deployment
- 8. Asia Pacific Data Governance Market Analysis, Insights and Forecast, 2019-2031
- 8.1. Market Analysis, Insights and Forecast - by Deployment
- 8.1.1. Cloud
- 8.1.2. On-premise
- 8.2. Market Analysis, Insights and Forecast - by Organization Size
- 8.2.1. Large-scale Business
- 8.2.2. Small- and Medium-scale Business
- 8.3. Market Analysis, Insights and Forecast - by Component
- 8.3.1. Software
- 8.3.2. Service
- 8.4. Market Analysis, Insights and Forecast - by Business Function
- 8.4.1. Operation and IT
- 8.4.2. Legal
- 8.4.3. Finance
- 8.4.4. Other Business Functions
- 8.5. Market Analysis, Insights and Forecast - by End-user Industry
- 8.5.1. IT and Telecom
- 8.5.2. Healthcare
- 8.5.3. Retail
- 8.5.4. Defense
- 8.5.5. BFSI
- 8.5.6. Other End-user Industries
- 8.1. Market Analysis, Insights and Forecast - by Deployment
- 9. Latin America Data Governance Market Analysis, Insights and Forecast, 2019-2031
- 9.1. Market Analysis, Insights and Forecast - by Deployment
- 9.1.1. Cloud
- 9.1.2. On-premise
- 9.2. Market Analysis, Insights and Forecast - by Organization Size
- 9.2.1. Large-scale Business
- 9.2.2. Small- and Medium-scale Business
- 9.3. Market Analysis, Insights and Forecast - by Component
- 9.3.1. Software
- 9.3.2. Service
- 9.4. Market Analysis, Insights and Forecast - by Business Function
- 9.4.1. Operation and IT
- 9.4.2. Legal
- 9.4.3. Finance
- 9.4.4. Other Business Functions
- 9.5. Market Analysis, Insights and Forecast - by End-user Industry
- 9.5.1. IT and Telecom
- 9.5.2. Healthcare
- 9.5.3. Retail
- 9.5.4. Defense
- 9.5.5. BFSI
- 9.5.6. Other End-user Industries
- 9.1. Market Analysis, Insights and Forecast - by Deployment
- 10. Middle East and Africa Data Governance Market Analysis, Insights and Forecast, 2019-2031
- 10.1. Market Analysis, Insights and Forecast - by Deployment
- 10.1.1. Cloud
- 10.1.2. On-premise
- 10.2. Market Analysis, Insights and Forecast - by Organization Size
- 10.2.1. Large-scale Business
- 10.2.2. Small- and Medium-scale Business
- 10.3. Market Analysis, Insights and Forecast - by Component
- 10.3.1. Software
- 10.3.2. Service
- 10.4. Market Analysis, Insights and Forecast - by Business Function
- 10.4.1. Operation and IT
- 10.4.2. Legal
- 10.4.3. Finance
- 10.4.4. Other Business Functions
- 10.5. Market Analysis, Insights and Forecast - by End-user Industry
- 10.5.1. IT and Telecom
- 10.5.2. Healthcare
- 10.5.3. Retail
- 10.5.4. Defense
- 10.5.5. BFSI
- 10.5.6. Other End-user Industries
- 10.1. Market Analysis, Insights and Forecast - by Deployment
- 11. North America Data Governance Market Analysis, Insights and Forecast, 2019-2031
- 11.1. Market Analysis, Insights and Forecast - By Country/Sub-region
- 11.1.1 United States
- 11.1.2 Canada
- 11.1.3 Mexico
- 12. Europe Data Governance Market Analysis, Insights and Forecast, 2019-2031
- 12.1. Market Analysis, Insights and Forecast - By Country/Sub-region
- 12.1.1 Germany
- 12.1.2 United Kingdom
- 12.1.3 France
- 12.1.4 Spain
- 12.1.5 Italy
- 12.1.6 Spain
- 12.1.7 Belgium
- 12.1.8 Netherland
- 12.1.9 Nordics
- 12.1.10 Rest of Europe
- 13. Asia Pacific Data Governance Market Analysis, Insights and Forecast, 2019-2031
- 13.1. Market Analysis, Insights and Forecast - By Country/Sub-region
- 13.1.1 China
- 13.1.2 Japan
- 13.1.3 India
- 13.1.4 South Korea
- 13.1.5 Southeast Asia
- 13.1.6 Australia
- 13.1.7 Indonesia
- 13.1.8 Phillipes
- 13.1.9 Singapore
- 13.1.10 Thailandc
- 13.1.11 Rest of Asia Pacific
- 14. South America Data Governance Market Analysis, Insights and Forecast, 2019-2031
- 14.1. Market Analysis, Insights and Forecast - By Country/Sub-region
- 14.1.1 Brazil
- 14.1.2 Argentina
- 14.1.3 Peru
- 14.1.4 Chile
- 14.1.5 Colombia
- 14.1.6 Ecuador
- 14.1.7 Venezuela
- 14.1.8 Rest of South America
- 15. North America Data Governance Market Analysis, Insights and Forecast, 2019-2031
- 15.1. Market Analysis, Insights and Forecast - By Country/Sub-region
- 15.1.1 United States
- 15.1.2 Canada
- 15.1.3 Mexico
- 16. MEA Data Governance Market Analysis, Insights and Forecast, 2019-2031
- 16.1. Market Analysis, Insights and Forecast - By Country/Sub-region
- 16.1.1 United Arab Emirates
- 16.1.2 Saudi Arabia
- 16.1.3 South Africa
- 16.1.4 Rest of Middle East and Africa
- 17. Competitive Analysis
- 17.1. Global Market Share Analysis 2024
- 17.2. Company Profiles
- 17.2.1 SAS Institute Inc
- 17.2.1.1. Overview
- 17.2.1.2. Products
- 17.2.1.3. SWOT Analysis
- 17.2.1.4. Recent Developments
- 17.2.1.5. Financials (Based on Availability)
- 17.2.2 Talend SA
- 17.2.2.1. Overview
- 17.2.2.2. Products
- 17.2.2.3. SWOT Analysis
- 17.2.2.4. Recent Developments
- 17.2.2.5. Financials (Based on Availability)
- 17.2.3 Collibra NV
- 17.2.3.1. Overview
- 17.2.3.2. Products
- 17.2.3.3. SWOT Analysis
- 17.2.3.4. Recent Developments
- 17.2.3.5. Financials (Based on Availability)
- 17.2.4 TIBCO Software Inc
- 17.2.4.1. Overview
- 17.2.4.2. Products
- 17.2.4.3. SWOT Analysis
- 17.2.4.4. Recent Developments
- 17.2.4.5. Financials (Based on Availability)
- 17.2.5 IBM Corporation
- 17.2.5.1. Overview
- 17.2.5.2. Products
- 17.2.5.3. SWOT Analysis
- 17.2.5.4. Recent Developments
- 17.2.5.5. Financials (Based on Availability)
- 17.2.6 Informatica Inc
- 17.2.6.1. Overview
- 17.2.6.2. Products
- 17.2.6.3. SWOT Analysis
- 17.2.6.4. Recent Developments
- 17.2.6.5. Financials (Based on Availability)
- 17.2.7 Microsoft Corporation
- 17.2.7.1. Overview
- 17.2.7.2. Products
- 17.2.7.3. SWOT Analysis
- 17.2.7.4. Recent Developments
- 17.2.7.5. Financials (Based on Availability)
- 17.2.8 Symantec Corporation (Norton Lifelock)
- 17.2.8.1. Overview
- 17.2.8.2. Products
- 17.2.8.3. SWOT Analysis
- 17.2.8.4. Recent Developments
- 17.2.8.5. Financials (Based on Availability)
- 17.2.9 Alation Inc
- 17.2.9.1. Overview
- 17.2.9.2. Products
- 17.2.9.3. SWOT Analysis
- 17.2.9.4. Recent Developments
- 17.2.9.5. Financials (Based on Availability)
- 17.2.10 Varonis Systems Inc
- 17.2.10.1. Overview
- 17.2.10.2. Products
- 17.2.10.3. SWOT Analysis
- 17.2.10.4. Recent Developments
- 17.2.10.5. Financials (Based on Availability)
- 17.2.11 Oracle Corporation
- 17.2.11.1. Overview
- 17.2.11.2. Products
- 17.2.11.3. SWOT Analysis
- 17.2.11.4. Recent Developments
- 17.2.11.5. Financials (Based on Availability)
- 17.2.12 Alfresco Software Inc
- 17.2.12.1. Overview
- 17.2.12.2. Products
- 17.2.12.3. SWOT Analysis
- 17.2.12.4. Recent Developments
- 17.2.12.5. Financials (Based on Availability)
- 17.2.13 SAP SE
- 17.2.13.1. Overview
- 17.2.13.2. Products
- 17.2.13.3. SWOT Analysis
- 17.2.13.4. Recent Developments
- 17.2.13.5. Financials (Based on Availability)
- 17.2.1 SAS Institute Inc
List of Figures
- Figure 1: Global Data Governance Market Revenue Breakdown (Million, %) by Region 2024 & 2032
- Figure 2: North America Data Governance Market Revenue (Million), by Country 2024 & 2032
- Figure 3: North America Data Governance Market Revenue Share (%), by Country 2024 & 2032
- Figure 4: Europe Data Governance Market Revenue (Million), by Country 2024 & 2032
- Figure 5: Europe Data Governance Market Revenue Share (%), by Country 2024 & 2032
- Figure 6: Asia Pacific Data Governance Market Revenue (Million), by Country 2024 & 2032
- Figure 7: Asia Pacific Data Governance Market Revenue Share (%), by Country 2024 & 2032
- Figure 8: South America Data Governance Market Revenue (Million), by Country 2024 & 2032
- Figure 9: South America Data Governance Market Revenue Share (%), by Country 2024 & 2032
- Figure 10: North America Data Governance Market Revenue (Million), by Country 2024 & 2032
- Figure 11: North America Data Governance Market Revenue Share (%), by Country 2024 & 2032
- Figure 12: MEA Data Governance Market Revenue (Million), by Country 2024 & 2032
- Figure 13: MEA Data Governance Market Revenue Share (%), by Country 2024 & 2032
- Figure 14: North America Data Governance Market Revenue (Million), by Deployment 2024 & 2032
- Figure 15: North America Data Governance Market Revenue Share (%), by Deployment 2024 & 2032
- Figure 16: North America Data Governance Market Revenue (Million), by Organization Size 2024 & 2032
- Figure 17: North America Data Governance Market Revenue Share (%), by Organization Size 2024 & 2032
- Figure 18: North America Data Governance Market Revenue (Million), by Component 2024 & 2032
- Figure 19: North America Data Governance Market Revenue Share (%), by Component 2024 & 2032
- Figure 20: North America Data Governance Market Revenue (Million), by Business Function 2024 & 2032
- Figure 21: North America Data Governance Market Revenue Share (%), by Business Function 2024 & 2032
- Figure 22: North America Data Governance Market Revenue (Million), by End-user Industry 2024 & 2032
- Figure 23: North America Data Governance Market Revenue Share (%), by End-user Industry 2024 & 2032
- Figure 24: North America Data Governance Market Revenue (Million), by Country 2024 & 2032
- Figure 25: North America Data Governance Market Revenue Share (%), by Country 2024 & 2032
- Figure 26: Europe Data Governance Market Revenue (Million), by Deployment 2024 & 2032
- Figure 27: Europe Data Governance Market Revenue Share (%), by Deployment 2024 & 2032
- Figure 28: Europe Data Governance Market Revenue (Million), by Organization Size 2024 & 2032
- Figure 29: Europe Data Governance Market Revenue Share (%), by Organization Size 2024 & 2032
- Figure 30: Europe Data Governance Market Revenue (Million), by Component 2024 & 2032
- Figure 31: Europe Data Governance Market Revenue Share (%), by Component 2024 & 2032
- Figure 32: Europe Data Governance Market Revenue (Million), by Business Function 2024 & 2032
- Figure 33: Europe Data Governance Market Revenue Share (%), by Business Function 2024 & 2032
- Figure 34: Europe Data Governance Market Revenue (Million), by End-user Industry 2024 & 2032
- Figure 35: Europe Data Governance Market Revenue Share (%), by End-user Industry 2024 & 2032
- Figure 36: Europe Data Governance Market Revenue (Million), by Country 2024 & 2032
- Figure 37: Europe Data Governance Market Revenue Share (%), by Country 2024 & 2032
- Figure 38: Asia Pacific Data Governance Market Revenue (Million), by Deployment 2024 & 2032
- Figure 39: Asia Pacific Data Governance Market Revenue Share (%), by Deployment 2024 & 2032
- Figure 40: Asia Pacific Data Governance Market Revenue (Million), by Organization Size 2024 & 2032
- Figure 41: Asia Pacific Data Governance Market Revenue Share (%), by Organization Size 2024 & 2032
- Figure 42: Asia Pacific Data Governance Market Revenue (Million), by Component 2024 & 2032
- Figure 43: Asia Pacific Data Governance Market Revenue Share (%), by Component 2024 & 2032
- Figure 44: Asia Pacific Data Governance Market Revenue (Million), by Business Function 2024 & 2032
- Figure 45: Asia Pacific Data Governance Market Revenue Share (%), by Business Function 2024 & 2032
- Figure 46: Asia Pacific Data Governance Market Revenue (Million), by End-user Industry 2024 & 2032
- Figure 47: Asia Pacific Data Governance Market Revenue Share (%), by End-user Industry 2024 & 2032
- Figure 48: Asia Pacific Data Governance Market Revenue (Million), by Country 2024 & 2032
- Figure 49: Asia Pacific Data Governance Market Revenue Share (%), by Country 2024 & 2032
- Figure 50: Latin America Data Governance Market Revenue (Million), by Deployment 2024 & 2032
- Figure 51: Latin America Data Governance Market Revenue Share (%), by Deployment 2024 & 2032
- Figure 52: Latin America Data Governance Market Revenue (Million), by Organization Size 2024 & 2032
- Figure 53: Latin America Data Governance Market Revenue Share (%), by Organization Size 2024 & 2032
- Figure 54: Latin America Data Governance Market Revenue (Million), by Component 2024 & 2032
- Figure 55: Latin America Data Governance Market Revenue Share (%), by Component 2024 & 2032
- Figure 56: Latin America Data Governance Market Revenue (Million), by Business Function 2024 & 2032
- Figure 57: Latin America Data Governance Market Revenue Share (%), by Business Function 2024 & 2032
- Figure 58: Latin America Data Governance Market Revenue (Million), by End-user Industry 2024 & 2032
- Figure 59: Latin America Data Governance Market Revenue Share (%), by End-user Industry 2024 & 2032
- Figure 60: Latin America Data Governance Market Revenue (Million), by Country 2024 & 2032
- Figure 61: Latin America Data Governance Market Revenue Share (%), by Country 2024 & 2032
- Figure 62: Middle East and Africa Data Governance Market Revenue (Million), by Deployment 2024 & 2032
- Figure 63: Middle East and Africa Data Governance Market Revenue Share (%), by Deployment 2024 & 2032
- Figure 64: Middle East and Africa Data Governance Market Revenue (Million), by Organization Size 2024 & 2032
- Figure 65: Middle East and Africa Data Governance Market Revenue Share (%), by Organization Size 2024 & 2032
- Figure 66: Middle East and Africa Data Governance Market Revenue (Million), by Component 2024 & 2032
- Figure 67: Middle East and Africa Data Governance Market Revenue Share (%), by Component 2024 & 2032
- Figure 68: Middle East and Africa Data Governance Market Revenue (Million), by Business Function 2024 & 2032
- Figure 69: Middle East and Africa Data Governance Market Revenue Share (%), by Business Function 2024 & 2032
- Figure 70: Middle East and Africa Data Governance Market Revenue (Million), by End-user Industry 2024 & 2032
- Figure 71: Middle East and Africa Data Governance Market Revenue Share (%), by End-user Industry 2024 & 2032
- Figure 72: Middle East and Africa Data Governance Market Revenue (Million), by Country 2024 & 2032
- Figure 73: Middle East and Africa Data Governance Market Revenue Share (%), by Country 2024 & 2032
List of Tables
- Table 1: Global Data Governance Market Revenue Million Forecast, by Region 2019 & 2032
- Table 2: Global Data Governance Market Revenue Million Forecast, by Deployment 2019 & 2032
- Table 3: Global Data Governance Market Revenue Million Forecast, by Organization Size 2019 & 2032
- Table 4: Global Data Governance Market Revenue Million Forecast, by Component 2019 & 2032
- Table 5: Global Data Governance Market Revenue Million Forecast, by Business Function 2019 & 2032
- Table 6: Global Data Governance Market Revenue Million Forecast, by End-user Industry 2019 & 2032
- Table 7: Global Data Governance Market Revenue Million Forecast, by Region 2019 & 2032
- Table 8: Global Data Governance Market Revenue Million Forecast, by Country 2019 & 2032
- Table 9: United States Data Governance Market Revenue (Million) Forecast, by Application 2019 & 2032
- Table 10: Canada Data Governance Market Revenue (Million) Forecast, by Application 2019 & 2032
- Table 11: Mexico Data Governance Market Revenue (Million) Forecast, by Application 2019 & 2032
- Table 12: Global Data Governance Market Revenue Million Forecast, by Country 2019 & 2032
- Table 13: Germany Data Governance Market Revenue (Million) Forecast, by Application 2019 & 2032
- Table 14: United Kingdom Data Governance Market Revenue (Million) Forecast, by Application 2019 & 2032
- Table 15: France Data Governance Market Revenue (Million) Forecast, by Application 2019 & 2032
- Table 16: Spain Data Governance Market Revenue (Million) Forecast, by Application 2019 & 2032
- Table 17: Italy Data Governance Market Revenue (Million) Forecast, by Application 2019 & 2032
- Table 18: Spain Data Governance Market Revenue (Million) Forecast, by Application 2019 & 2032
- Table 19: Belgium Data Governance Market Revenue (Million) Forecast, by Application 2019 & 2032
- Table 20: Netherland Data Governance Market Revenue (Million) Forecast, by Application 2019 & 2032
- Table 21: Nordics Data Governance Market Revenue (Million) Forecast, by Application 2019 & 2032
- Table 22: Rest of Europe Data Governance Market Revenue (Million) Forecast, by Application 2019 & 2032
- Table 23: Global Data Governance Market Revenue Million Forecast, by Country 2019 & 2032
- Table 24: China Data Governance Market Revenue (Million) Forecast, by Application 2019 & 2032
- Table 25: Japan Data Governance Market Revenue (Million) Forecast, by Application 2019 & 2032
- Table 26: India Data Governance Market Revenue (Million) Forecast, by Application 2019 & 2032
- Table 27: South Korea Data Governance Market Revenue (Million) Forecast, by Application 2019 & 2032
- Table 28: Southeast Asia Data Governance Market Revenue (Million) Forecast, by Application 2019 & 2032
- Table 29: Australia Data Governance Market Revenue (Million) Forecast, by Application 2019 & 2032
- Table 30: Indonesia Data Governance Market Revenue (Million) Forecast, by Application 2019 & 2032
- Table 31: Phillipes Data Governance Market Revenue (Million) Forecast, by Application 2019 & 2032
- Table 32: Singapore Data Governance Market Revenue (Million) Forecast, by Application 2019 & 2032
- Table 33: Thailandc Data Governance Market Revenue (Million) Forecast, by Application 2019 & 2032
- Table 34: Rest of Asia Pacific Data Governance Market Revenue (Million) Forecast, by Application 2019 & 2032
- Table 35: Global Data Governance Market Revenue Million Forecast, by Country 2019 & 2032
- Table 36: Brazil Data Governance Market Revenue (Million) Forecast, by Application 2019 & 2032
- Table 37: Argentina Data Governance Market Revenue (Million) Forecast, by Application 2019 & 2032
- Table 38: Peru Data Governance Market Revenue (Million) Forecast, by Application 2019 & 2032
- Table 39: Chile Data Governance Market Revenue (Million) Forecast, by Application 2019 & 2032
- Table 40: Colombia Data Governance Market Revenue (Million) Forecast, by Application 2019 & 2032
- Table 41: Ecuador Data Governance Market Revenue (Million) Forecast, by Application 2019 & 2032
- Table 42: Venezuela Data Governance Market Revenue (Million) Forecast, by Application 2019 & 2032
- Table 43: Rest of South America Data Governance Market Revenue (Million) Forecast, by Application 2019 & 2032
- Table 44: Global Data Governance Market Revenue Million Forecast, by Country 2019 & 2032
- Table 45: United States Data Governance Market Revenue (Million) Forecast, by Application 2019 & 2032
- Table 46: Canada Data Governance Market Revenue (Million) Forecast, by Application 2019 & 2032
- Table 47: Mexico Data Governance Market Revenue (Million) Forecast, by Application 2019 & 2032
- Table 48: Global Data Governance Market Revenue Million Forecast, by Country 2019 & 2032
- Table 49: United Arab Emirates Data Governance Market Revenue (Million) Forecast, by Application 2019 & 2032
- Table 50: Saudi Arabia Data Governance Market Revenue (Million) Forecast, by Application 2019 & 2032
- Table 51: South Africa Data Governance Market Revenue (Million) Forecast, by Application 2019 & 2032
- Table 52: Rest of Middle East and Africa Data Governance Market Revenue (Million) Forecast, by Application 2019 & 2032
- Table 53: Global Data Governance Market Revenue Million Forecast, by Deployment 2019 & 2032
- Table 54: Global Data Governance Market Revenue Million Forecast, by Organization Size 2019 & 2032
- Table 55: Global Data Governance Market Revenue Million Forecast, by Component 2019 & 2032
- Table 56: Global Data Governance Market Revenue Million Forecast, by Business Function 2019 & 2032
- Table 57: Global Data Governance Market Revenue Million Forecast, by End-user Industry 2019 & 2032
- Table 58: Global Data Governance Market Revenue Million Forecast, by Country 2019 & 2032
- Table 59: Global Data Governance Market Revenue Million Forecast, by Deployment 2019 & 2032
- Table 60: Global Data Governance Market Revenue Million Forecast, by Organization Size 2019 & 2032
- Table 61: Global Data Governance Market Revenue Million Forecast, by Component 2019 & 2032
- Table 62: Global Data Governance Market Revenue Million Forecast, by Business Function 2019 & 2032
- Table 63: Global Data Governance Market Revenue Million Forecast, by End-user Industry 2019 & 2032
- Table 64: Global Data Governance Market Revenue Million Forecast, by Country 2019 & 2032
- Table 65: Global Data Governance Market Revenue Million Forecast, by Deployment 2019 & 2032
- Table 66: Global Data Governance Market Revenue Million Forecast, by Organization Size 2019 & 2032
- Table 67: Global Data Governance Market Revenue Million Forecast, by Component 2019 & 2032
- Table 68: Global Data Governance Market Revenue Million Forecast, by Business Function 2019 & 2032
- Table 69: Global Data Governance Market Revenue Million Forecast, by End-user Industry 2019 & 2032
- Table 70: Global Data Governance Market Revenue Million Forecast, by Country 2019 & 2032
- Table 71: Global Data Governance Market Revenue Million Forecast, by Deployment 2019 & 2032
- Table 72: Global Data Governance Market Revenue Million Forecast, by Organization Size 2019 & 2032
- Table 73: Global Data Governance Market Revenue Million Forecast, by Component 2019 & 2032
- Table 74: Global Data Governance Market Revenue Million Forecast, by Business Function 2019 & 2032
- Table 75: Global Data Governance Market Revenue Million Forecast, by End-user Industry 2019 & 2032
- Table 76: Global Data Governance Market Revenue Million Forecast, by Country 2019 & 2032
- Table 77: Global Data Governance Market Revenue Million Forecast, by Deployment 2019 & 2032
- Table 78: Global Data Governance Market Revenue Million Forecast, by Organization Size 2019 & 2032
- Table 79: Global Data Governance Market Revenue Million Forecast, by Component 2019 & 2032
- Table 80: Global Data Governance Market Revenue Million Forecast, by Business Function 2019 & 2032
- Table 81: Global Data Governance Market Revenue Million Forecast, by End-user Industry 2019 & 2032
- Table 82: Global Data Governance Market Revenue Million Forecast, by Country 2019 & 2032
Frequently Asked Questions
1. What is the projected Compound Annual Growth Rate (CAGR) of the Data Governance Market?
The projected CAGR is approximately 19.72%.
2. Which companies are prominent players in the Data Governance Market?
Key companies in the market include SAS Institute Inc, Talend SA, Collibra NV, TIBCO Software Inc, IBM Corporation, Informatica Inc, Microsoft Corporation, Symantec Corporation (Norton Lifelock), Alation Inc, Varonis Systems Inc , Oracle Corporation, Alfresco Software Inc, SAP SE.
3. What are the main segments of the Data Governance Market?
The market segments include Deployment, Organization Size, Component, Business Function, End-user Industry.
4. Can you provide details about the market size?
The market size is estimated to be USD 3.27 Million as of 2022.
5. What are some drivers contributing to market growth?
Rising Regulatory and Compliance Mandates; Growth of Data Volume.
6. What are the notable trends driving market growth?
Healthcare Sector Expected to Exhibit Significant Growth Rate.
7. Are there any restraints impacting market growth?
Varying Structure of Regulatory Policies and Data Address Validation.
8. Can you provide examples of recent developments in the market?
June 2023 - Oracle announced its plans to develop powerful, generative AI services for organizations across the world. The company will provide native generative AI services to help organizations automate end-to-end business processes, improve decision-making, and enhance customer experiences, in collaboration with Cohere, a leading AI platform for enterprise.
9. What pricing options are available for accessing the report?
Pricing options include single-user, multi-user, and enterprise licenses priced at USD 4750, USD 5250, and USD 8750 respectively.
10. Is the market size provided in terms of value or volume?
The market size is provided in terms of value, measured in Million.
11. Are there any specific market keywords associated with the report?
Yes, the market keyword associated with the report is "Data Governance Market," which aids in identifying and referencing the specific market segment covered.
12. How do I determine which pricing option suits my needs best?
The pricing options vary based on user requirements and access needs. Individual users may opt for single-user licenses, while businesses requiring broader access may choose multi-user or enterprise licenses for cost-effective access to the report.
13. Are there any additional resources or data provided in the Data Governance Market report?
While the report offers comprehensive insights, it's advisable to review the specific contents or supplementary materials provided to ascertain if additional resources or data are available.
14. How can I stay updated on further developments or reports in the Data Governance Market?
To stay informed about further developments, trends, and reports in the Data Governance Market, consider subscribing to industry newsletters, following relevant companies and organizations, or regularly checking reputable industry news sources and publications.
Methodology
Step 1 - Identification of Relevant Samples Size from Population Database


Step 2 - Approaches for Defining Global Market Size (Value, Volume* & Price*)

Note*: In applicable scenarios
Step 3 - Data Sources
Primary Research
- Web Analytics
- Survey Reports
- Research Institute
- Latest Research Reports
- Opinion Leaders
Secondary Research
- Annual Reports
- White Paper
- Latest Press Release
- Industry Association
- Paid Database
- Investor Presentations

Step 4 - Data Triangulation
Involves using different sources of information in order to increase the validity of a study
These sources are likely to be stakeholders in a program - participants, other researchers, program staff, other community members, and so on.
Then we put all data in single framework & apply various statistical tools to find out the dynamic on the market.
During the analysis stage, feedback from the stakeholder groups would be compared to determine areas of agreement as well as areas of divergence


