
Key Insights
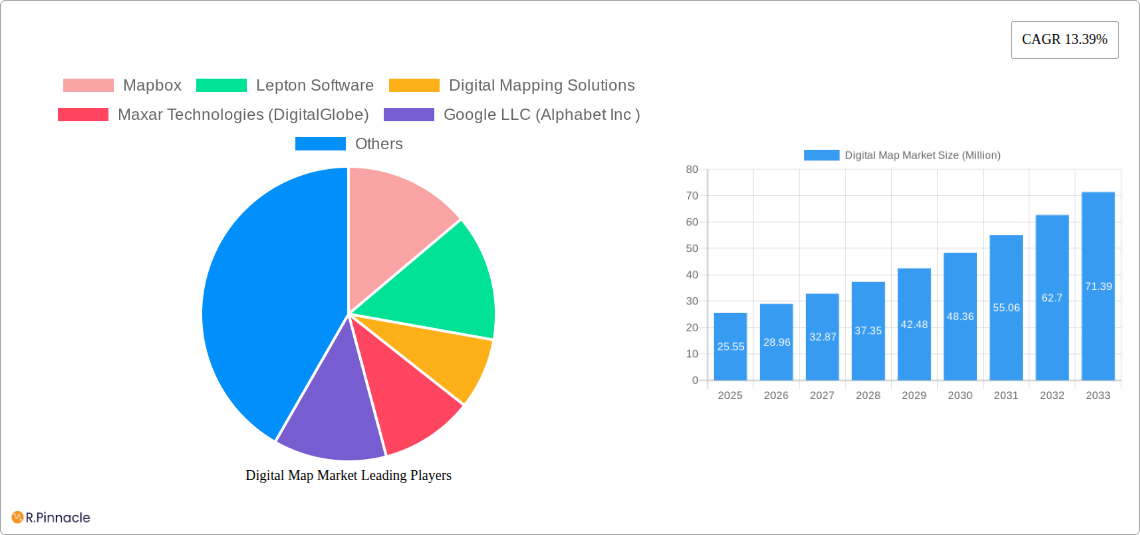
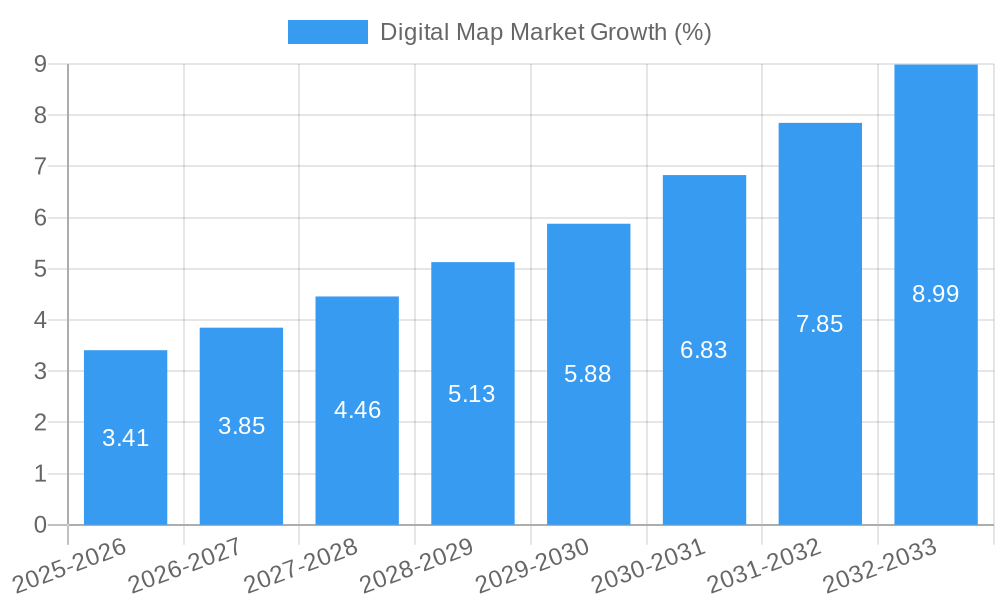
The digital map market is experiencing robust growth, projected to reach \$25.55 million in 2025 and exhibiting a Compound Annual Growth Rate (CAGR) of 13.39% from 2025 to 2033. This expansion is driven by several key factors. Firstly, the increasing adoption of location-based services (LBS) across diverse sectors like automotive, logistics, and utilities fuels demand for precise and up-to-date digital maps. Secondly, advancements in technologies such as AI and machine learning are enhancing map accuracy, functionality, and the development of sophisticated features like real-time traffic updates and augmented reality navigation. The shift towards cloud-based deployment models further contributes to market growth, offering scalability, accessibility, and cost-effectiveness compared to on-premise solutions. The market is segmented by solution (software and services), deployment (on-premise and cloud), and industry, with automotive, engineering & construction, and logistics & transportation currently representing major market segments. Competition is fierce, with established players like Google, TomTom, and Mapbox alongside specialized providers like ESRI and HERE Technologies vying for market share. Future growth will depend on continuous innovation in mapping technologies, expansion into emerging markets, and the effective integration of digital maps into various applications and platforms.
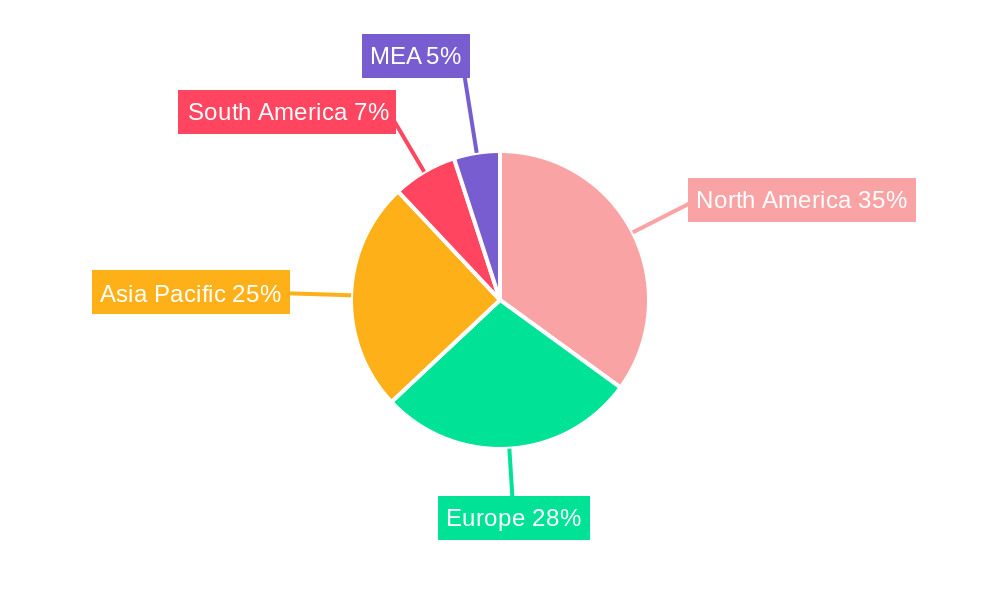
The geographical distribution of the digital map market reveals significant regional variations. North America, with its strong technological infrastructure and adoption of LBS, currently holds a substantial market share. However, rapid growth is expected in Asia-Pacific, driven by increasing smartphone penetration, urban development, and burgeoning digital economies in countries like China and India. Europe also presents a significant market, with established players and robust digital infrastructure. South America and the Middle East & Africa regions show promising potential, although their growth trajectories may be influenced by factors such as economic development and infrastructure investments. The forecast period (2025-2033) anticipates a continuation of the current trends, with a steady increase in market size driven by technological innovation, increased demand across various industries, and expansion into new geographical territories. The competitive landscape is expected to remain dynamic, with ongoing mergers, acquisitions, and the emergence of new players further shaping the market landscape.
Digital Map Market Report: 2019-2033 Forecast
This comprehensive report provides an in-depth analysis of the global Digital Map Market, offering invaluable insights for industry professionals, investors, and strategic decision-makers. Covering the period 2019-2033, with a focus on 2025, this report meticulously examines market dynamics, competitive landscapes, and future growth projections, valued at millions.
Digital Map Market Market Structure & Innovation Trends
The Digital Map Market exhibits a moderately concentrated structure, with key players such as Mapbox, Google LLC (Alphabet Inc), and TomTom International B.V. holding significant market share. However, the market also features numerous smaller, specialized players catering to niche segments. Innovation is driven by advancements in AI, machine learning, and high-resolution satellite imagery, leading to more accurate, detailed, and feature-rich maps. Regulatory frameworks, varying by region, significantly influence data collection and usage. Product substitutes, like traditional paper maps, are minimal, but alternative technologies, such as augmented reality navigation, pose a potential threat. End-user demographics are broad, encompassing various industries and individuals. M&A activity in the sector has been moderate, with deal values averaging xx Million in recent years.
- Market Concentration: Moderately Concentrated
- Key Players Market Share: Mapbox: xx%, Google: xx%, TomTom: xx%, Others: xx%
- Average M&A Deal Value (2019-2024): xx Million
- Innovation Drivers: AI, Machine Learning, High-Resolution Satellite Imagery
- Regulatory Frameworks: Vary by region, impacting data collection and usage
Digital Map Market Market Dynamics & Trends
The Digital Map Market is experiencing robust growth, projected to achieve a CAGR of xx% during the forecast period (2025-2033). This growth is propelled by increasing demand across various industries, particularly automotive, logistics, and telecommunications. Technological disruptions, such as the rise of autonomous vehicles and the Internet of Things (IoT), are further fueling market expansion. Consumer preferences are shifting towards more personalized and interactive mapping experiences. Competitive dynamics are intense, with companies focusing on innovation, strategic partnerships, and data acquisition to gain a competitive edge. Market penetration is high in developed regions, but significant growth potential exists in emerging markets.
Dominant Regions & Segments in Digital Map Market
North America currently holds the largest market share, driven by robust technological advancements and high adoption rates across various industries. Within the segment analysis:
- By Solution: The Software segment is currently the dominant solution type, owing to its flexibility and scalability. The Services segment is expected to witness significant growth driven by increasing demand for specialized mapping services.
- By Deployment: Cloud-based deployments are gaining traction due to cost-effectiveness and accessibility. However, on-premise deployments continue to hold a significant share, especially in sectors requiring high data security.
- By Industry: The Automotive industry remains a significant driver, followed by Logistics & Transportation, and Engineering & Construction. The Energy & Utilities sector is also showing promising growth due to the increasing need for efficient network management.
Key Drivers:
- North America: Strong technological infrastructure, high adoption rates, and government support.
- Europe: Growing demand for smart city initiatives and autonomous vehicles.
- Asia-Pacific: Rapid urbanization and increasing investments in digital infrastructure.
Digital Map Market Product Innovations
Recent product innovations focus on enhanced accuracy, real-time updates, 3D mapping capabilities, and integration with other technologies, such as augmented reality and IoT devices. These advancements cater to evolving user needs and provide competitive advantages to companies in terms of data quality and user experience. The market is witnessing a trend towards cloud-based, scalable solutions offering seamless integration and improved accessibility.
Report Scope & Segmentation Analysis
This report segments the Digital Map Market by Solution (Software, Services), Deployment (On-Premise, Cloud), and Industry (Automotive, Engineering & Construction, Logistics & Transportation, Energy & Utilities, Telecommunication, Other Industries). Each segment's growth projections, market size, and competitive dynamics are thoroughly analyzed. The Software segment is projected to maintain a xx Million market value by 2033, while the Cloud deployment model is expected to experience rapid growth, reaching xx Million. The Automotive industry will continue to dominate market share, projected at xx Million in 2033.
Key Drivers of Digital Map Market Growth
The Digital Map Market's growth is driven by several key factors: the increasing adoption of location-based services, the rise of autonomous vehicles and the Internet of Things (IoT), government initiatives promoting smart city development, and the growing demand for accurate and real-time mapping data across various industries.
Challenges in the Digital Map Market Sector
Challenges include the high cost of data acquisition and maintenance, the need for continuous updates to maintain accuracy, concerns regarding data privacy and security, and intense competition among existing players. These factors can impact market growth and profitability.
Emerging Opportunities in Digital Map Market
Emerging opportunities lie in the development of high-definition (HD) maps for autonomous vehicles, the integration of digital maps with augmented reality (AR) and virtual reality (VR) technologies, the expansion into emerging markets, and the increasing demand for specialized mapping solutions tailored to specific industry needs.
Leading Players in the Digital Map Market Market
- Mapbox
- Lepton Software
- Digital Mapping Solutions
- Maxar Technologies (DigitalGlobe)
- Google LLC (Alphabet Inc)
- Collins Bartholomew Ltd
- DMTI Spatial
- Digital Map Products Inc
- ThinkGeo LLC
- MapData Services Pty Ltd
- ESRI Business Information Solutions Inc
- TomTom International B.V.
- HERE Technologies
Key Developments in Digital Map Market Industry
- July 27, 2022: Google launched its Street View experience in India, expanding its reach and market share.
- December 2022: The formation of the Overture Maps Foundation signifies a major shift towards open and interoperable map data, potentially disrupting the market landscape.
Future Outlook for Digital Map Market Market
The Digital Map Market is poised for continued expansion, driven by technological advancements, increasing demand across diverse industries, and the emergence of new applications. Strategic partnerships, data acquisitions, and investments in innovation will be crucial for companies to maintain a competitive edge and capitalize on the significant growth potential.
Digital Map Market Segmentation
-
1. Solution
- 1.1. Software
- 1.2. Services
-
2. Deployment
- 2.1. On-Premise
- 2.2. Cloud
-
3. Industry
- 3.1. Automotive
- 3.2. Engineering & Construction
- 3.3. Logistics & Transportation
- 3.4. Energy & Utilities
- 3.5. Telecommunication
- 3.6. Other Industries
Digital Map Market Segmentation By Geography
-
1. North America
- 1.1. United States
- 1.2. Canada
-
2. Europe
- 2.1. United Kingdom
- 2.2. Germany
- 2.3. France
- 2.4. Rest of Europe
-
3. Asia Pacific
- 3.1. China
- 3.2. Japan
- 3.3. India
- 3.4. Rest of Asia Pacific
- 4. Rest of the World
Digital Map Market REPORT HIGHLIGHTS
| Aspects | Details |
|---|---|
| Study Period | 2019-2033 |
| Base Year | 2024 |
| Estimated Year | 2025 |
| Forecast Period | 2025-2033 |
| Historical Period | 2019-2024 |
| Growth Rate | CAGR of 13.39% from 2019-2033 |
| Segmentation |
|
Table of Contents
- 1. Introduction
- 1.1. Research Scope
- 1.2. Market Segmentation
- 1.3. Research Methodology
- 1.4. Definitions and Assumptions
- 2. Executive Summary
- 2.1. Introduction
- 3. Market Dynamics
- 3.1. Introduction
- 3.2. Market Drivers
- 3.2.1. Growth in Application for Advanced Navigation System in Automotive Industry; Surge in Demand for Geographic Information System (GIS); Increased Adoption of Connected Devices and Internet
- 3.3. Market Restrains
- 3.3.1. Complexity in Integration of Traditional Maps with Modern GIS System
- 3.4. Market Trends
- 3.4.1. Surge in Demand for GIS and GNSS to Influence the Adoption of Digital Map Technology
- 4. Market Factor Analysis
- 4.1. Porters Five Forces
- 4.2. Supply/Value Chain
- 4.3. PESTEL analysis
- 4.4. Market Entropy
- 4.5. Patent/Trademark Analysis
- 5. Global Digital Map Market Analysis, Insights and Forecast, 2019-2031
- 5.1. Market Analysis, Insights and Forecast - by Solution
- 5.1.1. Software
- 5.1.2. Services
- 5.2. Market Analysis, Insights and Forecast - by Deployment
- 5.2.1. On-Premise
- 5.2.2. Cloud
- 5.3. Market Analysis, Insights and Forecast - by Industry
- 5.3.1. Automotive
- 5.3.2. Engineering & Construction
- 5.3.3. Logistics & Transportation
- 5.3.4. Energy & Utilities
- 5.3.5. Telecommunication
- 5.3.6. Other Industries
- 5.4. Market Analysis, Insights and Forecast - by Region
- 5.4.1. North America
- 5.4.2. Europe
- 5.4.3. Asia Pacific
- 5.4.4. Rest of the World
- 5.1. Market Analysis, Insights and Forecast - by Solution
- 6. North America Digital Map Market Analysis, Insights and Forecast, 2019-2031
- 6.1. Market Analysis, Insights and Forecast - by Solution
- 6.1.1. Software
- 6.1.2. Services
- 6.2. Market Analysis, Insights and Forecast - by Deployment
- 6.2.1. On-Premise
- 6.2.2. Cloud
- 6.3. Market Analysis, Insights and Forecast - by Industry
- 6.3.1. Automotive
- 6.3.2. Engineering & Construction
- 6.3.3. Logistics & Transportation
- 6.3.4. Energy & Utilities
- 6.3.5. Telecommunication
- 6.3.6. Other Industries
- 6.1. Market Analysis, Insights and Forecast - by Solution
- 7. Europe Digital Map Market Analysis, Insights and Forecast, 2019-2031
- 7.1. Market Analysis, Insights and Forecast - by Solution
- 7.1.1. Software
- 7.1.2. Services
- 7.2. Market Analysis, Insights and Forecast - by Deployment
- 7.2.1. On-Premise
- 7.2.2. Cloud
- 7.3. Market Analysis, Insights and Forecast - by Industry
- 7.3.1. Automotive
- 7.3.2. Engineering & Construction
- 7.3.3. Logistics & Transportation
- 7.3.4. Energy & Utilities
- 7.3.5. Telecommunication
- 7.3.6. Other Industries
- 7.1. Market Analysis, Insights and Forecast - by Solution
- 8. Asia Pacific Digital Map Market Analysis, Insights and Forecast, 2019-2031
- 8.1. Market Analysis, Insights and Forecast - by Solution
- 8.1.1. Software
- 8.1.2. Services
- 8.2. Market Analysis, Insights and Forecast - by Deployment
- 8.2.1. On-Premise
- 8.2.2. Cloud
- 8.3. Market Analysis, Insights and Forecast - by Industry
- 8.3.1. Automotive
- 8.3.2. Engineering & Construction
- 8.3.3. Logistics & Transportation
- 8.3.4. Energy & Utilities
- 8.3.5. Telecommunication
- 8.3.6. Other Industries
- 8.1. Market Analysis, Insights and Forecast - by Solution
- 9. Rest of the World Digital Map Market Analysis, Insights and Forecast, 2019-2031
- 9.1. Market Analysis, Insights and Forecast - by Solution
- 9.1.1. Software
- 9.1.2. Services
- 9.2. Market Analysis, Insights and Forecast - by Deployment
- 9.2.1. On-Premise
- 9.2.2. Cloud
- 9.3. Market Analysis, Insights and Forecast - by Industry
- 9.3.1. Automotive
- 9.3.2. Engineering & Construction
- 9.3.3. Logistics & Transportation
- 9.3.4. Energy & Utilities
- 9.3.5. Telecommunication
- 9.3.6. Other Industries
- 9.1. Market Analysis, Insights and Forecast - by Solution
- 10. North America Digital Map Market Analysis, Insights and Forecast, 2019-2031
- 10.1. Market Analysis, Insights and Forecast - By Country/Sub-region
- 10.1.1 United States
- 10.1.2 Canada
- 10.1.3 Mexico
- 11. Europe Digital Map Market Analysis, Insights and Forecast, 2019-2031
- 11.1. Market Analysis, Insights and Forecast - By Country/Sub-region
- 11.1.1 Germany
- 11.1.2 United Kingdom
- 11.1.3 France
- 11.1.4 Spain
- 11.1.5 Italy
- 11.1.6 Spain
- 11.1.7 Belgium
- 11.1.8 Netherland
- 11.1.9 Nordics
- 11.1.10 Rest of Europe
- 12. Asia Pacific Digital Map Market Analysis, Insights and Forecast, 2019-2031
- 12.1. Market Analysis, Insights and Forecast - By Country/Sub-region
- 12.1.1 China
- 12.1.2 Japan
- 12.1.3 India
- 12.1.4 South Korea
- 12.1.5 Southeast Asia
- 12.1.6 Australia
- 12.1.7 Indonesia
- 12.1.8 Phillipes
- 12.1.9 Singapore
- 12.1.10 Thailandc
- 12.1.11 Rest of Asia Pacific
- 13. South America Digital Map Market Analysis, Insights and Forecast, 2019-2031
- 13.1. Market Analysis, Insights and Forecast - By Country/Sub-region
- 13.1.1 Brazil
- 13.1.2 Argentina
- 13.1.3 Peru
- 13.1.4 Chile
- 13.1.5 Colombia
- 13.1.6 Ecuador
- 13.1.7 Venezuela
- 13.1.8 Rest of South America
- 14. North America Digital Map Market Analysis, Insights and Forecast, 2019-2031
- 14.1. Market Analysis, Insights and Forecast - By Country/Sub-region
- 14.1.1 United States
- 14.1.2 Canada
- 14.1.3 Mexico
- 15. MEA Digital Map Market Analysis, Insights and Forecast, 2019-2031
- 15.1. Market Analysis, Insights and Forecast - By Country/Sub-region
- 15.1.1 United Arab Emirates
- 15.1.2 Saudi Arabia
- 15.1.3 South Africa
- 15.1.4 Rest of Middle East and Africa
- 16. Competitive Analysis
- 16.1. Global Market Share Analysis 2024
- 16.2. Company Profiles
- 16.2.1 Mapbox
- 16.2.1.1. Overview
- 16.2.1.2. Products
- 16.2.1.3. SWOT Analysis
- 16.2.1.4. Recent Developments
- 16.2.1.5. Financials (Based on Availability)
- 16.2.2 Lepton Software
- 16.2.2.1. Overview
- 16.2.2.2. Products
- 16.2.2.3. SWOT Analysis
- 16.2.2.4. Recent Developments
- 16.2.2.5. Financials (Based on Availability)
- 16.2.3 Digital Mapping Solutions
- 16.2.3.1. Overview
- 16.2.3.2. Products
- 16.2.3.3. SWOT Analysis
- 16.2.3.4. Recent Developments
- 16.2.3.5. Financials (Based on Availability)
- 16.2.4 Maxar Technologies (DigitalGlobe)
- 16.2.4.1. Overview
- 16.2.4.2. Products
- 16.2.4.3. SWOT Analysis
- 16.2.4.4. Recent Developments
- 16.2.4.5. Financials (Based on Availability)
- 16.2.5 Google LLC (Alphabet Inc )
- 16.2.5.1. Overview
- 16.2.5.2. Products
- 16.2.5.3. SWOT Analysis
- 16.2.5.4. Recent Developments
- 16.2.5.5. Financials (Based on Availability)
- 16.2.6 Collins Bartholomew Ltd
- 16.2.6.1. Overview
- 16.2.6.2. Products
- 16.2.6.3. SWOT Analysis
- 16.2.6.4. Recent Developments
- 16.2.6.5. Financials (Based on Availability)
- 16.2.7 DMTI Spatial
- 16.2.7.1. Overview
- 16.2.7.2. Products
- 16.2.7.3. SWOT Analysis
- 16.2.7.4. Recent Developments
- 16.2.7.5. Financials (Based on Availability)
- 16.2.8 Digital Map Products Inc
- 16.2.8.1. Overview
- 16.2.8.2. Products
- 16.2.8.3. SWOT Analysis
- 16.2.8.4. Recent Developments
- 16.2.8.5. Financials (Based on Availability)
- 16.2.9 ThinkGeo LLC
- 16.2.9.1. Overview
- 16.2.9.2. Products
- 16.2.9.3. SWOT Analysis
- 16.2.9.4. Recent Developments
- 16.2.9.5. Financials (Based on Availability)
- 16.2.10 MapData Services Pty Ltd
- 16.2.10.1. Overview
- 16.2.10.2. Products
- 16.2.10.3. SWOT Analysis
- 16.2.10.4. Recent Developments
- 16.2.10.5. Financials (Based on Availability)
- 16.2.11 ESRI Business Information Solutions Inc
- 16.2.11.1. Overview
- 16.2.11.2. Products
- 16.2.11.3. SWOT Analysis
- 16.2.11.4. Recent Developments
- 16.2.11.5. Financials (Based on Availability)
- 16.2.12 TomTom International B V *List Not Exhaustive
- 16.2.12.1. Overview
- 16.2.12.2. Products
- 16.2.12.3. SWOT Analysis
- 16.2.12.4. Recent Developments
- 16.2.12.5. Financials (Based on Availability)
- 16.2.13 HERE Technologies
- 16.2.13.1. Overview
- 16.2.13.2. Products
- 16.2.13.3. SWOT Analysis
- 16.2.13.4. Recent Developments
- 16.2.13.5. Financials (Based on Availability)
- 16.2.1 Mapbox
List of Figures
- Figure 1: Global Digital Map Market Revenue Breakdown (Million, %) by Region 2024 & 2032
- Figure 2: North America Digital Map Market Revenue (Million), by Country 2024 & 2032
- Figure 3: North America Digital Map Market Revenue Share (%), by Country 2024 & 2032
- Figure 4: Europe Digital Map Market Revenue (Million), by Country 2024 & 2032
- Figure 5: Europe Digital Map Market Revenue Share (%), by Country 2024 & 2032
- Figure 6: Asia Pacific Digital Map Market Revenue (Million), by Country 2024 & 2032
- Figure 7: Asia Pacific Digital Map Market Revenue Share (%), by Country 2024 & 2032
- Figure 8: South America Digital Map Market Revenue (Million), by Country 2024 & 2032
- Figure 9: South America Digital Map Market Revenue Share (%), by Country 2024 & 2032
- Figure 10: North America Digital Map Market Revenue (Million), by Country 2024 & 2032
- Figure 11: North America Digital Map Market Revenue Share (%), by Country 2024 & 2032
- Figure 12: MEA Digital Map Market Revenue (Million), by Country 2024 & 2032
- Figure 13: MEA Digital Map Market Revenue Share (%), by Country 2024 & 2032
- Figure 14: North America Digital Map Market Revenue (Million), by Solution 2024 & 2032
- Figure 15: North America Digital Map Market Revenue Share (%), by Solution 2024 & 2032
- Figure 16: North America Digital Map Market Revenue (Million), by Deployment 2024 & 2032
- Figure 17: North America Digital Map Market Revenue Share (%), by Deployment 2024 & 2032
- Figure 18: North America Digital Map Market Revenue (Million), by Industry 2024 & 2032
- Figure 19: North America Digital Map Market Revenue Share (%), by Industry 2024 & 2032
- Figure 20: North America Digital Map Market Revenue (Million), by Country 2024 & 2032
- Figure 21: North America Digital Map Market Revenue Share (%), by Country 2024 & 2032
- Figure 22: Europe Digital Map Market Revenue (Million), by Solution 2024 & 2032
- Figure 23: Europe Digital Map Market Revenue Share (%), by Solution 2024 & 2032
- Figure 24: Europe Digital Map Market Revenue (Million), by Deployment 2024 & 2032
- Figure 25: Europe Digital Map Market Revenue Share (%), by Deployment 2024 & 2032
- Figure 26: Europe Digital Map Market Revenue (Million), by Industry 2024 & 2032
- Figure 27: Europe Digital Map Market Revenue Share (%), by Industry 2024 & 2032
- Figure 28: Europe Digital Map Market Revenue (Million), by Country 2024 & 2032
- Figure 29: Europe Digital Map Market Revenue Share (%), by Country 2024 & 2032
- Figure 30: Asia Pacific Digital Map Market Revenue (Million), by Solution 2024 & 2032
- Figure 31: Asia Pacific Digital Map Market Revenue Share (%), by Solution 2024 & 2032
- Figure 32: Asia Pacific Digital Map Market Revenue (Million), by Deployment 2024 & 2032
- Figure 33: Asia Pacific Digital Map Market Revenue Share (%), by Deployment 2024 & 2032
- Figure 34: Asia Pacific Digital Map Market Revenue (Million), by Industry 2024 & 2032
- Figure 35: Asia Pacific Digital Map Market Revenue Share (%), by Industry 2024 & 2032
- Figure 36: Asia Pacific Digital Map Market Revenue (Million), by Country 2024 & 2032
- Figure 37: Asia Pacific Digital Map Market Revenue Share (%), by Country 2024 & 2032
- Figure 38: Rest of the World Digital Map Market Revenue (Million), by Solution 2024 & 2032
- Figure 39: Rest of the World Digital Map Market Revenue Share (%), by Solution 2024 & 2032
- Figure 40: Rest of the World Digital Map Market Revenue (Million), by Deployment 2024 & 2032
- Figure 41: Rest of the World Digital Map Market Revenue Share (%), by Deployment 2024 & 2032
- Figure 42: Rest of the World Digital Map Market Revenue (Million), by Industry 2024 & 2032
- Figure 43: Rest of the World Digital Map Market Revenue Share (%), by Industry 2024 & 2032
- Figure 44: Rest of the World Digital Map Market Revenue (Million), by Country 2024 & 2032
- Figure 45: Rest of the World Digital Map Market Revenue Share (%), by Country 2024 & 2032
List of Tables
- Table 1: Global Digital Map Market Revenue Million Forecast, by Region 2019 & 2032
- Table 2: Global Digital Map Market Revenue Million Forecast, by Solution 2019 & 2032
- Table 3: Global Digital Map Market Revenue Million Forecast, by Deployment 2019 & 2032
- Table 4: Global Digital Map Market Revenue Million Forecast, by Industry 2019 & 2032
- Table 5: Global Digital Map Market Revenue Million Forecast, by Region 2019 & 2032
- Table 6: Global Digital Map Market Revenue Million Forecast, by Country 2019 & 2032
- Table 7: United States Digital Map Market Revenue (Million) Forecast, by Application 2019 & 2032
- Table 8: Canada Digital Map Market Revenue (Million) Forecast, by Application 2019 & 2032
- Table 9: Mexico Digital Map Market Revenue (Million) Forecast, by Application 2019 & 2032
- Table 10: Global Digital Map Market Revenue Million Forecast, by Country 2019 & 2032
- Table 11: Germany Digital Map Market Revenue (Million) Forecast, by Application 2019 & 2032
- Table 12: United Kingdom Digital Map Market Revenue (Million) Forecast, by Application 2019 & 2032
- Table 13: France Digital Map Market Revenue (Million) Forecast, by Application 2019 & 2032
- Table 14: Spain Digital Map Market Revenue (Million) Forecast, by Application 2019 & 2032
- Table 15: Italy Digital Map Market Revenue (Million) Forecast, by Application 2019 & 2032
- Table 16: Spain Digital Map Market Revenue (Million) Forecast, by Application 2019 & 2032
- Table 17: Belgium Digital Map Market Revenue (Million) Forecast, by Application 2019 & 2032
- Table 18: Netherland Digital Map Market Revenue (Million) Forecast, by Application 2019 & 2032
- Table 19: Nordics Digital Map Market Revenue (Million) Forecast, by Application 2019 & 2032
- Table 20: Rest of Europe Digital Map Market Revenue (Million) Forecast, by Application 2019 & 2032
- Table 21: Global Digital Map Market Revenue Million Forecast, by Country 2019 & 2032
- Table 22: China Digital Map Market Revenue (Million) Forecast, by Application 2019 & 2032
- Table 23: Japan Digital Map Market Revenue (Million) Forecast, by Application 2019 & 2032
- Table 24: India Digital Map Market Revenue (Million) Forecast, by Application 2019 & 2032
- Table 25: South Korea Digital Map Market Revenue (Million) Forecast, by Application 2019 & 2032
- Table 26: Southeast Asia Digital Map Market Revenue (Million) Forecast, by Application 2019 & 2032
- Table 27: Australia Digital Map Market Revenue (Million) Forecast, by Application 2019 & 2032
- Table 28: Indonesia Digital Map Market Revenue (Million) Forecast, by Application 2019 & 2032
- Table 29: Phillipes Digital Map Market Revenue (Million) Forecast, by Application 2019 & 2032
- Table 30: Singapore Digital Map Market Revenue (Million) Forecast, by Application 2019 & 2032
- Table 31: Thailandc Digital Map Market Revenue (Million) Forecast, by Application 2019 & 2032
- Table 32: Rest of Asia Pacific Digital Map Market Revenue (Million) Forecast, by Application 2019 & 2032
- Table 33: Global Digital Map Market Revenue Million Forecast, by Country 2019 & 2032
- Table 34: Brazil Digital Map Market Revenue (Million) Forecast, by Application 2019 & 2032
- Table 35: Argentina Digital Map Market Revenue (Million) Forecast, by Application 2019 & 2032
- Table 36: Peru Digital Map Market Revenue (Million) Forecast, by Application 2019 & 2032
- Table 37: Chile Digital Map Market Revenue (Million) Forecast, by Application 2019 & 2032
- Table 38: Colombia Digital Map Market Revenue (Million) Forecast, by Application 2019 & 2032
- Table 39: Ecuador Digital Map Market Revenue (Million) Forecast, by Application 2019 & 2032
- Table 40: Venezuela Digital Map Market Revenue (Million) Forecast, by Application 2019 & 2032
- Table 41: Rest of South America Digital Map Market Revenue (Million) Forecast, by Application 2019 & 2032
- Table 42: Global Digital Map Market Revenue Million Forecast, by Country 2019 & 2032
- Table 43: United States Digital Map Market Revenue (Million) Forecast, by Application 2019 & 2032
- Table 44: Canada Digital Map Market Revenue (Million) Forecast, by Application 2019 & 2032
- Table 45: Mexico Digital Map Market Revenue (Million) Forecast, by Application 2019 & 2032
- Table 46: Global Digital Map Market Revenue Million Forecast, by Country 2019 & 2032
- Table 47: United Arab Emirates Digital Map Market Revenue (Million) Forecast, by Application 2019 & 2032
- Table 48: Saudi Arabia Digital Map Market Revenue (Million) Forecast, by Application 2019 & 2032
- Table 49: South Africa Digital Map Market Revenue (Million) Forecast, by Application 2019 & 2032
- Table 50: Rest of Middle East and Africa Digital Map Market Revenue (Million) Forecast, by Application 2019 & 2032
- Table 51: Global Digital Map Market Revenue Million Forecast, by Solution 2019 & 2032
- Table 52: Global Digital Map Market Revenue Million Forecast, by Deployment 2019 & 2032
- Table 53: Global Digital Map Market Revenue Million Forecast, by Industry 2019 & 2032
- Table 54: Global Digital Map Market Revenue Million Forecast, by Country 2019 & 2032
- Table 55: United States Digital Map Market Revenue (Million) Forecast, by Application 2019 & 2032
- Table 56: Canada Digital Map Market Revenue (Million) Forecast, by Application 2019 & 2032
- Table 57: Global Digital Map Market Revenue Million Forecast, by Solution 2019 & 2032
- Table 58: Global Digital Map Market Revenue Million Forecast, by Deployment 2019 & 2032
- Table 59: Global Digital Map Market Revenue Million Forecast, by Industry 2019 & 2032
- Table 60: Global Digital Map Market Revenue Million Forecast, by Country 2019 & 2032
- Table 61: United Kingdom Digital Map Market Revenue (Million) Forecast, by Application 2019 & 2032
- Table 62: Germany Digital Map Market Revenue (Million) Forecast, by Application 2019 & 2032
- Table 63: France Digital Map Market Revenue (Million) Forecast, by Application 2019 & 2032
- Table 64: Rest of Europe Digital Map Market Revenue (Million) Forecast, by Application 2019 & 2032
- Table 65: Global Digital Map Market Revenue Million Forecast, by Solution 2019 & 2032
- Table 66: Global Digital Map Market Revenue Million Forecast, by Deployment 2019 & 2032
- Table 67: Global Digital Map Market Revenue Million Forecast, by Industry 2019 & 2032
- Table 68: Global Digital Map Market Revenue Million Forecast, by Country 2019 & 2032
- Table 69: China Digital Map Market Revenue (Million) Forecast, by Application 2019 & 2032
- Table 70: Japan Digital Map Market Revenue (Million) Forecast, by Application 2019 & 2032
- Table 71: India Digital Map Market Revenue (Million) Forecast, by Application 2019 & 2032
- Table 72: Rest of Asia Pacific Digital Map Market Revenue (Million) Forecast, by Application 2019 & 2032
- Table 73: Global Digital Map Market Revenue Million Forecast, by Solution 2019 & 2032
- Table 74: Global Digital Map Market Revenue Million Forecast, by Deployment 2019 & 2032
- Table 75: Global Digital Map Market Revenue Million Forecast, by Industry 2019 & 2032
- Table 76: Global Digital Map Market Revenue Million Forecast, by Country 2019 & 2032
Frequently Asked Questions
1. What is the projected Compound Annual Growth Rate (CAGR) of the Digital Map Market?
The projected CAGR is approximately 13.39%.
2. Which companies are prominent players in the Digital Map Market?
Key companies in the market include Mapbox, Lepton Software, Digital Mapping Solutions, Maxar Technologies (DigitalGlobe), Google LLC (Alphabet Inc ), Collins Bartholomew Ltd, DMTI Spatial, Digital Map Products Inc, ThinkGeo LLC, MapData Services Pty Ltd, ESRI Business Information Solutions Inc, TomTom International B V *List Not Exhaustive, HERE Technologies.
3. What are the main segments of the Digital Map Market?
The market segments include Solution, Deployment, Industry.
4. Can you provide details about the market size?
The market size is estimated to be USD 25.55 Million as of 2022.
5. What are some drivers contributing to market growth?
Growth in Application for Advanced Navigation System in Automotive Industry; Surge in Demand for Geographic Information System (GIS); Increased Adoption of Connected Devices and Internet.
6. What are the notable trends driving market growth?
Surge in Demand for GIS and GNSS to Influence the Adoption of Digital Map Technology.
7. Are there any restraints impacting market growth?
Complexity in Integration of Traditional Maps with Modern GIS System.
8. Can you provide examples of recent developments in the market?
December 2022 - The Linux Foundation has partnered with some of the biggest technology companies in the world to build interoperable and open map data in what is an apparent move t. The Overture Maps Foundation, as the new effort is called, is officially hosted by the Linux Foundation. The ultimate aim of the Overture Maps Foundation is to power new map products through openly available datasets that can be used and reused across applications and businesses, with each member throwing their data and resources into the mix.
9. What pricing options are available for accessing the report?
Pricing options include single-user, multi-user, and enterprise licenses priced at USD 4750, USD 5250, and USD 8750 respectively.
10. Is the market size provided in terms of value or volume?
The market size is provided in terms of value, measured in Million.
11. Are there any specific market keywords associated with the report?
Yes, the market keyword associated with the report is "Digital Map Market," which aids in identifying and referencing the specific market segment covered.
12. How do I determine which pricing option suits my needs best?
The pricing options vary based on user requirements and access needs. Individual users may opt for single-user licenses, while businesses requiring broader access may choose multi-user or enterprise licenses for cost-effective access to the report.
13. Are there any additional resources or data provided in the Digital Map Market report?
While the report offers comprehensive insights, it's advisable to review the specific contents or supplementary materials provided to ascertain if additional resources or data are available.
14. How can I stay updated on further developments or reports in the Digital Map Market?
To stay informed about further developments, trends, and reports in the Digital Map Market, consider subscribing to industry newsletters, following relevant companies and organizations, or regularly checking reputable industry news sources and publications.
Methodology
Step 1 - Identification of Relevant Samples Size from Population Database


Step 2 - Approaches for Defining Global Market Size (Value, Volume* & Price*)

Note*: In applicable scenarios
Step 3 - Data Sources
Primary Research
- Web Analytics
- Survey Reports
- Research Institute
- Latest Research Reports
- Opinion Leaders
Secondary Research
- Annual Reports
- White Paper
- Latest Press Release
- Industry Association
- Paid Database
- Investor Presentations

Step 4 - Data Triangulation
Involves using different sources of information in order to increase the validity of a study
These sources are likely to be stakeholders in a program - participants, other researchers, program staff, other community members, and so on.
Then we put all data in single framework & apply various statistical tools to find out the dynamic on the market.
During the analysis stage, feedback from the stakeholder groups would be compared to determine areas of agreement as well as areas of divergence


