
Key Insights
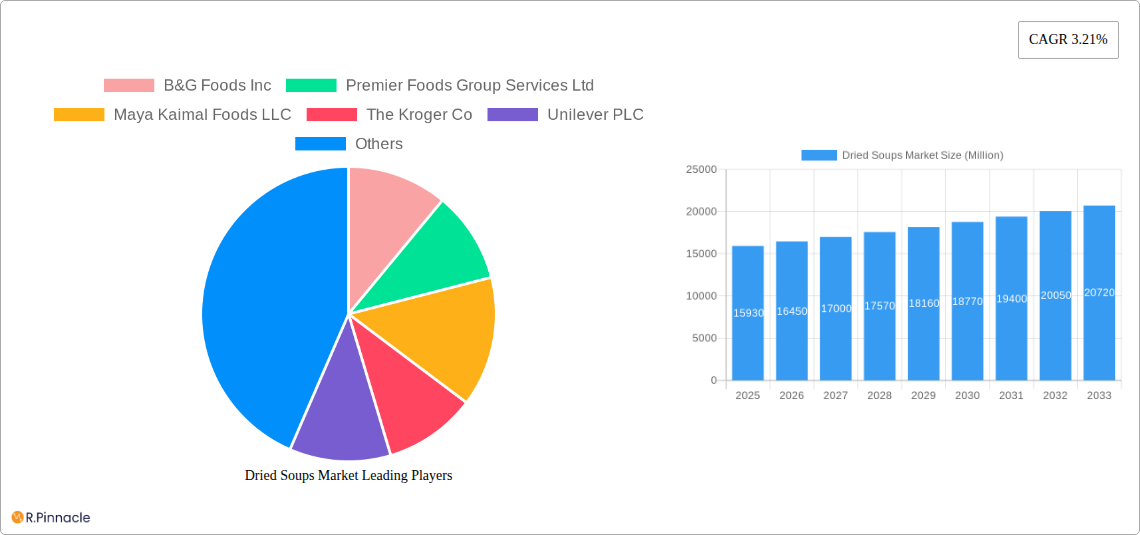
The global dried soups market, valued at $15.93 billion in 2025, is projected to experience steady growth, driven by several key factors. The increasing demand for convenient and ready-to-eat meals, particularly among busy professionals and young adults, fuels the market's expansion. Health-conscious consumers are also drawn to the lower sodium and calorie options available in many dried soup varieties, contributing to market growth. Furthermore, the rising popularity of online grocery shopping and the expansion of e-commerce platforms provide new avenues for distribution and increased accessibility. The market segmentation reveals a preference for instant soups, reflecting the prioritization of convenience. Packaging formats are diverse, with cups, pouches, and cans catering to different consumer needs and preferences. Supermarkets and hypermarkets remain dominant distribution channels, but online retail stores are gaining traction, showcasing the evolving consumer behavior and shopping habits. Competitive landscape analysis reveals the presence of both established multinational food corporations like Unilever and Nestlé, alongside smaller specialized players like Brodo Company and Harmony House Foods. This competition fosters innovation and a wider product range to cater to diverse consumer tastes and preferences.
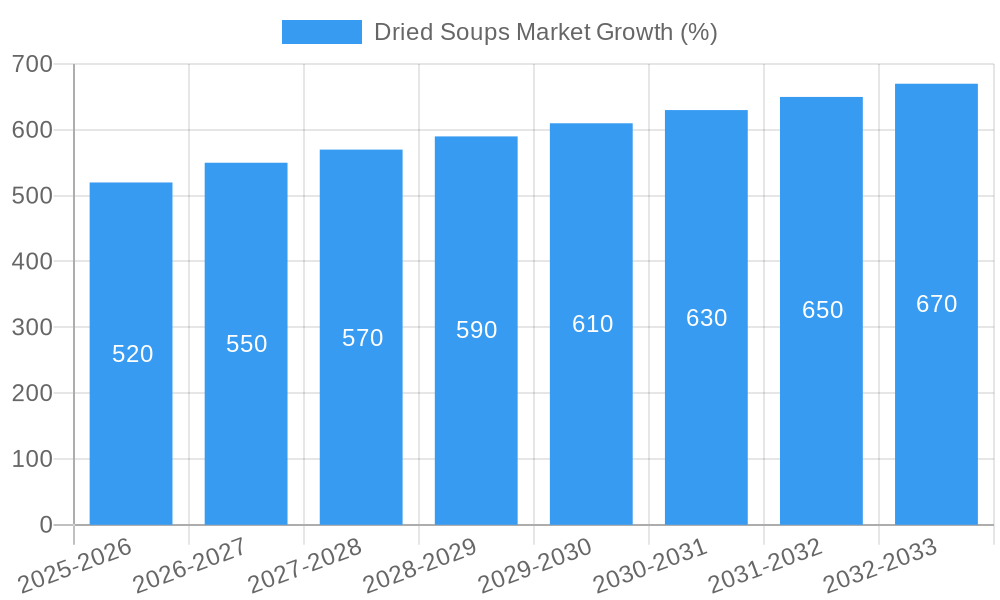
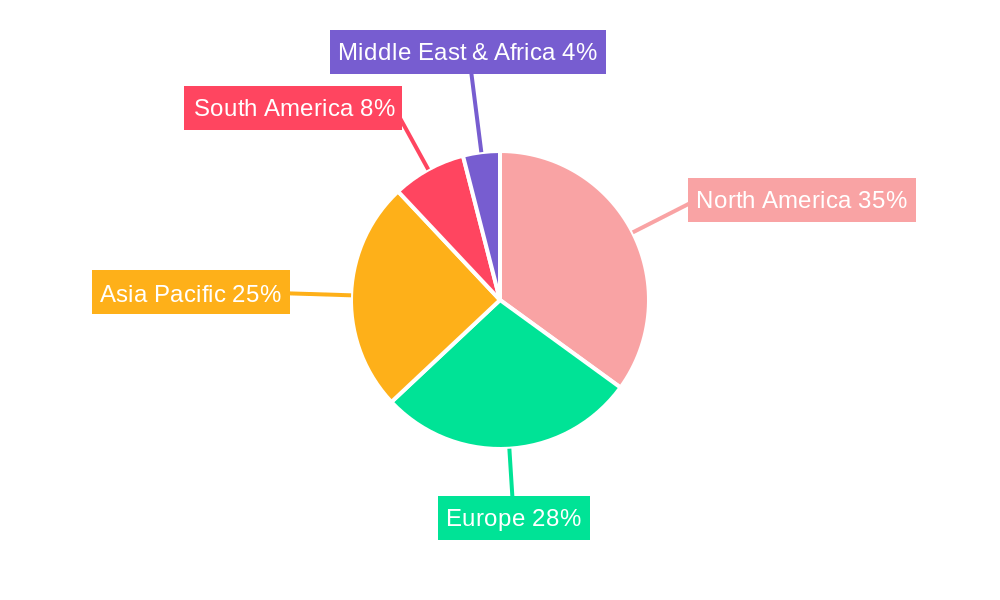
A projected CAGR of 3.21% indicates a consistent, albeit moderate, growth trajectory for the dried soups market between 2025 and 2033. While factors like fluctuating raw material prices and intense competition from other convenient meal options pose challenges, the overall market outlook remains positive. The diverse range of product types (instant, dehydrated), packaging options, and distribution channels ensures flexibility and adaptation to changing consumer demands. Regional differences in growth rates are anticipated, with regions like Asia Pacific potentially exhibiting faster growth due to increasing disposable incomes and changing dietary habits. Established players are focusing on product innovation, including organic and specialty varieties, to cater to health-conscious consumers, creating opportunities for further market expansion and segmentation.
Dried Soups Market: A Comprehensive Report (2019-2033)
This in-depth report provides a comprehensive analysis of the Dried Soups Market, offering valuable insights for industry professionals, investors, and stakeholders. With a study period spanning 2019-2033, a base year of 2025, and an estimated year of 2025, this report offers a detailed examination of market trends, dynamics, and future projections. The market is valued at xx Million in 2025 and is projected to reach xx Million by 2033, exhibiting a CAGR of xx% during the forecast period (2025-2033).
Dried Soups Market Structure & Innovation Trends
The Dried Soups Market exhibits a moderately concentrated structure, with key players like B&G Foods Inc, Premier Foods Group Services Ltd, Maya Kaimal Foods LLC, The Kroger Co, Unilever PLC, Hain Celestial Group Inc, Brodo Company, Harmony House Foods Inc, General Mills, Campbell Soup Co, Kraft Heinz Company, and Nestlé S.A holding significant market share. Market share data for individual companies is not publicly available and is estimated to be xx% for each of the leading players. The market is driven by innovation in product formulations (e.g., vegan options, organic ingredients), packaging (e.g., convenient single-serve cups, recyclable pouches), and distribution channels (e.g., expanding online presence). Regulatory frameworks concerning food safety and labeling influence product development and marketing strategies. Substitute products like canned soups and fresh soups pose competitive pressures. M&A activity in the market has been moderate, with deal values totaling approximately xx Million in the historical period (2019-2024).
Dried Soups Market Dynamics & Trends
The Dried Soups Market is witnessing substantial growth driven by several factors. The increasing demand for convenient and ready-to-eat meals fuels the popularity of dried soups, particularly among busy consumers and young professionals. Technological advancements in food processing and packaging enhance product shelf life and quality, driving market expansion. Changing consumer preferences towards healthier, organic, and ethically sourced foods create opportunities for premium dried soup options. The growing vegan and vegetarian population presents a significant opportunity for plant-based dried soup variants. Competitive dynamics are shaped by product differentiation, pricing strategies, and brand loyalty. The market penetration of dried soups in developing economies is on the rise with an estimated penetration rate of xx% in 2025. This demonstrates the significant market opportunity for expansion into new markets.
Dominant Regions & Segments in Dried Soups Market
The North American region currently dominates the Dried Soups Market, followed by Europe. Key factors driving regional dominance include high disposable incomes, established retail infrastructure, and strong consumer preference for convenient food options.
- Key Drivers for North America: Strong retail infrastructure, high disposable income, and preference for convenient food.
- Key Drivers for Europe: Growing demand for organic and healthy foods and established supermarket chains.
Segment Dominance:
- Type: Instant soups hold the largest market share due to their convenience. Dehydrated soups offer a longer shelf life, making them popular for storage.
- Packaging: Cup packaging dominates due to its convenience and single-serving size, followed by pouches. Canned soups maintain a niche presence.
- Distribution Channel: Supermarket/hypermarkets remain the primary distribution channel, owing to their wide reach and established consumer base. Online retail channels are rapidly expanding and represent significant growth opportunities.
Dried Soups Market Product Innovations
Recent innovations focus on expanding product variety and enhancing consumer appeal. The introduction of vegan and organic options aligns with growing health and dietary preferences. Technological advancements in packaging, such as sustainable and recyclable materials, address environmental concerns. The market is also seeing the rise of unique flavor profiles and gourmet options. This expansion and alignment with changing preferences allows companies to tap into larger markets and garner higher consumer loyalty.
Report Scope & Segmentation Analysis
This report segments the Dried Soups Market based on type (Instant, Dehydrated), packaging (Cup, Pouch, Canned), and distribution channel (Supermarket/Hypermarket, Convenience Stores, Grocery Stores, Online Retail Stores, Other). Each segment is analyzed for growth projections, market size, and competitive dynamics. Growth projections across all segments are projected to maintain a positive CAGR. Competitive dynamics vary by segment. For example, the online retail channel presents strong competition while the supermarket/hypermarket channel exhibits more established players.
Key Drivers of Dried Soups Market Growth
The Dried Soups Market is primarily driven by increasing demand for convenience foods, particularly among busy working professionals. The rising adoption of ready-to-eat meals and the growing popularity of healthy and organic food options are also key factors. Government initiatives promoting healthy eating habits further boost market growth. Technological advancements in food processing, along with innovations in packaging materials, further improve the quality and appeal of dried soups.
Challenges in the Dried Soups Market Sector
The Dried Soups Market faces challenges such as fluctuations in raw material prices and supply chain disruptions. Stringent food safety regulations and increasing consumer awareness of health and nutrition necessitate compliance with changing standards. Intense competition from established brands and the entry of new players contribute to market pressure. These factors create instability and require companies to adapt to changing markets.
Emerging Opportunities in Dried Soups Market
Growing demand for personalized nutrition and functional foods presents an opportunity to introduce specialized dried soups catering to specific dietary needs. Expansion into emerging markets with rising disposable incomes and a preference for convenient food options creates significant growth potential. The adoption of innovative packaging technologies, such as smart packaging, enhances product appeal and consumer experience, leading to potential sales growth.
Leading Players in the Dried Soups Market Market
- B&G Foods Inc
- Premier Foods Group Services Ltd
- Maya Kaimal Foods LLC
- The Kroger Co
- Unilever PLC
- Hain Celestial Group Inc
- Brodo Company
- Harmony House Foods Inc
- General Mills
- Campbell Soup Co
- Kraft Heinz Company
- Nestlé S.A
Key Developments in Dried Soups Market Industry
- November 2022: Heinz launched a fully vegan Christmas Dinner Big Soup, expanding into the growing vegan market and broadening distribution channels.
- August 2022: Yeo Valley launched organic soups in recyclable packaging, targeting the health-conscious consumer segment and using novel packaging.
- July 2022: Maya Kaimal Foods introduced vegan, Indian-inspired soups in single-use cartons, tapping into specific ethnic preferences and increasing distribution across new retail locations.
Future Outlook for Dried Soups Market Market
The Dried Soups Market is poised for continued growth, driven by increasing demand for convenient, healthy, and diverse food options. Strategic investments in research and development, expansion into new markets, and adoption of sustainable practices will be crucial for success. The focus on innovation and adaptation to consumer preferences will be essential for long-term market growth and increased profit margins.
Dried Soups Market Segmentation
-
1. Type
- 1.1. Instant
- 1.2. Dehydrated
-
2. Packaging
- 2.1. Cup
- 2.2. Pouch
- 2.3. Canned
-
3. Distribution Channel
- 3.1. Supermarket/Hypermarket
- 3.2. Convenience Stores
- 3.3. Grocery Stores
- 3.4. Online Retail Stores
- 3.5. Other Distribution Channels
Dried Soups Market Segmentation By Geography
-
1. North America
- 1.1. United States
- 1.2. Canada
- 1.3. Mexico
- 1.4. Rest of North America
-
2. Europe
- 2.1. United Kingdom
- 2.2. Germany
- 2.3. France
- 2.4. Russia
- 2.5. Italy
- 2.6. Spain
- 2.7. Rest of Europe
-
3. Asia Pacific
- 3.1. India
- 3.2. China
- 3.3. Japan
- 3.4. Australia
- 3.5. Rest of Asia Pacific
-
4. South America
- 4.1. Brazil
- 4.2. Argentina
- 4.3. Rest of South America
- 5. Middle East
-
6. South Africa
- 6.1. Saudi Arabia
- 6.2. Rest of MEA
Dried Soups Market REPORT HIGHLIGHTS
| Aspects | Details |
|---|---|
| Study Period | 2019-2033 |
| Base Year | 2024 |
| Estimated Year | 2025 |
| Forecast Period | 2025-2033 |
| Historical Period | 2019-2024 |
| Growth Rate | CAGR of 3.21% from 2019-2033 |
| Segmentation |
|
Table of Contents
- 1. Introduction
- 1.1. Research Scope
- 1.2. Market Segmentation
- 1.3. Research Methodology
- 1.4. Definitions and Assumptions
- 2. Executive Summary
- 2.1. Introduction
- 3. Market Dynamics
- 3.1. Introduction
- 3.2. Market Drivers
- 3.2.1. Prevalence of Lactose Intolerance Driving the Market; Growing Influence of Healthy Lifestyle Trends and Rising Non-Traditional Users
- 3.3. Market Restrains
- 3.3.1. Wide Availability of Alternative Protein Sources
- 3.4. Market Trends
- 3.4.1. Growing Demand for Ready to Eat Food health based foods
- 4. Market Factor Analysis
- 4.1. Porters Five Forces
- 4.2. Supply/Value Chain
- 4.3. PESTEL analysis
- 4.4. Market Entropy
- 4.5. Patent/Trademark Analysis
- 5. Global Dried Soups Market Analysis, Insights and Forecast, 2019-2031
- 5.1. Market Analysis, Insights and Forecast - by Type
- 5.1.1. Instant
- 5.1.2. Dehydrated
- 5.2. Market Analysis, Insights and Forecast - by Packaging
- 5.2.1. Cup
- 5.2.2. Pouch
- 5.2.3. Canned
- 5.3. Market Analysis, Insights and Forecast - by Distribution Channel
- 5.3.1. Supermarket/Hypermarket
- 5.3.2. Convenience Stores
- 5.3.3. Grocery Stores
- 5.3.4. Online Retail Stores
- 5.3.5. Other Distribution Channels
- 5.4. Market Analysis, Insights and Forecast - by Region
- 5.4.1. North America
- 5.4.2. Europe
- 5.4.3. Asia Pacific
- 5.4.4. South America
- 5.4.5. Middle East
- 5.4.6. South Africa
- 5.1. Market Analysis, Insights and Forecast - by Type
- 6. North America Dried Soups Market Analysis, Insights and Forecast, 2019-2031
- 6.1. Market Analysis, Insights and Forecast - by Type
- 6.1.1. Instant
- 6.1.2. Dehydrated
- 6.2. Market Analysis, Insights and Forecast - by Packaging
- 6.2.1. Cup
- 6.2.2. Pouch
- 6.2.3. Canned
- 6.3. Market Analysis, Insights and Forecast - by Distribution Channel
- 6.3.1. Supermarket/Hypermarket
- 6.3.2. Convenience Stores
- 6.3.3. Grocery Stores
- 6.3.4. Online Retail Stores
- 6.3.5. Other Distribution Channels
- 6.1. Market Analysis, Insights and Forecast - by Type
- 7. Europe Dried Soups Market Analysis, Insights and Forecast, 2019-2031
- 7.1. Market Analysis, Insights and Forecast - by Type
- 7.1.1. Instant
- 7.1.2. Dehydrated
- 7.2. Market Analysis, Insights and Forecast - by Packaging
- 7.2.1. Cup
- 7.2.2. Pouch
- 7.2.3. Canned
- 7.3. Market Analysis, Insights and Forecast - by Distribution Channel
- 7.3.1. Supermarket/Hypermarket
- 7.3.2. Convenience Stores
- 7.3.3. Grocery Stores
- 7.3.4. Online Retail Stores
- 7.3.5. Other Distribution Channels
- 7.1. Market Analysis, Insights and Forecast - by Type
- 8. Asia Pacific Dried Soups Market Analysis, Insights and Forecast, 2019-2031
- 8.1. Market Analysis, Insights and Forecast - by Type
- 8.1.1. Instant
- 8.1.2. Dehydrated
- 8.2. Market Analysis, Insights and Forecast - by Packaging
- 8.2.1. Cup
- 8.2.2. Pouch
- 8.2.3. Canned
- 8.3. Market Analysis, Insights and Forecast - by Distribution Channel
- 8.3.1. Supermarket/Hypermarket
- 8.3.2. Convenience Stores
- 8.3.3. Grocery Stores
- 8.3.4. Online Retail Stores
- 8.3.5. Other Distribution Channels
- 8.1. Market Analysis, Insights and Forecast - by Type
- 9. South America Dried Soups Market Analysis, Insights and Forecast, 2019-2031
- 9.1. Market Analysis, Insights and Forecast - by Type
- 9.1.1. Instant
- 9.1.2. Dehydrated
- 9.2. Market Analysis, Insights and Forecast - by Packaging
- 9.2.1. Cup
- 9.2.2. Pouch
- 9.2.3. Canned
- 9.3. Market Analysis, Insights and Forecast - by Distribution Channel
- 9.3.1. Supermarket/Hypermarket
- 9.3.2. Convenience Stores
- 9.3.3. Grocery Stores
- 9.3.4. Online Retail Stores
- 9.3.5. Other Distribution Channels
- 9.1. Market Analysis, Insights and Forecast - by Type
- 10. Middle East Dried Soups Market Analysis, Insights and Forecast, 2019-2031
- 10.1. Market Analysis, Insights and Forecast - by Type
- 10.1.1. Instant
- 10.1.2. Dehydrated
- 10.2. Market Analysis, Insights and Forecast - by Packaging
- 10.2.1. Cup
- 10.2.2. Pouch
- 10.2.3. Canned
- 10.3. Market Analysis, Insights and Forecast - by Distribution Channel
- 10.3.1. Supermarket/Hypermarket
- 10.3.2. Convenience Stores
- 10.3.3. Grocery Stores
- 10.3.4. Online Retail Stores
- 10.3.5. Other Distribution Channels
- 10.1. Market Analysis, Insights and Forecast - by Type
- 11. South Africa Dried Soups Market Analysis, Insights and Forecast, 2019-2031
- 11.1. Market Analysis, Insights and Forecast - by Type
- 11.1.1. Instant
- 11.1.2. Dehydrated
- 11.2. Market Analysis, Insights and Forecast - by Packaging
- 11.2.1. Cup
- 11.2.2. Pouch
- 11.2.3. Canned
- 11.3. Market Analysis, Insights and Forecast - by Distribution Channel
- 11.3.1. Supermarket/Hypermarket
- 11.3.2. Convenience Stores
- 11.3.3. Grocery Stores
- 11.3.4. Online Retail Stores
- 11.3.5. Other Distribution Channels
- 11.1. Market Analysis, Insights and Forecast - by Type
- 12. North America Dried Soups Market Analysis, Insights and Forecast, 2019-2031
- 12.1. Market Analysis, Insights and Forecast - By Country/Sub-region
- 12.1.1 United States
- 12.1.2 Canada
- 12.1.3 Mexico
- 12.1.4 Rest of North America
- 13. Europe Dried Soups Market Analysis, Insights and Forecast, 2019-2031
- 13.1. Market Analysis, Insights and Forecast - By Country/Sub-region
- 13.1.1 United Kingdom
- 13.1.2 Germany
- 13.1.3 France
- 13.1.4 Russia
- 13.1.5 Italy
- 13.1.6 Spain
- 13.1.7 Rest of Europe
- 14. Asia Pacific Dried Soups Market Analysis, Insights and Forecast, 2019-2031
- 14.1. Market Analysis, Insights and Forecast - By Country/Sub-region
- 14.1.1 India
- 14.1.2 China
- 14.1.3 Japan
- 14.1.4 Australia
- 14.1.5 Rest of Asia Pacific
- 15. South America Dried Soups Market Analysis, Insights and Forecast, 2019-2031
- 15.1. Market Analysis, Insights and Forecast - By Country/Sub-region
- 15.1.1 Brazil
- 15.1.2 Argentina
- 15.1.3 Rest of South America
- 16. Middle East & Africa Dried Soups Market Analysis, Insights and Forecast, 2019-2031
- 16.1. Market Analysis, Insights and Forecast - By Country/Sub-region
- 16.1.1 UAE
- 16.1.2 South Africa
- 16.1.3 Saudi Arabia
- 16.1.4 Rest of MEA
- 17. South Africa Dried Soups Market Analysis, Insights and Forecast, 2019-2031
- 17.1. Market Analysis, Insights and Forecast - By Country/Sub-region
- 17.1.1 Saudi Arabia
- 17.1.2 Rest of MEA
- 18. Competitive Analysis
- 18.1. Global Market Share Analysis 2024
- 18.2. Company Profiles
- 18.2.1 B&G Foods Inc
- 18.2.1.1. Overview
- 18.2.1.2. Products
- 18.2.1.3. SWOT Analysis
- 18.2.1.4. Recent Developments
- 18.2.1.5. Financials (Based on Availability)
- 18.2.2 Premier Foods Group Services Ltd
- 18.2.2.1. Overview
- 18.2.2.2. Products
- 18.2.2.3. SWOT Analysis
- 18.2.2.4. Recent Developments
- 18.2.2.5. Financials (Based on Availability)
- 18.2.3 Maya Kaimal Foods LLC
- 18.2.3.1. Overview
- 18.2.3.2. Products
- 18.2.3.3. SWOT Analysis
- 18.2.3.4. Recent Developments
- 18.2.3.5. Financials (Based on Availability)
- 18.2.4 The Kroger Co
- 18.2.4.1. Overview
- 18.2.4.2. Products
- 18.2.4.3. SWOT Analysis
- 18.2.4.4. Recent Developments
- 18.2.4.5. Financials (Based on Availability)
- 18.2.5 Unilever PLC
- 18.2.5.1. Overview
- 18.2.5.2. Products
- 18.2.5.3. SWOT Analysis
- 18.2.5.4. Recent Developments
- 18.2.5.5. Financials (Based on Availability)
- 18.2.6 Hain Celestial Group Inc
- 18.2.6.1. Overview
- 18.2.6.2. Products
- 18.2.6.3. SWOT Analysis
- 18.2.6.4. Recent Developments
- 18.2.6.5. Financials (Based on Availability)
- 18.2.7 Brodo Company
- 18.2.7.1. Overview
- 18.2.7.2. Products
- 18.2.7.3. SWOT Analysis
- 18.2.7.4. Recent Developments
- 18.2.7.5. Financials (Based on Availability)
- 18.2.8 Harmony House Foods Inc *List Not Exhaustive
- 18.2.8.1. Overview
- 18.2.8.2. Products
- 18.2.8.3. SWOT Analysis
- 18.2.8.4. Recent Developments
- 18.2.8.5. Financials (Based on Availability)
- 18.2.9 General Mills
- 18.2.9.1. Overview
- 18.2.9.2. Products
- 18.2.9.3. SWOT Analysis
- 18.2.9.4. Recent Developments
- 18.2.9.5. Financials (Based on Availability)
- 18.2.10 Campbell Soup Co
- 18.2.10.1. Overview
- 18.2.10.2. Products
- 18.2.10.3. SWOT Analysis
- 18.2.10.4. Recent Developments
- 18.2.10.5. Financials (Based on Availability)
- 18.2.11 Kraft Heinz Company
- 18.2.11.1. Overview
- 18.2.11.2. Products
- 18.2.11.3. SWOT Analysis
- 18.2.11.4. Recent Developments
- 18.2.11.5. Financials (Based on Availability)
- 18.2.12 Nestlé S A
- 18.2.12.1. Overview
- 18.2.12.2. Products
- 18.2.12.3. SWOT Analysis
- 18.2.12.4. Recent Developments
- 18.2.12.5. Financials (Based on Availability)
- 18.2.1 B&G Foods Inc
List of Figures
- Figure 1: Global Dried Soups Market Revenue Breakdown (Million, %) by Region 2024 & 2032
- Figure 2: Global Dried Soups Market Volume Breakdown (Liters, %) by Region 2024 & 2032
- Figure 3: North America Dried Soups Market Revenue (Million), by Country 2024 & 2032
- Figure 4: North America Dried Soups Market Volume (Liters), by Country 2024 & 2032
- Figure 5: North America Dried Soups Market Revenue Share (%), by Country 2024 & 2032
- Figure 6: North America Dried Soups Market Volume Share (%), by Country 2024 & 2032
- Figure 7: Europe Dried Soups Market Revenue (Million), by Country 2024 & 2032
- Figure 8: Europe Dried Soups Market Volume (Liters), by Country 2024 & 2032
- Figure 9: Europe Dried Soups Market Revenue Share (%), by Country 2024 & 2032
- Figure 10: Europe Dried Soups Market Volume Share (%), by Country 2024 & 2032
- Figure 11: Asia Pacific Dried Soups Market Revenue (Million), by Country 2024 & 2032
- Figure 12: Asia Pacific Dried Soups Market Volume (Liters), by Country 2024 & 2032
- Figure 13: Asia Pacific Dried Soups Market Revenue Share (%), by Country 2024 & 2032
- Figure 14: Asia Pacific Dried Soups Market Volume Share (%), by Country 2024 & 2032
- Figure 15: South America Dried Soups Market Revenue (Million), by Country 2024 & 2032
- Figure 16: South America Dried Soups Market Volume (Liters), by Country 2024 & 2032
- Figure 17: South America Dried Soups Market Revenue Share (%), by Country 2024 & 2032
- Figure 18: South America Dried Soups Market Volume Share (%), by Country 2024 & 2032
- Figure 19: Middle East & Africa Dried Soups Market Revenue (Million), by Country 2024 & 2032
- Figure 20: Middle East & Africa Dried Soups Market Volume (Liters), by Country 2024 & 2032
- Figure 21: Middle East & Africa Dried Soups Market Revenue Share (%), by Country 2024 & 2032
- Figure 22: Middle East & Africa Dried Soups Market Volume Share (%), by Country 2024 & 2032
- Figure 23: South Africa Dried Soups Market Revenue (Million), by Country 2024 & 2032
- Figure 24: South Africa Dried Soups Market Volume (Liters), by Country 2024 & 2032
- Figure 25: South Africa Dried Soups Market Revenue Share (%), by Country 2024 & 2032
- Figure 26: South Africa Dried Soups Market Volume Share (%), by Country 2024 & 2032
- Figure 27: North America Dried Soups Market Revenue (Million), by Type 2024 & 2032
- Figure 28: North America Dried Soups Market Volume (Liters), by Type 2024 & 2032
- Figure 29: North America Dried Soups Market Revenue Share (%), by Type 2024 & 2032
- Figure 30: North America Dried Soups Market Volume Share (%), by Type 2024 & 2032
- Figure 31: North America Dried Soups Market Revenue (Million), by Packaging 2024 & 2032
- Figure 32: North America Dried Soups Market Volume (Liters), by Packaging 2024 & 2032
- Figure 33: North America Dried Soups Market Revenue Share (%), by Packaging 2024 & 2032
- Figure 34: North America Dried Soups Market Volume Share (%), by Packaging 2024 & 2032
- Figure 35: North America Dried Soups Market Revenue (Million), by Distribution Channel 2024 & 2032
- Figure 36: North America Dried Soups Market Volume (Liters), by Distribution Channel 2024 & 2032
- Figure 37: North America Dried Soups Market Revenue Share (%), by Distribution Channel 2024 & 2032
- Figure 38: North America Dried Soups Market Volume Share (%), by Distribution Channel 2024 & 2032
- Figure 39: North America Dried Soups Market Revenue (Million), by Country 2024 & 2032
- Figure 40: North America Dried Soups Market Volume (Liters), by Country 2024 & 2032
- Figure 41: North America Dried Soups Market Revenue Share (%), by Country 2024 & 2032
- Figure 42: North America Dried Soups Market Volume Share (%), by Country 2024 & 2032
- Figure 43: Europe Dried Soups Market Revenue (Million), by Type 2024 & 2032
- Figure 44: Europe Dried Soups Market Volume (Liters), by Type 2024 & 2032
- Figure 45: Europe Dried Soups Market Revenue Share (%), by Type 2024 & 2032
- Figure 46: Europe Dried Soups Market Volume Share (%), by Type 2024 & 2032
- Figure 47: Europe Dried Soups Market Revenue (Million), by Packaging 2024 & 2032
- Figure 48: Europe Dried Soups Market Volume (Liters), by Packaging 2024 & 2032
- Figure 49: Europe Dried Soups Market Revenue Share (%), by Packaging 2024 & 2032
- Figure 50: Europe Dried Soups Market Volume Share (%), by Packaging 2024 & 2032
- Figure 51: Europe Dried Soups Market Revenue (Million), by Distribution Channel 2024 & 2032
- Figure 52: Europe Dried Soups Market Volume (Liters), by Distribution Channel 2024 & 2032
- Figure 53: Europe Dried Soups Market Revenue Share (%), by Distribution Channel 2024 & 2032
- Figure 54: Europe Dried Soups Market Volume Share (%), by Distribution Channel 2024 & 2032
- Figure 55: Europe Dried Soups Market Revenue (Million), by Country 2024 & 2032
- Figure 56: Europe Dried Soups Market Volume (Liters), by Country 2024 & 2032
- Figure 57: Europe Dried Soups Market Revenue Share (%), by Country 2024 & 2032
- Figure 58: Europe Dried Soups Market Volume Share (%), by Country 2024 & 2032
- Figure 59: Asia Pacific Dried Soups Market Revenue (Million), by Type 2024 & 2032
- Figure 60: Asia Pacific Dried Soups Market Volume (Liters), by Type 2024 & 2032
- Figure 61: Asia Pacific Dried Soups Market Revenue Share (%), by Type 2024 & 2032
- Figure 62: Asia Pacific Dried Soups Market Volume Share (%), by Type 2024 & 2032
- Figure 63: Asia Pacific Dried Soups Market Revenue (Million), by Packaging 2024 & 2032
- Figure 64: Asia Pacific Dried Soups Market Volume (Liters), by Packaging 2024 & 2032
- Figure 65: Asia Pacific Dried Soups Market Revenue Share (%), by Packaging 2024 & 2032
- Figure 66: Asia Pacific Dried Soups Market Volume Share (%), by Packaging 2024 & 2032
- Figure 67: Asia Pacific Dried Soups Market Revenue (Million), by Distribution Channel 2024 & 2032
- Figure 68: Asia Pacific Dried Soups Market Volume (Liters), by Distribution Channel 2024 & 2032
- Figure 69: Asia Pacific Dried Soups Market Revenue Share (%), by Distribution Channel 2024 & 2032
- Figure 70: Asia Pacific Dried Soups Market Volume Share (%), by Distribution Channel 2024 & 2032
- Figure 71: Asia Pacific Dried Soups Market Revenue (Million), by Country 2024 & 2032
- Figure 72: Asia Pacific Dried Soups Market Volume (Liters), by Country 2024 & 2032
- Figure 73: Asia Pacific Dried Soups Market Revenue Share (%), by Country 2024 & 2032
- Figure 74: Asia Pacific Dried Soups Market Volume Share (%), by Country 2024 & 2032
- Figure 75: South America Dried Soups Market Revenue (Million), by Type 2024 & 2032
- Figure 76: South America Dried Soups Market Volume (Liters), by Type 2024 & 2032
- Figure 77: South America Dried Soups Market Revenue Share (%), by Type 2024 & 2032
- Figure 78: South America Dried Soups Market Volume Share (%), by Type 2024 & 2032
- Figure 79: South America Dried Soups Market Revenue (Million), by Packaging 2024 & 2032
- Figure 80: South America Dried Soups Market Volume (Liters), by Packaging 2024 & 2032
- Figure 81: South America Dried Soups Market Revenue Share (%), by Packaging 2024 & 2032
- Figure 82: South America Dried Soups Market Volume Share (%), by Packaging 2024 & 2032
- Figure 83: South America Dried Soups Market Revenue (Million), by Distribution Channel 2024 & 2032
- Figure 84: South America Dried Soups Market Volume (Liters), by Distribution Channel 2024 & 2032
- Figure 85: South America Dried Soups Market Revenue Share (%), by Distribution Channel 2024 & 2032
- Figure 86: South America Dried Soups Market Volume Share (%), by Distribution Channel 2024 & 2032
- Figure 87: South America Dried Soups Market Revenue (Million), by Country 2024 & 2032
- Figure 88: South America Dried Soups Market Volume (Liters), by Country 2024 & 2032
- Figure 89: South America Dried Soups Market Revenue Share (%), by Country 2024 & 2032
- Figure 90: South America Dried Soups Market Volume Share (%), by Country 2024 & 2032
- Figure 91: Middle East Dried Soups Market Revenue (Million), by Type 2024 & 2032
- Figure 92: Middle East Dried Soups Market Volume (Liters), by Type 2024 & 2032
- Figure 93: Middle East Dried Soups Market Revenue Share (%), by Type 2024 & 2032
- Figure 94: Middle East Dried Soups Market Volume Share (%), by Type 2024 & 2032
- Figure 95: Middle East Dried Soups Market Revenue (Million), by Packaging 2024 & 2032
- Figure 96: Middle East Dried Soups Market Volume (Liters), by Packaging 2024 & 2032
- Figure 97: Middle East Dried Soups Market Revenue Share (%), by Packaging 2024 & 2032
- Figure 98: Middle East Dried Soups Market Volume Share (%), by Packaging 2024 & 2032
- Figure 99: Middle East Dried Soups Market Revenue (Million), by Distribution Channel 2024 & 2032
- Figure 100: Middle East Dried Soups Market Volume (Liters), by Distribution Channel 2024 & 2032
- Figure 101: Middle East Dried Soups Market Revenue Share (%), by Distribution Channel 2024 & 2032
- Figure 102: Middle East Dried Soups Market Volume Share (%), by Distribution Channel 2024 & 2032
- Figure 103: Middle East Dried Soups Market Revenue (Million), by Country 2024 & 2032
- Figure 104: Middle East Dried Soups Market Volume (Liters), by Country 2024 & 2032
- Figure 105: Middle East Dried Soups Market Revenue Share (%), by Country 2024 & 2032
- Figure 106: Middle East Dried Soups Market Volume Share (%), by Country 2024 & 2032
- Figure 107: South Africa Dried Soups Market Revenue (Million), by Type 2024 & 2032
- Figure 108: South Africa Dried Soups Market Volume (Liters), by Type 2024 & 2032
- Figure 109: South Africa Dried Soups Market Revenue Share (%), by Type 2024 & 2032
- Figure 110: South Africa Dried Soups Market Volume Share (%), by Type 2024 & 2032
- Figure 111: South Africa Dried Soups Market Revenue (Million), by Packaging 2024 & 2032
- Figure 112: South Africa Dried Soups Market Volume (Liters), by Packaging 2024 & 2032
- Figure 113: South Africa Dried Soups Market Revenue Share (%), by Packaging 2024 & 2032
- Figure 114: South Africa Dried Soups Market Volume Share (%), by Packaging 2024 & 2032
- Figure 115: South Africa Dried Soups Market Revenue (Million), by Distribution Channel 2024 & 2032
- Figure 116: South Africa Dried Soups Market Volume (Liters), by Distribution Channel 2024 & 2032
- Figure 117: South Africa Dried Soups Market Revenue Share (%), by Distribution Channel 2024 & 2032
- Figure 118: South Africa Dried Soups Market Volume Share (%), by Distribution Channel 2024 & 2032
- Figure 119: South Africa Dried Soups Market Revenue (Million), by Country 2024 & 2032
- Figure 120: South Africa Dried Soups Market Volume (Liters), by Country 2024 & 2032
- Figure 121: South Africa Dried Soups Market Revenue Share (%), by Country 2024 & 2032
- Figure 122: South Africa Dried Soups Market Volume Share (%), by Country 2024 & 2032
List of Tables
- Table 1: Global Dried Soups Market Revenue Million Forecast, by Region 2019 & 2032
- Table 2: Global Dried Soups Market Volume Liters Forecast, by Region 2019 & 2032
- Table 3: Global Dried Soups Market Revenue Million Forecast, by Type 2019 & 2032
- Table 4: Global Dried Soups Market Volume Liters Forecast, by Type 2019 & 2032
- Table 5: Global Dried Soups Market Revenue Million Forecast, by Packaging 2019 & 2032
- Table 6: Global Dried Soups Market Volume Liters Forecast, by Packaging 2019 & 2032
- Table 7: Global Dried Soups Market Revenue Million Forecast, by Distribution Channel 2019 & 2032
- Table 8: Global Dried Soups Market Volume Liters Forecast, by Distribution Channel 2019 & 2032
- Table 9: Global Dried Soups Market Revenue Million Forecast, by Region 2019 & 2032
- Table 10: Global Dried Soups Market Volume Liters Forecast, by Region 2019 & 2032
- Table 11: Global Dried Soups Market Revenue Million Forecast, by Country 2019 & 2032
- Table 12: Global Dried Soups Market Volume Liters Forecast, by Country 2019 & 2032
- Table 13: United States Dried Soups Market Revenue (Million) Forecast, by Application 2019 & 2032
- Table 14: United States Dried Soups Market Volume (Liters) Forecast, by Application 2019 & 2032
- Table 15: Canada Dried Soups Market Revenue (Million) Forecast, by Application 2019 & 2032
- Table 16: Canada Dried Soups Market Volume (Liters) Forecast, by Application 2019 & 2032
- Table 17: Mexico Dried Soups Market Revenue (Million) Forecast, by Application 2019 & 2032
- Table 18: Mexico Dried Soups Market Volume (Liters) Forecast, by Application 2019 & 2032
- Table 19: Rest of North America Dried Soups Market Revenue (Million) Forecast, by Application 2019 & 2032
- Table 20: Rest of North America Dried Soups Market Volume (Liters) Forecast, by Application 2019 & 2032
- Table 21: Global Dried Soups Market Revenue Million Forecast, by Country 2019 & 2032
- Table 22: Global Dried Soups Market Volume Liters Forecast, by Country 2019 & 2032
- Table 23: United Kingdom Dried Soups Market Revenue (Million) Forecast, by Application 2019 & 2032
- Table 24: United Kingdom Dried Soups Market Volume (Liters) Forecast, by Application 2019 & 2032
- Table 25: Germany Dried Soups Market Revenue (Million) Forecast, by Application 2019 & 2032
- Table 26: Germany Dried Soups Market Volume (Liters) Forecast, by Application 2019 & 2032
- Table 27: France Dried Soups Market Revenue (Million) Forecast, by Application 2019 & 2032
- Table 28: France Dried Soups Market Volume (Liters) Forecast, by Application 2019 & 2032
- Table 29: Russia Dried Soups Market Revenue (Million) Forecast, by Application 2019 & 2032
- Table 30: Russia Dried Soups Market Volume (Liters) Forecast, by Application 2019 & 2032
- Table 31: Italy Dried Soups Market Revenue (Million) Forecast, by Application 2019 & 2032
- Table 32: Italy Dried Soups Market Volume (Liters) Forecast, by Application 2019 & 2032
- Table 33: Spain Dried Soups Market Revenue (Million) Forecast, by Application 2019 & 2032
- Table 34: Spain Dried Soups Market Volume (Liters) Forecast, by Application 2019 & 2032
- Table 35: Rest of Europe Dried Soups Market Revenue (Million) Forecast, by Application 2019 & 2032
- Table 36: Rest of Europe Dried Soups Market Volume (Liters) Forecast, by Application 2019 & 2032
- Table 37: Global Dried Soups Market Revenue Million Forecast, by Country 2019 & 2032
- Table 38: Global Dried Soups Market Volume Liters Forecast, by Country 2019 & 2032
- Table 39: India Dried Soups Market Revenue (Million) Forecast, by Application 2019 & 2032
- Table 40: India Dried Soups Market Volume (Liters) Forecast, by Application 2019 & 2032
- Table 41: China Dried Soups Market Revenue (Million) Forecast, by Application 2019 & 2032
- Table 42: China Dried Soups Market Volume (Liters) Forecast, by Application 2019 & 2032
- Table 43: Japan Dried Soups Market Revenue (Million) Forecast, by Application 2019 & 2032
- Table 44: Japan Dried Soups Market Volume (Liters) Forecast, by Application 2019 & 2032
- Table 45: Australia Dried Soups Market Revenue (Million) Forecast, by Application 2019 & 2032
- Table 46: Australia Dried Soups Market Volume (Liters) Forecast, by Application 2019 & 2032
- Table 47: Rest of Asia Pacific Dried Soups Market Revenue (Million) Forecast, by Application 2019 & 2032
- Table 48: Rest of Asia Pacific Dried Soups Market Volume (Liters) Forecast, by Application 2019 & 2032
- Table 49: Global Dried Soups Market Revenue Million Forecast, by Country 2019 & 2032
- Table 50: Global Dried Soups Market Volume Liters Forecast, by Country 2019 & 2032
- Table 51: Brazil Dried Soups Market Revenue (Million) Forecast, by Application 2019 & 2032
- Table 52: Brazil Dried Soups Market Volume (Liters) Forecast, by Application 2019 & 2032
- Table 53: Argentina Dried Soups Market Revenue (Million) Forecast, by Application 2019 & 2032
- Table 54: Argentina Dried Soups Market Volume (Liters) Forecast, by Application 2019 & 2032
- Table 55: Rest of South America Dried Soups Market Revenue (Million) Forecast, by Application 2019 & 2032
- Table 56: Rest of South America Dried Soups Market Volume (Liters) Forecast, by Application 2019 & 2032
- Table 57: Global Dried Soups Market Revenue Million Forecast, by Country 2019 & 2032
- Table 58: Global Dried Soups Market Volume Liters Forecast, by Country 2019 & 2032
- Table 59: UAE Dried Soups Market Revenue (Million) Forecast, by Application 2019 & 2032
- Table 60: UAE Dried Soups Market Volume (Liters) Forecast, by Application 2019 & 2032
- Table 61: South Africa Dried Soups Market Revenue (Million) Forecast, by Application 2019 & 2032
- Table 62: South Africa Dried Soups Market Volume (Liters) Forecast, by Application 2019 & 2032
- Table 63: Saudi Arabia Dried Soups Market Revenue (Million) Forecast, by Application 2019 & 2032
- Table 64: Saudi Arabia Dried Soups Market Volume (Liters) Forecast, by Application 2019 & 2032
- Table 65: Rest of MEA Dried Soups Market Revenue (Million) Forecast, by Application 2019 & 2032
- Table 66: Rest of MEA Dried Soups Market Volume (Liters) Forecast, by Application 2019 & 2032
- Table 67: Global Dried Soups Market Revenue Million Forecast, by Country 2019 & 2032
- Table 68: Global Dried Soups Market Volume Liters Forecast, by Country 2019 & 2032
- Table 69: Saudi Arabia Dried Soups Market Revenue (Million) Forecast, by Application 2019 & 2032
- Table 70: Saudi Arabia Dried Soups Market Volume (Liters) Forecast, by Application 2019 & 2032
- Table 71: Rest of MEA Dried Soups Market Revenue (Million) Forecast, by Application 2019 & 2032
- Table 72: Rest of MEA Dried Soups Market Volume (Liters) Forecast, by Application 2019 & 2032
- Table 73: Global Dried Soups Market Revenue Million Forecast, by Type 2019 & 2032
- Table 74: Global Dried Soups Market Volume Liters Forecast, by Type 2019 & 2032
- Table 75: Global Dried Soups Market Revenue Million Forecast, by Packaging 2019 & 2032
- Table 76: Global Dried Soups Market Volume Liters Forecast, by Packaging 2019 & 2032
- Table 77: Global Dried Soups Market Revenue Million Forecast, by Distribution Channel 2019 & 2032
- Table 78: Global Dried Soups Market Volume Liters Forecast, by Distribution Channel 2019 & 2032
- Table 79: Global Dried Soups Market Revenue Million Forecast, by Country 2019 & 2032
- Table 80: Global Dried Soups Market Volume Liters Forecast, by Country 2019 & 2032
- Table 81: United States Dried Soups Market Revenue (Million) Forecast, by Application 2019 & 2032
- Table 82: United States Dried Soups Market Volume (Liters) Forecast, by Application 2019 & 2032
- Table 83: Canada Dried Soups Market Revenue (Million) Forecast, by Application 2019 & 2032
- Table 84: Canada Dried Soups Market Volume (Liters) Forecast, by Application 2019 & 2032
- Table 85: Mexico Dried Soups Market Revenue (Million) Forecast, by Application 2019 & 2032
- Table 86: Mexico Dried Soups Market Volume (Liters) Forecast, by Application 2019 & 2032
- Table 87: Rest of North America Dried Soups Market Revenue (Million) Forecast, by Application 2019 & 2032
- Table 88: Rest of North America Dried Soups Market Volume (Liters) Forecast, by Application 2019 & 2032
- Table 89: Global Dried Soups Market Revenue Million Forecast, by Type 2019 & 2032
- Table 90: Global Dried Soups Market Volume Liters Forecast, by Type 2019 & 2032
- Table 91: Global Dried Soups Market Revenue Million Forecast, by Packaging 2019 & 2032
- Table 92: Global Dried Soups Market Volume Liters Forecast, by Packaging 2019 & 2032
- Table 93: Global Dried Soups Market Revenue Million Forecast, by Distribution Channel 2019 & 2032
- Table 94: Global Dried Soups Market Volume Liters Forecast, by Distribution Channel 2019 & 2032
- Table 95: Global Dried Soups Market Revenue Million Forecast, by Country 2019 & 2032
- Table 96: Global Dried Soups Market Volume Liters Forecast, by Country 2019 & 2032
- Table 97: United Kingdom Dried Soups Market Revenue (Million) Forecast, by Application 2019 & 2032
- Table 98: United Kingdom Dried Soups Market Volume (Liters) Forecast, by Application 2019 & 2032
- Table 99: Germany Dried Soups Market Revenue (Million) Forecast, by Application 2019 & 2032
- Table 100: Germany Dried Soups Market Volume (Liters) Forecast, by Application 2019 & 2032
- Table 101: France Dried Soups Market Revenue (Million) Forecast, by Application 2019 & 2032
- Table 102: France Dried Soups Market Volume (Liters) Forecast, by Application 2019 & 2032
- Table 103: Russia Dried Soups Market Revenue (Million) Forecast, by Application 2019 & 2032
- Table 104: Russia Dried Soups Market Volume (Liters) Forecast, by Application 2019 & 2032
- Table 105: Italy Dried Soups Market Revenue (Million) Forecast, by Application 2019 & 2032
- Table 106: Italy Dried Soups Market Volume (Liters) Forecast, by Application 2019 & 2032
- Table 107: Spain Dried Soups Market Revenue (Million) Forecast, by Application 2019 & 2032
- Table 108: Spain Dried Soups Market Volume (Liters) Forecast, by Application 2019 & 2032
- Table 109: Rest of Europe Dried Soups Market Revenue (Million) Forecast, by Application 2019 & 2032
- Table 110: Rest of Europe Dried Soups Market Volume (Liters) Forecast, by Application 2019 & 2032
- Table 111: Global Dried Soups Market Revenue Million Forecast, by Type 2019 & 2032
- Table 112: Global Dried Soups Market Volume Liters Forecast, by Type 2019 & 2032
- Table 113: Global Dried Soups Market Revenue Million Forecast, by Packaging 2019 & 2032
- Table 114: Global Dried Soups Market Volume Liters Forecast, by Packaging 2019 & 2032
- Table 115: Global Dried Soups Market Revenue Million Forecast, by Distribution Channel 2019 & 2032
- Table 116: Global Dried Soups Market Volume Liters Forecast, by Distribution Channel 2019 & 2032
- Table 117: Global Dried Soups Market Revenue Million Forecast, by Country 2019 & 2032
- Table 118: Global Dried Soups Market Volume Liters Forecast, by Country 2019 & 2032
- Table 119: India Dried Soups Market Revenue (Million) Forecast, by Application 2019 & 2032
- Table 120: India Dried Soups Market Volume (Liters) Forecast, by Application 2019 & 2032
- Table 121: China Dried Soups Market Revenue (Million) Forecast, by Application 2019 & 2032
- Table 122: China Dried Soups Market Volume (Liters) Forecast, by Application 2019 & 2032
- Table 123: Japan Dried Soups Market Revenue (Million) Forecast, by Application 2019 & 2032
- Table 124: Japan Dried Soups Market Volume (Liters) Forecast, by Application 2019 & 2032
- Table 125: Australia Dried Soups Market Revenue (Million) Forecast, by Application 2019 & 2032
- Table 126: Australia Dried Soups Market Volume (Liters) Forecast, by Application 2019 & 2032
- Table 127: Rest of Asia Pacific Dried Soups Market Revenue (Million) Forecast, by Application 2019 & 2032
- Table 128: Rest of Asia Pacific Dried Soups Market Volume (Liters) Forecast, by Application 2019 & 2032
- Table 129: Global Dried Soups Market Revenue Million Forecast, by Type 2019 & 2032
- Table 130: Global Dried Soups Market Volume Liters Forecast, by Type 2019 & 2032
- Table 131: Global Dried Soups Market Revenue Million Forecast, by Packaging 2019 & 2032
- Table 132: Global Dried Soups Market Volume Liters Forecast, by Packaging 2019 & 2032
- Table 133: Global Dried Soups Market Revenue Million Forecast, by Distribution Channel 2019 & 2032
- Table 134: Global Dried Soups Market Volume Liters Forecast, by Distribution Channel 2019 & 2032
- Table 135: Global Dried Soups Market Revenue Million Forecast, by Country 2019 & 2032
- Table 136: Global Dried Soups Market Volume Liters Forecast, by Country 2019 & 2032
- Table 137: Brazil Dried Soups Market Revenue (Million) Forecast, by Application 2019 & 2032
- Table 138: Brazil Dried Soups Market Volume (Liters) Forecast, by Application 2019 & 2032
- Table 139: Argentina Dried Soups Market Revenue (Million) Forecast, by Application 2019 & 2032
- Table 140: Argentina Dried Soups Market Volume (Liters) Forecast, by Application 2019 & 2032
- Table 141: Rest of South America Dried Soups Market Revenue (Million) Forecast, by Application 2019 & 2032
- Table 142: Rest of South America Dried Soups Market Volume (Liters) Forecast, by Application 2019 & 2032
- Table 143: Global Dried Soups Market Revenue Million Forecast, by Type 2019 & 2032
- Table 144: Global Dried Soups Market Volume Liters Forecast, by Type 2019 & 2032
- Table 145: Global Dried Soups Market Revenue Million Forecast, by Packaging 2019 & 2032
- Table 146: Global Dried Soups Market Volume Liters Forecast, by Packaging 2019 & 2032
- Table 147: Global Dried Soups Market Revenue Million Forecast, by Distribution Channel 2019 & 2032
- Table 148: Global Dried Soups Market Volume Liters Forecast, by Distribution Channel 2019 & 2032
- Table 149: Global Dried Soups Market Revenue Million Forecast, by Country 2019 & 2032
- Table 150: Global Dried Soups Market Volume Liters Forecast, by Country 2019 & 2032
- Table 151: Global Dried Soups Market Revenue Million Forecast, by Type 2019 & 2032
- Table 152: Global Dried Soups Market Volume Liters Forecast, by Type 2019 & 2032
- Table 153: Global Dried Soups Market Revenue Million Forecast, by Packaging 2019 & 2032
- Table 154: Global Dried Soups Market Volume Liters Forecast, by Packaging 2019 & 2032
- Table 155: Global Dried Soups Market Revenue Million Forecast, by Distribution Channel 2019 & 2032
- Table 156: Global Dried Soups Market Volume Liters Forecast, by Distribution Channel 2019 & 2032
- Table 157: Global Dried Soups Market Revenue Million Forecast, by Country 2019 & 2032
- Table 158: Global Dried Soups Market Volume Liters Forecast, by Country 2019 & 2032
- Table 159: Saudi Arabia Dried Soups Market Revenue (Million) Forecast, by Application 2019 & 2032
- Table 160: Saudi Arabia Dried Soups Market Volume (Liters) Forecast, by Application 2019 & 2032
- Table 161: Rest of MEA Dried Soups Market Revenue (Million) Forecast, by Application 2019 & 2032
- Table 162: Rest of MEA Dried Soups Market Volume (Liters) Forecast, by Application 2019 & 2032
Frequently Asked Questions
1. What is the projected Compound Annual Growth Rate (CAGR) of the Dried Soups Market?
The projected CAGR is approximately 3.21%.
2. Which companies are prominent players in the Dried Soups Market?
Key companies in the market include B&G Foods Inc, Premier Foods Group Services Ltd, Maya Kaimal Foods LLC, The Kroger Co, Unilever PLC, Hain Celestial Group Inc, Brodo Company, Harmony House Foods Inc *List Not Exhaustive, General Mills, Campbell Soup Co, Kraft Heinz Company, Nestlé S A.
3. What are the main segments of the Dried Soups Market?
The market segments include Type, Packaging, Distribution Channel.
4. Can you provide details about the market size?
The market size is estimated to be USD 15930 Million as of 2022.
5. What are some drivers contributing to market growth?
Prevalence of Lactose Intolerance Driving the Market; Growing Influence of Healthy Lifestyle Trends and Rising Non-Traditional Users.
6. What are the notable trends driving market growth?
Growing Demand for Ready to Eat Food health based foods.
7. Are there any restraints impacting market growth?
Wide Availability of Alternative Protein Sources.
8. Can you provide examples of recent developments in the market?
November 2022: Heinz has launched a fully vegan version of its popular Christmas Dinner Big Soup recipe. The newly developed vegan recipe is filled with plant-based sausage, stuffing balls, and root vegetables, all in a thick gravy. It comes after Heinz released plant-based burgers and mince in October, indicating the brand is embracing the ever-growing vegan market. These products are retailed across convenience stores and supermarkets across the United Kingdom.
9. What pricing options are available for accessing the report?
Pricing options include single-user, multi-user, and enterprise licenses priced at USD 4750, USD 5250, and USD 8750 respectively.
10. Is the market size provided in terms of value or volume?
The market size is provided in terms of value, measured in Million and volume, measured in Liters.
11. Are there any specific market keywords associated with the report?
Yes, the market keyword associated with the report is "Dried Soups Market," which aids in identifying and referencing the specific market segment covered.
12. How do I determine which pricing option suits my needs best?
The pricing options vary based on user requirements and access needs. Individual users may opt for single-user licenses, while businesses requiring broader access may choose multi-user or enterprise licenses for cost-effective access to the report.
13. Are there any additional resources or data provided in the Dried Soups Market report?
While the report offers comprehensive insights, it's advisable to review the specific contents or supplementary materials provided to ascertain if additional resources or data are available.
14. How can I stay updated on further developments or reports in the Dried Soups Market?
To stay informed about further developments, trends, and reports in the Dried Soups Market, consider subscribing to industry newsletters, following relevant companies and organizations, or regularly checking reputable industry news sources and publications.
Methodology
Step 1 - Identification of Relevant Samples Size from Population Database


Step 2 - Approaches for Defining Global Market Size (Value, Volume* & Price*)

Note*: In applicable scenarios
Step 3 - Data Sources
Primary Research
- Web Analytics
- Survey Reports
- Research Institute
- Latest Research Reports
- Opinion Leaders
Secondary Research
- Annual Reports
- White Paper
- Latest Press Release
- Industry Association
- Paid Database
- Investor Presentations

Step 4 - Data Triangulation
Involves using different sources of information in order to increase the validity of a study
These sources are likely to be stakeholders in a program - participants, other researchers, program staff, other community members, and so on.
Then we put all data in single framework & apply various statistical tools to find out the dynamic on the market.
During the analysis stage, feedback from the stakeholder groups would be compared to determine areas of agreement as well as areas of divergence


