
Key Insights
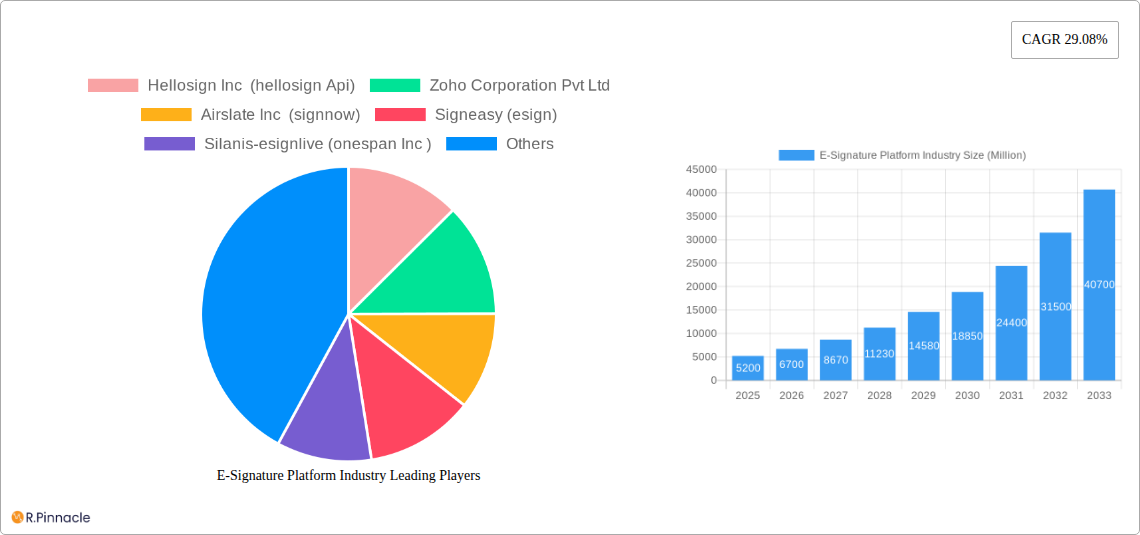
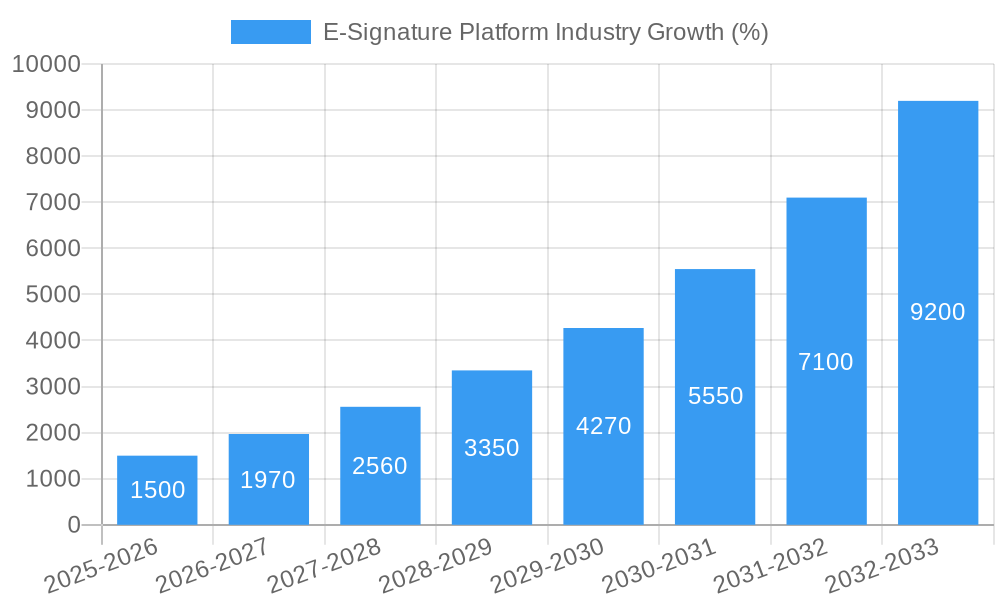
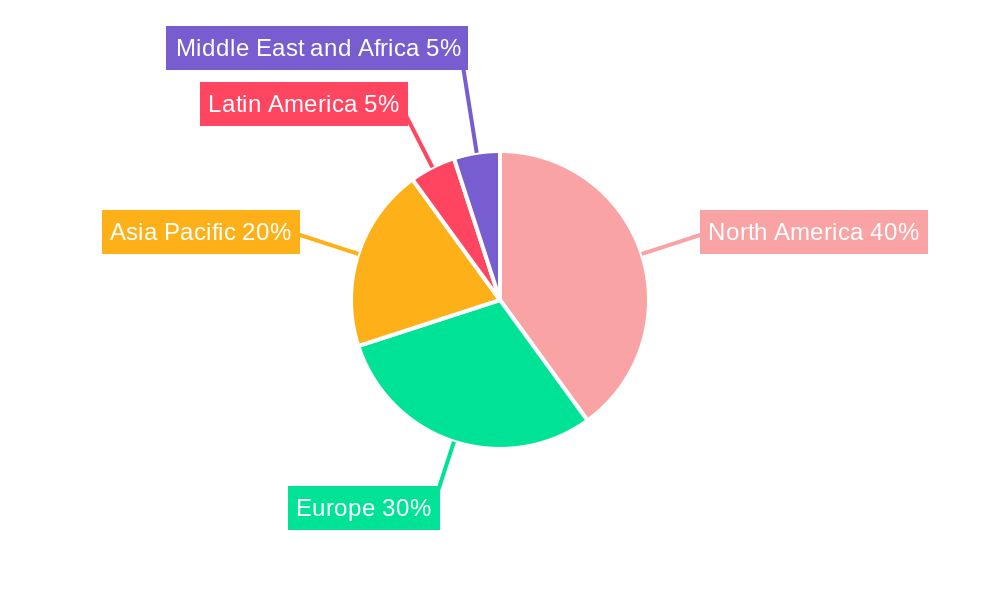
The global e-signature platform market is experiencing robust growth, projected to reach $5.20 billion in 2025 and maintain a Compound Annual Growth Rate (CAGR) of 29.08% from 2025 to 2033. This expansion is fueled by several key factors. The increasing adoption of digital transformation strategies across various sectors, coupled with the rising need for efficient document management and streamlined workflows, is a primary driver. Regulatory compliance mandates and the inherent security benefits offered by e-signature solutions are further propelling market growth. The shift towards remote work models, accelerated by recent global events, has also significantly boosted demand for secure and legally binding digital signature capabilities. Furthermore, continuous technological advancements, such as the integration of artificial intelligence and improved user interfaces, are enhancing the overall user experience and driving wider adoption. The market is segmented by deployment (on-premise and cloud), organization size (small and medium enterprises (SMEs) and large enterprises), and end-user industry (BFSI, government and defense, healthcare, oil and gas, IT and telecom, logistics and transportation, and others). The cloud-based segment is expected to dominate due to its scalability, accessibility, and cost-effectiveness. Large enterprises are currently the key adopters, but growing awareness and affordability are driving significant growth in the SME sector. North America and Europe currently hold substantial market shares, but the Asia-Pacific region is projected to witness the fastest growth due to increasing digitalization and economic expansion.
Competition in the e-signature platform market is intense, with established players like DocuSign, Adobe, and HelloSign vying for market share alongside emerging players offering innovative features and competitive pricing. The market's future trajectory hinges on several factors. Continued innovation in security features, particularly addressing concerns around data breaches and forgery, will be crucial. Integration with other business applications and the development of seamless user experiences will also play a significant role. Furthermore, regulatory developments and evolving data privacy regulations will continue to shape market dynamics. The increasing emphasis on sustainability and the desire to reduce paper consumption will further bolster the adoption of e-signature solutions across industries. Successful companies will be those that effectively address these factors and adapt to the evolving needs of the market.
E-Signature Platform Industry Report: 2019-2033
This comprehensive report provides an in-depth analysis of the E-Signature Platform industry, offering valuable insights for industry professionals, investors, and stakeholders. Covering the period from 2019 to 2033, with a focus on 2025, this report projects a market valued in the Billions, revealing key trends, challenges, and opportunities shaping this rapidly evolving sector.
E-Signature Platform Industry Market Structure & Innovation Trends
The E-Signature Platform market is characterized by a blend of established players and emerging innovators. Market concentration is moderate, with several key players holding significant market share, while numerous smaller companies compete for niche segments. DocuSign Inc and Adobe Inc currently hold a substantial portion of the market. However, the market demonstrates significant dynamism, fueled by continuous innovation in areas such as security, integration capabilities, and user experience. Regulatory frameworks, particularly concerning legal validity and data privacy, play a crucial role in shaping market dynamics. The industry witnesses consistent M&A activity, as larger players seek to expand their market reach and enhance their product offerings. For example, PandaDoc's acquisition of LiveNotary demonstrates a strategic move to broaden its capabilities. While precise M&A deal values for all transactions are not publicly available, we estimate that the total value of M&A transactions in the period 2019-2024 exceeded $xx Billion. The average deal size was approximately $xx Million. Product substitutes, such as traditional paper-based signatures, still exist but are rapidly losing market share due to the increased efficiency and cost-effectiveness offered by e-signature platforms. End-user demographics are diversifying, spanning various sectors, with a strong focus on enterprises and SMEs.
E-Signature Platform Industry Market Dynamics & Trends
The E-Signature Platform market is experiencing robust growth, driven by factors such as the increasing adoption of digital technologies across various industries, the growing need for streamlined workflows, and the expanding regulatory acceptance of electronic signatures. The market's Compound Annual Growth Rate (CAGR) is projected at xx% during the forecast period (2025-2033). This growth is fueled by technological advancements leading to increased security, improved user experience, and seamless integration with other business applications. Market penetration is high among larger enterprises, yet significant growth potential remains within the SME segment. Competitive dynamics are shaped by ongoing innovation, strategic partnerships, and aggressive pricing strategies. The market's maturity is reflected in high adoption rates in sectors like BFSI and government, yet continued expansion into other sectors including healthcare and Oil & Gas signifies significant untapped potential.
Dominant Regions & Segments in E-Signature Platform Industry
The North American region currently dominates the global E-Signature Platform market, driven by high levels of digital adoption, strong regulatory support, and the presence of major market players. However, significant growth potential is expected in regions like Asia-Pacific.
- By Deployment: The cloud segment holds a dominant position, offering scalability, accessibility, and cost-effectiveness. On-premise deployment continues to retain relevance for specific security and regulatory needs.
- By Organization Size: The large enterprise segment contributes substantially to the current market revenue due to high adoption rates. However, growth is predicted to be stronger in the SME segment due to increasing digital transformation efforts and a wide range of cost-effective solutions.
- By End-User: The BFSI sector is a significant adopter of E-Signature Platforms, closely followed by the Government and Defense, and Healthcare industries. However, rising adoption rates are expected across sectors like IT and Telecom, Logistics and Transportation. Key Drivers for dominance in these segments are:
- BFSI: Stringent regulatory requirements and a need for secure, auditable transaction processing.
- Government & Defense: Emphasis on efficiency, cost reduction, and improved citizen service delivery.
- Healthcare: Compliance with HIPAA regulations and the need to simplify patient documentation.
E-Signature Platform Industry Product Innovations
Recent product innovations focus on enhanced security features, improved user interfaces, integration with existing business workflows, and the incorporation of advanced features such as AI-powered document processing and automated workflows. This trend reflects a market striving to meet the growing demand for secure, efficient, and user-friendly solutions. The increasing integration with other software platforms through APIs, such as Hellosign API, is significantly boosting market adoption.
Report Scope & Segmentation Analysis
This report comprehensively analyzes the E-Signature Platform market across various segments:
- By Deployment: Cloud and On-premise. The cloud segment is projected to grow at a CAGR of xx% during the forecast period, driven by its scalability, cost-effectiveness, and accessibility.
- By Organization Size: Small and Medium Enterprises (SMEs) and Large Enterprises. The SME segment is anticipated to showcase higher growth compared to the large enterprise segment, driven by an increasing focus on digital transformation.
- By End-User: BFSI, Government and Defense, Healthcare, Oil and Gas, IT and Telecom, Logistics and Transportation, and Other End-user Industries. Each segment exhibits unique growth trajectories based on specific industry needs and regulatory landscapes. The BFSI and Government & Defense segments are expected to maintain significant market share.
Key Drivers of E-Signature Platform Industry Growth
Several factors drive the E-Signature Platform market's growth. The increasing adoption of digital technologies across industries reduces operational costs and speeds up processes. Regulatory support for electronic signatures increases legal acceptance. The rising demand for secure, auditable transaction processing fuels growth, particularly in sectors like BFSI. Technological advancements lead to more user-friendly interfaces and improved security features, further boosting adoption.
Challenges in the E-Signature Platform Industry Sector
Challenges include maintaining robust security against cyber threats and ensuring compliance with evolving data privacy regulations. Supply chain disruptions can impact product availability and pricing. The competitive landscape, characterized by numerous players, creates pricing pressures and necessitates continuous innovation to maintain a competitive edge. These challenges impact the market by potentially slowing down adoption rates and increasing operational costs for providers. We estimate these factors negatively impact market growth by approximately xx% annually.
Emerging Opportunities in E-Signature Platform Industry
Emerging opportunities lie in expanding into new geographic markets, particularly in developing economies with increasing digital adoption. The integration of AI and machine learning enhances automation and user experience. Specialized solutions targeting specific industry verticals present significant opportunities. The growing demand for solutions that ensure regulatory compliance will be a key driver of future growth.
Leading Players in the E-Signature Platform Industry Market
- Hellosign Inc (hellosign Api)
- Zoho Corporation Pvt Ltd
- Airslate Inc (signnow)
- Signeasy (esign)
- Silanis-esignlive (onespan Inc )
- Adobe Inc
- Yousign
- Docusign Inc
- Rightsignature (citrix Systems)
- Pandadoc Inc
Key Developments in E-Signature Platform Industry
- March 2022: PandaDoc announced the acquisition of LiveNotary, expanding its digital document management solutions. This significantly enhanced its offerings in the SMB market.
- March 2022: PandaDoc partnered with QuickBooks, enhancing its integration capabilities and expanding its reach within the accounting software market.
- August 2022: ZorroSign upgraded its user experience and interface, improving its competitive position.
- September 2022: NIST's request for additional digital signature proposals signifies a crucial development in the standardization of post-quantum cryptography, impacting long-term market security standards.
Future Outlook for E-Signature Platform Industry Market
The E-Signature Platform market is poised for continued strong growth, fueled by technological advancements, increasing regulatory acceptance, and the growing demand for efficient and secure document management solutions across diverse industries. The market's future potential is particularly strong in emerging economies and in sectors with relatively low current penetration rates. Strategic partnerships, continuous innovation, and expansion into new verticals will be crucial for players to capitalize on the significant opportunities in this market.
E-Signature Platform Industry Segmentation
-
1. Deployment
- 1.1. On-premise
- 1.2. Cloud
-
2. Organization Size
- 2.1. Small and Medium Enterprise
- 2.2. Large Enterprise
-
3. End-User Industry
- 3.1. BFSI
- 3.2. Government and Defense
- 3.3. Healthcare
- 3.4. Oil and Gas
- 3.5. IT and Telecom
- 3.6. Logistics and Transportation
- 3.7. Other End-user Industries
E-Signature Platform Industry Segmentation By Geography
-
1. North America
- 1.1. United States
- 1.2. Canada
-
2. Europe
- 2.1. United Kingdom
- 2.2. Germany
- 2.3. France
- 2.4. Italy
-
3. Asia
- 3.1. China
- 3.2. Japan
- 3.3. South Korea
- 4. Australia and New Zealand
- 5. Latin America
- 6. Middle East and Africa
E-Signature Platform Industry REPORT HIGHLIGHTS
| Aspects | Details |
|---|---|
| Study Period | 2019-2033 |
| Base Year | 2024 |
| Estimated Year | 2025 |
| Forecast Period | 2025-2033 |
| Historical Period | 2019-2024 |
| Growth Rate | CAGR of 29.08% from 2019-2033 |
| Segmentation |
|
Table of Contents
- 1. Introduction
- 1.1. Research Scope
- 1.2. Market Segmentation
- 1.3. Research Methodology
- 1.4. Definitions and Assumptions
- 2. Executive Summary
- 2.1. Introduction
- 3. Market Dynamics
- 3.1. Introduction
- 3.2. Market Drivers
- 3.2.1. Rise In E-signatures And Adoption Of Cloud-based Services; Increase In Remote Work Culture And Overseas Contracts
- 3.3. Market Restrains
- 3.3.1. Increasing Vulnerability Related To Cyber-attacks and Frauds
- 3.4. Market Trends
- 3.4.1. Government and Defense to hold significant share
- 4. Market Factor Analysis
- 4.1. Porters Five Forces
- 4.2. Supply/Value Chain
- 4.3. PESTEL analysis
- 4.4. Market Entropy
- 4.5. Patent/Trademark Analysis
- 5. Global E-Signature Platform Industry Analysis, Insights and Forecast, 2019-2031
- 5.1. Market Analysis, Insights and Forecast - by Deployment
- 5.1.1. On-premise
- 5.1.2. Cloud
- 5.2. Market Analysis, Insights and Forecast - by Organization Size
- 5.2.1. Small and Medium Enterprise
- 5.2.2. Large Enterprise
- 5.3. Market Analysis, Insights and Forecast - by End-User Industry
- 5.3.1. BFSI
- 5.3.2. Government and Defense
- 5.3.3. Healthcare
- 5.3.4. Oil and Gas
- 5.3.5. IT and Telecom
- 5.3.6. Logistics and Transportation
- 5.3.7. Other End-user Industries
- 5.4. Market Analysis, Insights and Forecast - by Region
- 5.4.1. North America
- 5.4.2. Europe
- 5.4.3. Asia
- 5.4.4. Australia and New Zealand
- 5.4.5. Latin America
- 5.4.6. Middle East and Africa
- 5.1. Market Analysis, Insights and Forecast - by Deployment
- 6. North America E-Signature Platform Industry Analysis, Insights and Forecast, 2019-2031
- 6.1. Market Analysis, Insights and Forecast - by Deployment
- 6.1.1. On-premise
- 6.1.2. Cloud
- 6.2. Market Analysis, Insights and Forecast - by Organization Size
- 6.2.1. Small and Medium Enterprise
- 6.2.2. Large Enterprise
- 6.3. Market Analysis, Insights and Forecast - by End-User Industry
- 6.3.1. BFSI
- 6.3.2. Government and Defense
- 6.3.3. Healthcare
- 6.3.4. Oil and Gas
- 6.3.5. IT and Telecom
- 6.3.6. Logistics and Transportation
- 6.3.7. Other End-user Industries
- 6.1. Market Analysis, Insights and Forecast - by Deployment
- 7. Europe E-Signature Platform Industry Analysis, Insights and Forecast, 2019-2031
- 7.1. Market Analysis, Insights and Forecast - by Deployment
- 7.1.1. On-premise
- 7.1.2. Cloud
- 7.2. Market Analysis, Insights and Forecast - by Organization Size
- 7.2.1. Small and Medium Enterprise
- 7.2.2. Large Enterprise
- 7.3. Market Analysis, Insights and Forecast - by End-User Industry
- 7.3.1. BFSI
- 7.3.2. Government and Defense
- 7.3.3. Healthcare
- 7.3.4. Oil and Gas
- 7.3.5. IT and Telecom
- 7.3.6. Logistics and Transportation
- 7.3.7. Other End-user Industries
- 7.1. Market Analysis, Insights and Forecast - by Deployment
- 8. Asia E-Signature Platform Industry Analysis, Insights and Forecast, 2019-2031
- 8.1. Market Analysis, Insights and Forecast - by Deployment
- 8.1.1. On-premise
- 8.1.2. Cloud
- 8.2. Market Analysis, Insights and Forecast - by Organization Size
- 8.2.1. Small and Medium Enterprise
- 8.2.2. Large Enterprise
- 8.3. Market Analysis, Insights and Forecast - by End-User Industry
- 8.3.1. BFSI
- 8.3.2. Government and Defense
- 8.3.3. Healthcare
- 8.3.4. Oil and Gas
- 8.3.5. IT and Telecom
- 8.3.6. Logistics and Transportation
- 8.3.7. Other End-user Industries
- 8.1. Market Analysis, Insights and Forecast - by Deployment
- 9. Australia and New Zealand E-Signature Platform Industry Analysis, Insights and Forecast, 2019-2031
- 9.1. Market Analysis, Insights and Forecast - by Deployment
- 9.1.1. On-premise
- 9.1.2. Cloud
- 9.2. Market Analysis, Insights and Forecast - by Organization Size
- 9.2.1. Small and Medium Enterprise
- 9.2.2. Large Enterprise
- 9.3. Market Analysis, Insights and Forecast - by End-User Industry
- 9.3.1. BFSI
- 9.3.2. Government and Defense
- 9.3.3. Healthcare
- 9.3.4. Oil and Gas
- 9.3.5. IT and Telecom
- 9.3.6. Logistics and Transportation
- 9.3.7. Other End-user Industries
- 9.1. Market Analysis, Insights and Forecast - by Deployment
- 10. Latin America E-Signature Platform Industry Analysis, Insights and Forecast, 2019-2031
- 10.1. Market Analysis, Insights and Forecast - by Deployment
- 10.1.1. On-premise
- 10.1.2. Cloud
- 10.2. Market Analysis, Insights and Forecast - by Organization Size
- 10.2.1. Small and Medium Enterprise
- 10.2.2. Large Enterprise
- 10.3. Market Analysis, Insights and Forecast - by End-User Industry
- 10.3.1. BFSI
- 10.3.2. Government and Defense
- 10.3.3. Healthcare
- 10.3.4. Oil and Gas
- 10.3.5. IT and Telecom
- 10.3.6. Logistics and Transportation
- 10.3.7. Other End-user Industries
- 10.1. Market Analysis, Insights and Forecast - by Deployment
- 11. Middle East and Africa E-Signature Platform Industry Analysis, Insights and Forecast, 2019-2031
- 11.1. Market Analysis, Insights and Forecast - by Deployment
- 11.1.1. On-premise
- 11.1.2. Cloud
- 11.2. Market Analysis, Insights and Forecast - by Organization Size
- 11.2.1. Small and Medium Enterprise
- 11.2.2. Large Enterprise
- 11.3. Market Analysis, Insights and Forecast - by End-User Industry
- 11.3.1. BFSI
- 11.3.2. Government and Defense
- 11.3.3. Healthcare
- 11.3.4. Oil and Gas
- 11.3.5. IT and Telecom
- 11.3.6. Logistics and Transportation
- 11.3.7. Other End-user Industries
- 11.1. Market Analysis, Insights and Forecast - by Deployment
- 12. North America E-Signature Platform Industry Analysis, Insights and Forecast, 2019-2031
- 12.1. Market Analysis, Insights and Forecast - By Country/Sub-region
- 12.1.1 United States
- 12.1.2 Canada
- 13. Europe E-Signature Platform Industry Analysis, Insights and Forecast, 2019-2031
- 13.1. Market Analysis, Insights and Forecast - By Country/Sub-region
- 13.1.1 United Kingdom
- 13.1.2 Germany
- 13.1.3 France
- 13.1.4 Italy
- 13.1.5 Rest of Europe
- 14. Asia Pacific E-Signature Platform Industry Analysis, Insights and Forecast, 2019-2031
- 14.1. Market Analysis, Insights and Forecast - By Country/Sub-region
- 14.1.1 China
- 14.1.2 Japan
- 14.1.3 South Korea
- 14.1.4 Rest of Asia Pacific
- 15. Latin America E-Signature Platform Industry Analysis, Insights and Forecast, 2019-2031
- 15.1. Market Analysis, Insights and Forecast - By Country/Sub-region
- 15.1.1.
- 16. Middle East and Africa E-Signature Platform Industry Analysis, Insights and Forecast, 2019-2031
- 16.1. Market Analysis, Insights and Forecast - By Country/Sub-region
- 16.1.1.
- 17. Competitive Analysis
- 17.1. Global Market Share Analysis 2024
- 17.2. Company Profiles
- 17.2.1 Hellosign Inc (hellosign Api)
- 17.2.1.1. Overview
- 17.2.1.2. Products
- 17.2.1.3. SWOT Analysis
- 17.2.1.4. Recent Developments
- 17.2.1.5. Financials (Based on Availability)
- 17.2.2 Zoho Corporation Pvt Ltd
- 17.2.2.1. Overview
- 17.2.2.2. Products
- 17.2.2.3. SWOT Analysis
- 17.2.2.4. Recent Developments
- 17.2.2.5. Financials (Based on Availability)
- 17.2.3 Airslate Inc (signnow)
- 17.2.3.1. Overview
- 17.2.3.2. Products
- 17.2.3.3. SWOT Analysis
- 17.2.3.4. Recent Developments
- 17.2.3.5. Financials (Based on Availability)
- 17.2.4 Signeasy (esign)
- 17.2.4.1. Overview
- 17.2.4.2. Products
- 17.2.4.3. SWOT Analysis
- 17.2.4.4. Recent Developments
- 17.2.4.5. Financials (Based on Availability)
- 17.2.5 Silanis-esignlive (onespan Inc )
- 17.2.5.1. Overview
- 17.2.5.2. Products
- 17.2.5.3. SWOT Analysis
- 17.2.5.4. Recent Developments
- 17.2.5.5. Financials (Based on Availability)
- 17.2.6 Adobe Inc
- 17.2.6.1. Overview
- 17.2.6.2. Products
- 17.2.6.3. SWOT Analysis
- 17.2.6.4. Recent Developments
- 17.2.6.5. Financials (Based on Availability)
- 17.2.7 Yousign
- 17.2.7.1. Overview
- 17.2.7.2. Products
- 17.2.7.3. SWOT Analysis
- 17.2.7.4. Recent Developments
- 17.2.7.5. Financials (Based on Availability)
- 17.2.8 Docusign Inc
- 17.2.8.1. Overview
- 17.2.8.2. Products
- 17.2.8.3. SWOT Analysis
- 17.2.8.4. Recent Developments
- 17.2.8.5. Financials (Based on Availability)
- 17.2.9 Rightsignature (citrix Systems)
- 17.2.9.1. Overview
- 17.2.9.2. Products
- 17.2.9.3. SWOT Analysis
- 17.2.9.4. Recent Developments
- 17.2.9.5. Financials (Based on Availability)
- 17.2.10 Pandadoc Inc
- 17.2.10.1. Overview
- 17.2.10.2. Products
- 17.2.10.3. SWOT Analysis
- 17.2.10.4. Recent Developments
- 17.2.10.5. Financials (Based on Availability)
- 17.2.1 Hellosign Inc (hellosign Api)
List of Figures
- Figure 1: Global E-Signature Platform Industry Revenue Breakdown (Million, %) by Region 2024 & 2032
- Figure 2: North America E-Signature Platform Industry Revenue (Million), by Country 2024 & 2032
- Figure 3: North America E-Signature Platform Industry Revenue Share (%), by Country 2024 & 2032
- Figure 4: Europe E-Signature Platform Industry Revenue (Million), by Country 2024 & 2032
- Figure 5: Europe E-Signature Platform Industry Revenue Share (%), by Country 2024 & 2032
- Figure 6: Asia Pacific E-Signature Platform Industry Revenue (Million), by Country 2024 & 2032
- Figure 7: Asia Pacific E-Signature Platform Industry Revenue Share (%), by Country 2024 & 2032
- Figure 8: Latin America E-Signature Platform Industry Revenue (Million), by Country 2024 & 2032
- Figure 9: Latin America E-Signature Platform Industry Revenue Share (%), by Country 2024 & 2032
- Figure 10: Middle East and Africa E-Signature Platform Industry Revenue (Million), by Country 2024 & 2032
- Figure 11: Middle East and Africa E-Signature Platform Industry Revenue Share (%), by Country 2024 & 2032
- Figure 12: North America E-Signature Platform Industry Revenue (Million), by Deployment 2024 & 2032
- Figure 13: North America E-Signature Platform Industry Revenue Share (%), by Deployment 2024 & 2032
- Figure 14: North America E-Signature Platform Industry Revenue (Million), by Organization Size 2024 & 2032
- Figure 15: North America E-Signature Platform Industry Revenue Share (%), by Organization Size 2024 & 2032
- Figure 16: North America E-Signature Platform Industry Revenue (Million), by End-User Industry 2024 & 2032
- Figure 17: North America E-Signature Platform Industry Revenue Share (%), by End-User Industry 2024 & 2032
- Figure 18: North America E-Signature Platform Industry Revenue (Million), by Country 2024 & 2032
- Figure 19: North America E-Signature Platform Industry Revenue Share (%), by Country 2024 & 2032
- Figure 20: Europe E-Signature Platform Industry Revenue (Million), by Deployment 2024 & 2032
- Figure 21: Europe E-Signature Platform Industry Revenue Share (%), by Deployment 2024 & 2032
- Figure 22: Europe E-Signature Platform Industry Revenue (Million), by Organization Size 2024 & 2032
- Figure 23: Europe E-Signature Platform Industry Revenue Share (%), by Organization Size 2024 & 2032
- Figure 24: Europe E-Signature Platform Industry Revenue (Million), by End-User Industry 2024 & 2032
- Figure 25: Europe E-Signature Platform Industry Revenue Share (%), by End-User Industry 2024 & 2032
- Figure 26: Europe E-Signature Platform Industry Revenue (Million), by Country 2024 & 2032
- Figure 27: Europe E-Signature Platform Industry Revenue Share (%), by Country 2024 & 2032
- Figure 28: Asia E-Signature Platform Industry Revenue (Million), by Deployment 2024 & 2032
- Figure 29: Asia E-Signature Platform Industry Revenue Share (%), by Deployment 2024 & 2032
- Figure 30: Asia E-Signature Platform Industry Revenue (Million), by Organization Size 2024 & 2032
- Figure 31: Asia E-Signature Platform Industry Revenue Share (%), by Organization Size 2024 & 2032
- Figure 32: Asia E-Signature Platform Industry Revenue (Million), by End-User Industry 2024 & 2032
- Figure 33: Asia E-Signature Platform Industry Revenue Share (%), by End-User Industry 2024 & 2032
- Figure 34: Asia E-Signature Platform Industry Revenue (Million), by Country 2024 & 2032
- Figure 35: Asia E-Signature Platform Industry Revenue Share (%), by Country 2024 & 2032
- Figure 36: Australia and New Zealand E-Signature Platform Industry Revenue (Million), by Deployment 2024 & 2032
- Figure 37: Australia and New Zealand E-Signature Platform Industry Revenue Share (%), by Deployment 2024 & 2032
- Figure 38: Australia and New Zealand E-Signature Platform Industry Revenue (Million), by Organization Size 2024 & 2032
- Figure 39: Australia and New Zealand E-Signature Platform Industry Revenue Share (%), by Organization Size 2024 & 2032
- Figure 40: Australia and New Zealand E-Signature Platform Industry Revenue (Million), by End-User Industry 2024 & 2032
- Figure 41: Australia and New Zealand E-Signature Platform Industry Revenue Share (%), by End-User Industry 2024 & 2032
- Figure 42: Australia and New Zealand E-Signature Platform Industry Revenue (Million), by Country 2024 & 2032
- Figure 43: Australia and New Zealand E-Signature Platform Industry Revenue Share (%), by Country 2024 & 2032
- Figure 44: Latin America E-Signature Platform Industry Revenue (Million), by Deployment 2024 & 2032
- Figure 45: Latin America E-Signature Platform Industry Revenue Share (%), by Deployment 2024 & 2032
- Figure 46: Latin America E-Signature Platform Industry Revenue (Million), by Organization Size 2024 & 2032
- Figure 47: Latin America E-Signature Platform Industry Revenue Share (%), by Organization Size 2024 & 2032
- Figure 48: Latin America E-Signature Platform Industry Revenue (Million), by End-User Industry 2024 & 2032
- Figure 49: Latin America E-Signature Platform Industry Revenue Share (%), by End-User Industry 2024 & 2032
- Figure 50: Latin America E-Signature Platform Industry Revenue (Million), by Country 2024 & 2032
- Figure 51: Latin America E-Signature Platform Industry Revenue Share (%), by Country 2024 & 2032
- Figure 52: Middle East and Africa E-Signature Platform Industry Revenue (Million), by Deployment 2024 & 2032
- Figure 53: Middle East and Africa E-Signature Platform Industry Revenue Share (%), by Deployment 2024 & 2032
- Figure 54: Middle East and Africa E-Signature Platform Industry Revenue (Million), by Organization Size 2024 & 2032
- Figure 55: Middle East and Africa E-Signature Platform Industry Revenue Share (%), by Organization Size 2024 & 2032
- Figure 56: Middle East and Africa E-Signature Platform Industry Revenue (Million), by End-User Industry 2024 & 2032
- Figure 57: Middle East and Africa E-Signature Platform Industry Revenue Share (%), by End-User Industry 2024 & 2032
- Figure 58: Middle East and Africa E-Signature Platform Industry Revenue (Million), by Country 2024 & 2032
- Figure 59: Middle East and Africa E-Signature Platform Industry Revenue Share (%), by Country 2024 & 2032
List of Tables
- Table 1: Global E-Signature Platform Industry Revenue Million Forecast, by Region 2019 & 2032
- Table 2: Global E-Signature Platform Industry Revenue Million Forecast, by Deployment 2019 & 2032
- Table 3: Global E-Signature Platform Industry Revenue Million Forecast, by Organization Size 2019 & 2032
- Table 4: Global E-Signature Platform Industry Revenue Million Forecast, by End-User Industry 2019 & 2032
- Table 5: Global E-Signature Platform Industry Revenue Million Forecast, by Region 2019 & 2032
- Table 6: Global E-Signature Platform Industry Revenue Million Forecast, by Country 2019 & 2032
- Table 7: United States E-Signature Platform Industry Revenue (Million) Forecast, by Application 2019 & 2032
- Table 8: Canada E-Signature Platform Industry Revenue (Million) Forecast, by Application 2019 & 2032
- Table 9: Global E-Signature Platform Industry Revenue Million Forecast, by Country 2019 & 2032
- Table 10: United Kingdom E-Signature Platform Industry Revenue (Million) Forecast, by Application 2019 & 2032
- Table 11: Germany E-Signature Platform Industry Revenue (Million) Forecast, by Application 2019 & 2032
- Table 12: France E-Signature Platform Industry Revenue (Million) Forecast, by Application 2019 & 2032
- Table 13: Italy E-Signature Platform Industry Revenue (Million) Forecast, by Application 2019 & 2032
- Table 14: Rest of Europe E-Signature Platform Industry Revenue (Million) Forecast, by Application 2019 & 2032
- Table 15: Global E-Signature Platform Industry Revenue Million Forecast, by Country 2019 & 2032
- Table 16: China E-Signature Platform Industry Revenue (Million) Forecast, by Application 2019 & 2032
- Table 17: Japan E-Signature Platform Industry Revenue (Million) Forecast, by Application 2019 & 2032
- Table 18: South Korea E-Signature Platform Industry Revenue (Million) Forecast, by Application 2019 & 2032
- Table 19: Rest of Asia Pacific E-Signature Platform Industry Revenue (Million) Forecast, by Application 2019 & 2032
- Table 20: Global E-Signature Platform Industry Revenue Million Forecast, by Country 2019 & 2032
- Table 21: E-Signature Platform Industry Revenue (Million) Forecast, by Application 2019 & 2032
- Table 22: Global E-Signature Platform Industry Revenue Million Forecast, by Country 2019 & 2032
- Table 23: E-Signature Platform Industry Revenue (Million) Forecast, by Application 2019 & 2032
- Table 24: Global E-Signature Platform Industry Revenue Million Forecast, by Deployment 2019 & 2032
- Table 25: Global E-Signature Platform Industry Revenue Million Forecast, by Organization Size 2019 & 2032
- Table 26: Global E-Signature Platform Industry Revenue Million Forecast, by End-User Industry 2019 & 2032
- Table 27: Global E-Signature Platform Industry Revenue Million Forecast, by Country 2019 & 2032
- Table 28: United States E-Signature Platform Industry Revenue (Million) Forecast, by Application 2019 & 2032
- Table 29: Canada E-Signature Platform Industry Revenue (Million) Forecast, by Application 2019 & 2032
- Table 30: Global E-Signature Platform Industry Revenue Million Forecast, by Deployment 2019 & 2032
- Table 31: Global E-Signature Platform Industry Revenue Million Forecast, by Organization Size 2019 & 2032
- Table 32: Global E-Signature Platform Industry Revenue Million Forecast, by End-User Industry 2019 & 2032
- Table 33: Global E-Signature Platform Industry Revenue Million Forecast, by Country 2019 & 2032
- Table 34: United Kingdom E-Signature Platform Industry Revenue (Million) Forecast, by Application 2019 & 2032
- Table 35: Germany E-Signature Platform Industry Revenue (Million) Forecast, by Application 2019 & 2032
- Table 36: France E-Signature Platform Industry Revenue (Million) Forecast, by Application 2019 & 2032
- Table 37: Italy E-Signature Platform Industry Revenue (Million) Forecast, by Application 2019 & 2032
- Table 38: Global E-Signature Platform Industry Revenue Million Forecast, by Deployment 2019 & 2032
- Table 39: Global E-Signature Platform Industry Revenue Million Forecast, by Organization Size 2019 & 2032
- Table 40: Global E-Signature Platform Industry Revenue Million Forecast, by End-User Industry 2019 & 2032
- Table 41: Global E-Signature Platform Industry Revenue Million Forecast, by Country 2019 & 2032
- Table 42: China E-Signature Platform Industry Revenue (Million) Forecast, by Application 2019 & 2032
- Table 43: Japan E-Signature Platform Industry Revenue (Million) Forecast, by Application 2019 & 2032
- Table 44: South Korea E-Signature Platform Industry Revenue (Million) Forecast, by Application 2019 & 2032
- Table 45: Global E-Signature Platform Industry Revenue Million Forecast, by Deployment 2019 & 2032
- Table 46: Global E-Signature Platform Industry Revenue Million Forecast, by Organization Size 2019 & 2032
- Table 47: Global E-Signature Platform Industry Revenue Million Forecast, by End-User Industry 2019 & 2032
- Table 48: Global E-Signature Platform Industry Revenue Million Forecast, by Country 2019 & 2032
- Table 49: Global E-Signature Platform Industry Revenue Million Forecast, by Deployment 2019 & 2032
- Table 50: Global E-Signature Platform Industry Revenue Million Forecast, by Organization Size 2019 & 2032
- Table 51: Global E-Signature Platform Industry Revenue Million Forecast, by End-User Industry 2019 & 2032
- Table 52: Global E-Signature Platform Industry Revenue Million Forecast, by Country 2019 & 2032
- Table 53: Global E-Signature Platform Industry Revenue Million Forecast, by Deployment 2019 & 2032
- Table 54: Global E-Signature Platform Industry Revenue Million Forecast, by Organization Size 2019 & 2032
- Table 55: Global E-Signature Platform Industry Revenue Million Forecast, by End-User Industry 2019 & 2032
- Table 56: Global E-Signature Platform Industry Revenue Million Forecast, by Country 2019 & 2032
Frequently Asked Questions
1. What is the projected Compound Annual Growth Rate (CAGR) of the E-Signature Platform Industry?
The projected CAGR is approximately 29.08%.
2. Which companies are prominent players in the E-Signature Platform Industry?
Key companies in the market include Hellosign Inc (hellosign Api), Zoho Corporation Pvt Ltd, Airslate Inc (signnow), Signeasy (esign), Silanis-esignlive (onespan Inc ), Adobe Inc, Yousign, Docusign Inc, Rightsignature (citrix Systems), Pandadoc Inc.
3. What are the main segments of the E-Signature Platform Industry?
The market segments include Deployment, Organization Size, End-User Industry.
4. Can you provide details about the market size?
The market size is estimated to be USD 5.20 Million as of 2022.
5. What are some drivers contributing to market growth?
Rise In E-signatures And Adoption Of Cloud-based Services; Increase In Remote Work Culture And Overseas Contracts.
6. What are the notable trends driving market growth?
Government and Defense to hold significant share.
7. Are there any restraints impacting market growth?
Increasing Vulnerability Related To Cyber-attacks and Frauds.
8. Can you provide examples of recent developments in the market?
September 2022 - The National Institute of Standards and Technology requested additional digital signature proposals to be considered in the Post-Quantum Cryptography (PQC) standardization process. NIST is primarily interested in additional general-purpose signature schemes that are not based on structured lattices. For some applications, including certificate transparency, it may also be interested in signature schemes comprising short signatures and fast verification.
9. What pricing options are available for accessing the report?
Pricing options include single-user, multi-user, and enterprise licenses priced at USD 4750, USD 5250, and USD 8750 respectively.
10. Is the market size provided in terms of value or volume?
The market size is provided in terms of value, measured in Million.
11. Are there any specific market keywords associated with the report?
Yes, the market keyword associated with the report is "E-Signature Platform Industry," which aids in identifying and referencing the specific market segment covered.
12. How do I determine which pricing option suits my needs best?
The pricing options vary based on user requirements and access needs. Individual users may opt for single-user licenses, while businesses requiring broader access may choose multi-user or enterprise licenses for cost-effective access to the report.
13. Are there any additional resources or data provided in the E-Signature Platform Industry report?
While the report offers comprehensive insights, it's advisable to review the specific contents or supplementary materials provided to ascertain if additional resources or data are available.
14. How can I stay updated on further developments or reports in the E-Signature Platform Industry?
To stay informed about further developments, trends, and reports in the E-Signature Platform Industry, consider subscribing to industry newsletters, following relevant companies and organizations, or regularly checking reputable industry news sources and publications.
Methodology
Step 1 - Identification of Relevant Samples Size from Population Database


Step 2 - Approaches for Defining Global Market Size (Value, Volume* & Price*)

Note*: In applicable scenarios
Step 3 - Data Sources
Primary Research
- Web Analytics
- Survey Reports
- Research Institute
- Latest Research Reports
- Opinion Leaders
Secondary Research
- Annual Reports
- White Paper
- Latest Press Release
- Industry Association
- Paid Database
- Investor Presentations

Step 4 - Data Triangulation
Involves using different sources of information in order to increase the validity of a study
These sources are likely to be stakeholders in a program - participants, other researchers, program staff, other community members, and so on.
Then we put all data in single framework & apply various statistical tools to find out the dynamic on the market.
During the analysis stage, feedback from the stakeholder groups would be compared to determine areas of agreement as well as areas of divergence


