
Key Insights
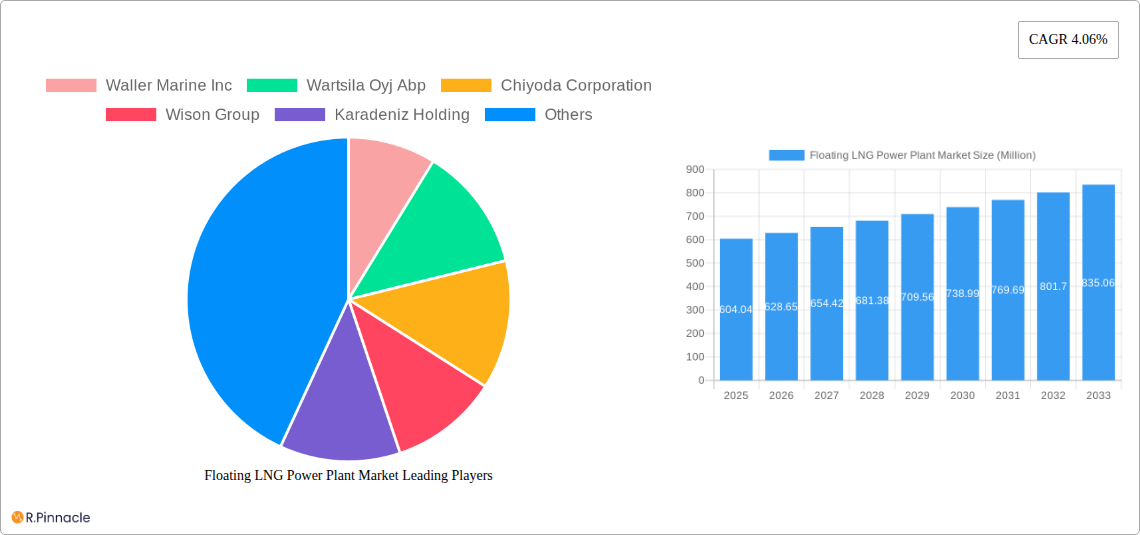
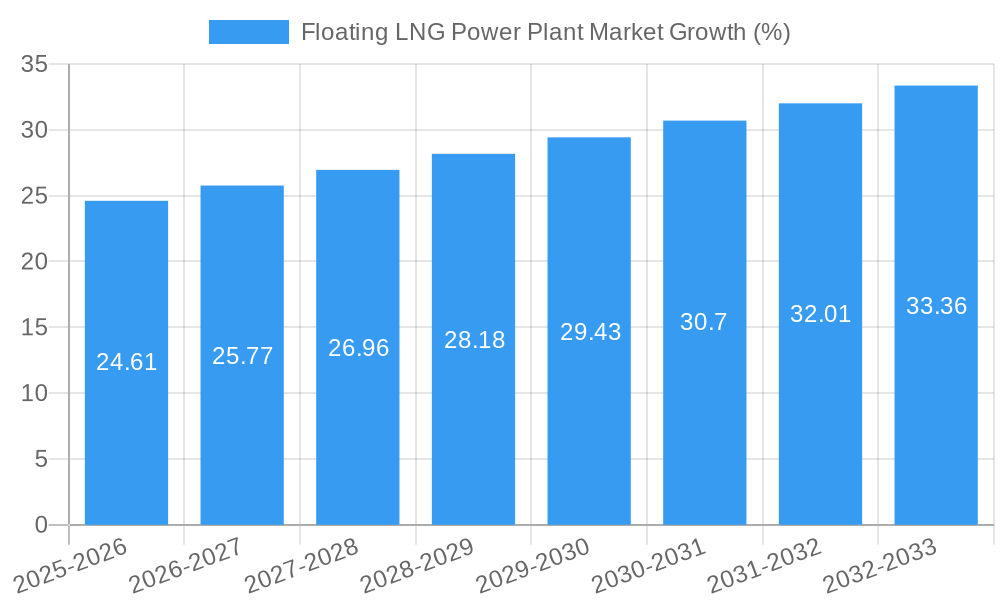
The Floating LNG Power Plant market, valued at $604.04 million in 2025, is projected to experience robust growth, driven by increasing global energy demand, particularly in regions with limited onshore infrastructure. The market's Compound Annual Growth Rate (CAGR) of 4.06% from 2025 to 2033 indicates a steady expansion, fueled by the advantages of floating LNG power plants such as reduced environmental impact compared to traditional power generation, faster deployment times, and greater flexibility in location. Key segments driving growth include gas turbine-based systems due to their efficiency and power output, and power ships due to their larger energy storage capacity and ability to serve remote areas. Growth is also spurred by supportive government policies promoting cleaner energy sources and investments in LNG infrastructure globally. However, challenges remain, including fluctuating LNG prices, technological advancements needed to further enhance efficiency and reduce costs, and the regulatory complexities associated with offshore operations. Leading players such as Wärtsilä, Siemens Energy, and Kawasaki Heavy Industries are investing in technological advancements and strategic partnerships to solidify their market position. The Asia-Pacific region, particularly China, India, and Southeast Asia, is expected to dominate market share due to rapid economic growth and rising energy demand.
The competitive landscape is marked by a mix of established players and emerging companies, each striving for technological leadership and market share. Innovation in power generation technology, specifically the development of more efficient and environmentally friendly gas turbines and integrated systems, will play a crucial role in shaping market dynamics. Further growth will hinge on overcoming the challenges of high capital expenditure, securing long-term contracts for LNG supply, and navigating the complex regulatory environment of different countries. The market presents significant opportunities for companies able to innovate, optimize costs, and establish strategic partnerships within the LNG supply chain. Geographical expansion into emerging markets and strategic collaborations to secure fuel supply are crucial strategies for success in this evolving market.
This comprehensive report provides an in-depth analysis of the Floating LNG Power Plant Market, covering the period from 2019 to 2033. It offers actionable insights for industry professionals, investors, and stakeholders seeking to understand the market dynamics, growth opportunities, and competitive landscape. The report leverages extensive research and data analysis to provide a clear picture of the current market situation and its future trajectory. Key market players such as Waller Marine Inc, Wärtsilä Oyj Abp, Chiyoda Corporation, Wison Group, Karadeniz Holding, Siemens Energy AG, and Kawasaki Heavy Industries Ltd are thoroughly analyzed.
Floating LNG Power Plant Market Structure & Innovation Trends
This section analyzes the market structure, focusing on market concentration, innovation drivers, regulatory frameworks, product substitutes, end-user demographics, and M&A activities. The study period is 2019-2033, with 2025 as the base and estimated year. The forecast period spans 2025-2033, and the historical period covers 2019-2024.
- Market Concentration: The Floating LNG Power Plant market exhibits a moderately concentrated structure, with a few major players holding significant market share. The combined market share of the top 5 players is estimated at xx%. Further analysis reveals the market share of individual players like Wärtsilä Oyj Abp and Karadeniz Holding.
- Innovation Drivers: Key innovation drivers include advancements in gas turbine technology, the development of more efficient and environmentally friendly power generation systems, and the increasing demand for flexible and modular power solutions.
- Regulatory Frameworks: Stringent environmental regulations and evolving safety standards significantly influence market growth. Compliance costs and the need for technological upgrades are key considerations for market players.
- Product Substitutes: Competition comes from other decentralized power generation technologies, including solar, wind, and conventional power plants. However, floating LNG power plants offer advantages in terms of quick deployment and fuel flexibility.
- End-User Demographics: Key end-users include utility companies, independent power producers, and governments seeking flexible and reliable power solutions, particularly in remote or energy-deficient regions.
- M&A Activities: The market has witnessed several M&A activities in recent years, with deal values ranging from xx Million to xx Million. These transactions primarily aim to expand market reach, enhance technological capabilities, and consolidate market share.
Floating LNG Power Plant Market Dynamics & Trends
This section explores the market dynamics and trends impacting growth, including market growth drivers, technological disruptions, consumer preferences, and competitive dynamics. The report estimates a Compound Annual Growth Rate (CAGR) of xx% during the forecast period (2025-2033), driven by factors discussed below. Market penetration is estimated at xx% in 2025, projected to reach xx% by 2033.
The increasing global demand for electricity, especially in regions with limited grid infrastructure, is a major driver. Furthermore, the growing adoption of LNG as a cleaner-burning fuel compared to other fossil fuels is boosting market growth. Technological advancements, such as the development of more efficient gas turbines and improved vessel designs, are also contributing factors. The rising focus on energy security and the need for flexible power solutions, especially in regions facing supply chain disruptions, are crucial elements driving market expansion. Competitive dynamics are characterized by technological innovation, strategic partnerships, and mergers & acquisitions.
Dominant Regions & Segments in Floating LNG Power Plant Market
This section identifies the leading regions, countries, and market segments within the Floating LNG Power Plant market.
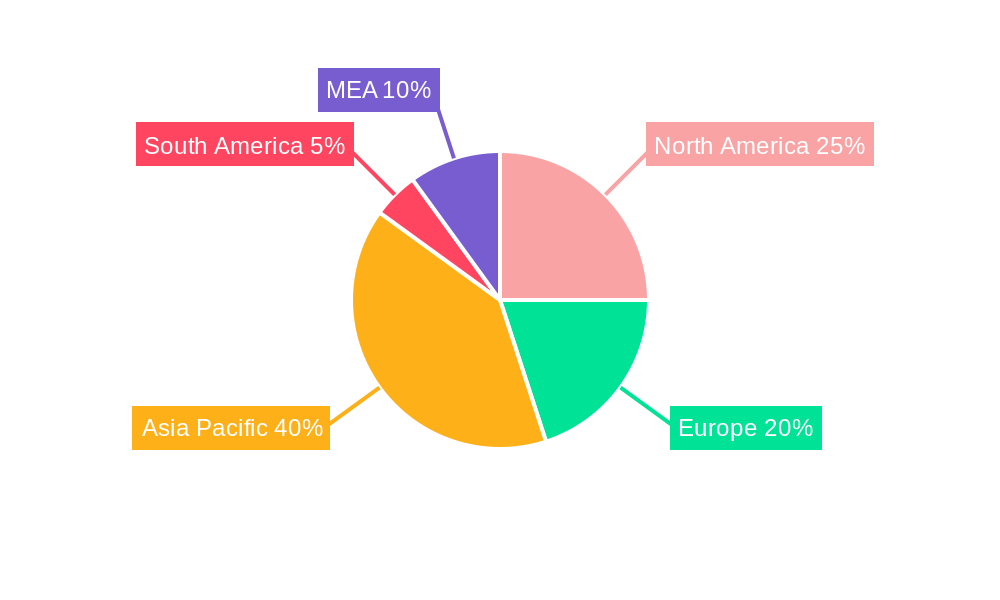
Dominant Region: Asia-Pacific is currently the dominant region, driven by significant investments in power infrastructure, increasing energy demand, and the presence of several key market players.
Dominant Segments:
- Component Type: Gas Engines or Gas Turbines currently hold the largest market share, due to their high efficiency and reliability. However, the Steam Turbines & Generators segment is anticipated to witness significant growth driven by advancements in efficiency.
- Vessel Type: Power Barges are favored for their ease of deployment and cost-effectiveness, leading to a significant market share. Power Ships, although more expensive, are seeing increasing adoption due to their larger capacity and enhanced functionalities.
Key Drivers (by region and segment):
- Asia-Pacific: Rapid economic growth, increasing energy demand, and supportive government policies.
- Europe: Focus on energy security and diversification, coupled with investment in renewable energy integration.
- Gas Engines or Gas Turbines: High efficiency, relatively low cost, and proven technology.
- Steam Turbines & Generators: Potential for enhanced efficiency through technological advancements and waste heat recovery.
- Power Barges: Cost-effectiveness, easy deployment, and suitability for various water depths.
- Power Ships: Higher capacity, greater flexibility, and advanced features like waste heat recovery systems.
Floating LNG Power Plant Market Product Innovations
Recent product innovations focus on enhancing efficiency, reducing emissions, and improving operational flexibility. This includes advancements in gas turbine technology, the integration of waste heat recovery systems, and the development of more compact and modular designs. These innovations aim to improve the overall cost-effectiveness and environmental sustainability of floating LNG power plants, increasing their appeal to a wider range of customers.
Report Scope & Segmentation Analysis
This report segments the Floating LNG Power Plant market by Component Type (Gas Engines or Gas Turbines, IC Engines, Steam Turbines & Generators) and Vessel Type (Power Ship, Power Barge). Each segment is analyzed in terms of its market size, growth projections, and competitive dynamics. The Gas Engines or Gas Turbines segment is projected to experience substantial growth, driven by technological advancements and cost-effectiveness. The Power Barge segment is expected to maintain a significant market share due to its cost-effectiveness and ease of deployment. The Steam Turbines & Generators segment is also expected to show growth, driven by opportunities in waste heat recovery systems.
Key Drivers of Floating LNG Power Plant Market Growth
The Floating LNG Power Plant market is experiencing rapid growth due to several key factors. Firstly, the increasing global demand for electricity, particularly in regions with limited grid infrastructure, is a major driver. Secondly, the rising adoption of LNG as a cleaner-burning fuel compared to other fossil fuels is contributing to market expansion. Finally, technological advancements leading to more efficient gas turbines and innovative vessel designs are also contributing to this growth.
Challenges in the Floating LNG Power Plant Market Sector
Despite significant growth potential, the Floating LNG Power Plant market faces several challenges. These include high initial investment costs, regulatory hurdles related to environmental compliance and safety, potential supply chain disruptions impacting the availability of components, and intense competition from other power generation technologies. Furthermore, fluctuating LNG prices introduce uncertainty and may affect project profitability. These factors contribute to a complex market environment and require careful risk assessment and mitigation strategies.
Emerging Opportunities in Floating LNG Power Plant Market
Several promising opportunities exist within the Floating LNG Power Plant market. The expansion into new and emerging markets with limited grid infrastructure presents considerable growth potential. Technological advancements leading to increased efficiency and reduced emissions offer opportunities for market differentiation and enhanced competitiveness. Growing consumer preference for cleaner and more sustainable energy solutions is creating additional market demand. These opportunities present considerable scope for growth and innovation within the industry.
Leading Players in the Floating LNG Power Plant Market Market
- Waller Marine Inc
- Wärtsilä Oyj Abp
- Chiyoda Corporation
- Wison Group
- Karadeniz Holding
- Siemens Energy AG
- Kawasaki Heavy Industries Ltd
Key Developments in Floating LNG Power Plant Market Industry
- January 2023: Finland's first FSRU-based LNG terminal in Inkoo commences commercial operations, demonstrating the growing adoption of floating LNG infrastructure. The 291m vessel holds approximately 68,000 tonnes of LNG, equivalent to 1,050 GWh of energy.
- October 2022: Karpowership negotiates with four European nations to supply 2 GW of floating LNG power plant capacity, highlighting the market's potential to address energy security concerns in Europe. The company's eight energy ships offer a total capacity of 2 GW, capable of powering approximately five million households and supporting district heating systems.
Future Outlook for Floating LNG Power Plant Market Market
The future outlook for the Floating LNG Power Plant market is positive, driven by several factors. Continued advancements in technology, increasing demand for flexible power solutions, and the global focus on energy security will underpin market growth. Strategic partnerships, expansion into new markets, and technological innovations will play a key role in shaping the market's future trajectory. The market is well-positioned for significant growth and presents numerous opportunities for existing and emerging players.
Floating LNG Power Plant Market Segmentation
-
1. Component Type
- 1.1. Gas Engines or Gas Turbines
- 1.2. IC Engines
- 1.3. Steam Turbines & Generators
-
2. Vessel Type
- 2.1. Power Ship
- 2.2. Power Barge
Floating LNG Power Plant Market Segmentation By Geography
-
1. North America
- 1.1. United States
- 1.2. Canada
- 1.3. Rest of North America
-
2. Europe
- 2.1. Germany
- 2.2. United Kingdom
- 2.3. France
- 2.4. Spain
- 2.5. Italy
- 2.6. Nordic Countries
- 2.7. Turkey
- 2.8. Russia
- 2.9. Rest of Europe
-
3. Asia Pacific
- 3.1. China
- 3.2. India
- 3.3. Japan
- 3.4. South Korea
- 3.5. Malaysis
- 3.6. Thailand
- 3.7. Indonesia
- 3.8. Vietnam
- 3.9. Rest of Asia Pacific
-
4. South America
- 4.1. Brazil
- 4.2. Argentina
- 4.3. Colombia
- 4.4. Rest of South America
- 5. Middle East
-
6. Saudi Arabia
- 6.1. United Arab Emirates
- 6.2. South Africa
- 6.3. Nigeria
- 6.4. Qatar
- 6.5. Egypt
- 6.6. Rest of Middle East
Floating LNG Power Plant Market REPORT HIGHLIGHTS
| Aspects | Details |
|---|---|
| Study Period | 2019-2033 |
| Base Year | 2024 |
| Estimated Year | 2025 |
| Forecast Period | 2025-2033 |
| Historical Period | 2019-2024 |
| Growth Rate | CAGR of 4.06% from 2019-2033 |
| Segmentation |
|
Table of Contents
- 1. Introduction
- 1.1. Research Scope
- 1.2. Market Segmentation
- 1.3. Research Methodology
- 1.4. Definitions and Assumptions
- 2. Executive Summary
- 2.1. Introduction
- 3. Market Dynamics
- 3.1. Introduction
- 3.2. Market Drivers
- 3.2.1. 4.; An Increase in the Use of LNG as an Energy Source
- 3.3. Market Restrains
- 3.3.1. 4.; Increasing Adoption of Solar and Wind Energy
- 3.4. Market Trends
- 3.4.1. Power Barge Segment Expected to Dominate the Market
- 4. Market Factor Analysis
- 4.1. Porters Five Forces
- 4.2. Supply/Value Chain
- 4.3. PESTEL analysis
- 4.4. Market Entropy
- 4.5. Patent/Trademark Analysis
- 5. Global Floating LNG Power Plant Market Analysis, Insights and Forecast, 2019-2031
- 5.1. Market Analysis, Insights and Forecast - by Component Type
- 5.1.1. Gas Engines or Gas Turbines
- 5.1.2. IC Engines
- 5.1.3. Steam Turbines & Generators
- 5.2. Market Analysis, Insights and Forecast - by Vessel Type
- 5.2.1. Power Ship
- 5.2.2. Power Barge
- 5.3. Market Analysis, Insights and Forecast - by Region
- 5.3.1. North America
- 5.3.2. Europe
- 5.3.3. Asia Pacific
- 5.3.4. South America
- 5.3.5. Middle East
- 5.3.6. Saudi Arabia
- 5.1. Market Analysis, Insights and Forecast - by Component Type
- 6. North America Floating LNG Power Plant Market Analysis, Insights and Forecast, 2019-2031
- 6.1. Market Analysis, Insights and Forecast - by Component Type
- 6.1.1. Gas Engines or Gas Turbines
- 6.1.2. IC Engines
- 6.1.3. Steam Turbines & Generators
- 6.2. Market Analysis, Insights and Forecast - by Vessel Type
- 6.2.1. Power Ship
- 6.2.2. Power Barge
- 6.1. Market Analysis, Insights and Forecast - by Component Type
- 7. Europe Floating LNG Power Plant Market Analysis, Insights and Forecast, 2019-2031
- 7.1. Market Analysis, Insights and Forecast - by Component Type
- 7.1.1. Gas Engines or Gas Turbines
- 7.1.2. IC Engines
- 7.1.3. Steam Turbines & Generators
- 7.2. Market Analysis, Insights and Forecast - by Vessel Type
- 7.2.1. Power Ship
- 7.2.2. Power Barge
- 7.1. Market Analysis, Insights and Forecast - by Component Type
- 8. Asia Pacific Floating LNG Power Plant Market Analysis, Insights and Forecast, 2019-2031
- 8.1. Market Analysis, Insights and Forecast - by Component Type
- 8.1.1. Gas Engines or Gas Turbines
- 8.1.2. IC Engines
- 8.1.3. Steam Turbines & Generators
- 8.2. Market Analysis, Insights and Forecast - by Vessel Type
- 8.2.1. Power Ship
- 8.2.2. Power Barge
- 8.1. Market Analysis, Insights and Forecast - by Component Type
- 9. South America Floating LNG Power Plant Market Analysis, Insights and Forecast, 2019-2031
- 9.1. Market Analysis, Insights and Forecast - by Component Type
- 9.1.1. Gas Engines or Gas Turbines
- 9.1.2. IC Engines
- 9.1.3. Steam Turbines & Generators
- 9.2. Market Analysis, Insights and Forecast - by Vessel Type
- 9.2.1. Power Ship
- 9.2.2. Power Barge
- 9.1. Market Analysis, Insights and Forecast - by Component Type
- 10. Middle East Floating LNG Power Plant Market Analysis, Insights and Forecast, 2019-2031
- 10.1. Market Analysis, Insights and Forecast - by Component Type
- 10.1.1. Gas Engines or Gas Turbines
- 10.1.2. IC Engines
- 10.1.3. Steam Turbines & Generators
- 10.2. Market Analysis, Insights and Forecast - by Vessel Type
- 10.2.1. Power Ship
- 10.2.2. Power Barge
- 10.1. Market Analysis, Insights and Forecast - by Component Type
- 11. Saudi Arabia Floating LNG Power Plant Market Analysis, Insights and Forecast, 2019-2031
- 11.1. Market Analysis, Insights and Forecast - by Component Type
- 11.1.1. Gas Engines or Gas Turbines
- 11.1.2. IC Engines
- 11.1.3. Steam Turbines & Generators
- 11.2. Market Analysis, Insights and Forecast - by Vessel Type
- 11.2.1. Power Ship
- 11.2.2. Power Barge
- 11.1. Market Analysis, Insights and Forecast - by Component Type
- 12. North America Floating LNG Power Plant Market Analysis, Insights and Forecast, 2019-2031
- 12.1. Market Analysis, Insights and Forecast - By Country/Sub-region
- 12.1.1 United States
- 12.1.2 Canada
- 12.1.3 Mexico
- 13. Europe Floating LNG Power Plant Market Analysis, Insights and Forecast, 2019-2031
- 13.1. Market Analysis, Insights and Forecast - By Country/Sub-region
- 13.1.1 Germany
- 13.1.2 United Kingdom
- 13.1.3 France
- 13.1.4 Spain
- 13.1.5 Italy
- 13.1.6 Spain
- 13.1.7 Belgium
- 13.1.8 Netherland
- 13.1.9 Nordics
- 13.1.10 Rest of Europe
- 14. Asia Pacific Floating LNG Power Plant Market Analysis, Insights and Forecast, 2019-2031
- 14.1. Market Analysis, Insights and Forecast - By Country/Sub-region
- 14.1.1 China
- 14.1.2 Japan
- 14.1.3 India
- 14.1.4 South Korea
- 14.1.5 Southeast Asia
- 14.1.6 Australia
- 14.1.7 Indonesia
- 14.1.8 Phillipes
- 14.1.9 Singapore
- 14.1.10 Thailandc
- 14.1.11 Rest of Asia Pacific
- 15. South America Floating LNG Power Plant Market Analysis, Insights and Forecast, 2019-2031
- 15.1. Market Analysis, Insights and Forecast - By Country/Sub-region
- 15.1.1 Brazil
- 15.1.2 Argentina
- 15.1.3 Peru
- 15.1.4 Chile
- 15.1.5 Colombia
- 15.1.6 Ecuador
- 15.1.7 Venezuela
- 15.1.8 Rest of South America
- 16. MEA Floating LNG Power Plant Market Analysis, Insights and Forecast, 2019-2031
- 16.1. Market Analysis, Insights and Forecast - By Country/Sub-region
- 16.1.1 United Arab Emirates
- 16.1.2 Saudi Arabia
- 16.1.3 South Africa
- 16.1.4 Rest of Middle East and Africa
- 17. Competitive Analysis
- 17.1. Global Market Share Analysis 2024
- 17.2. Company Profiles
- 17.2.1 Waller Marine Inc
- 17.2.1.1. Overview
- 17.2.1.2. Products
- 17.2.1.3. SWOT Analysis
- 17.2.1.4. Recent Developments
- 17.2.1.5. Financials (Based on Availability)
- 17.2.2 Wartsila Oyj Abp
- 17.2.2.1. Overview
- 17.2.2.2. Products
- 17.2.2.3. SWOT Analysis
- 17.2.2.4. Recent Developments
- 17.2.2.5. Financials (Based on Availability)
- 17.2.3 Chiyoda Corporation
- 17.2.3.1. Overview
- 17.2.3.2. Products
- 17.2.3.3. SWOT Analysis
- 17.2.3.4. Recent Developments
- 17.2.3.5. Financials (Based on Availability)
- 17.2.4 Wison Group
- 17.2.4.1. Overview
- 17.2.4.2. Products
- 17.2.4.3. SWOT Analysis
- 17.2.4.4. Recent Developments
- 17.2.4.5. Financials (Based on Availability)
- 17.2.5 Karadeniz Holding
- 17.2.5.1. Overview
- 17.2.5.2. Products
- 17.2.5.3. SWOT Analysis
- 17.2.5.4. Recent Developments
- 17.2.5.5. Financials (Based on Availability)
- 17.2.6 Siemens Energy AG
- 17.2.6.1. Overview
- 17.2.6.2. Products
- 17.2.6.3. SWOT Analysis
- 17.2.6.4. Recent Developments
- 17.2.6.5. Financials (Based on Availability)
- 17.2.7 Kawasaki Heavy Industries Ltd
- 17.2.7.1. Overview
- 17.2.7.2. Products
- 17.2.7.3. SWOT Analysis
- 17.2.7.4. Recent Developments
- 17.2.7.5. Financials (Based on Availability)
- 17.2.1 Waller Marine Inc
List of Figures
- Figure 1: Global Floating LNG Power Plant Market Revenue Breakdown (Million, %) by Region 2024 & 2032
- Figure 2: North America Floating LNG Power Plant Market Revenue (Million), by Country 2024 & 2032
- Figure 3: North America Floating LNG Power Plant Market Revenue Share (%), by Country 2024 & 2032
- Figure 4: Europe Floating LNG Power Plant Market Revenue (Million), by Country 2024 & 2032
- Figure 5: Europe Floating LNG Power Plant Market Revenue Share (%), by Country 2024 & 2032
- Figure 6: Asia Pacific Floating LNG Power Plant Market Revenue (Million), by Country 2024 & 2032
- Figure 7: Asia Pacific Floating LNG Power Plant Market Revenue Share (%), by Country 2024 & 2032
- Figure 8: South America Floating LNG Power Plant Market Revenue (Million), by Country 2024 & 2032
- Figure 9: South America Floating LNG Power Plant Market Revenue Share (%), by Country 2024 & 2032
- Figure 10: MEA Floating LNG Power Plant Market Revenue (Million), by Country 2024 & 2032
- Figure 11: MEA Floating LNG Power Plant Market Revenue Share (%), by Country 2024 & 2032
- Figure 12: North America Floating LNG Power Plant Market Revenue (Million), by Component Type 2024 & 2032
- Figure 13: North America Floating LNG Power Plant Market Revenue Share (%), by Component Type 2024 & 2032
- Figure 14: North America Floating LNG Power Plant Market Revenue (Million), by Vessel Type 2024 & 2032
- Figure 15: North America Floating LNG Power Plant Market Revenue Share (%), by Vessel Type 2024 & 2032
- Figure 16: North America Floating LNG Power Plant Market Revenue (Million), by Country 2024 & 2032
- Figure 17: North America Floating LNG Power Plant Market Revenue Share (%), by Country 2024 & 2032
- Figure 18: Europe Floating LNG Power Plant Market Revenue (Million), by Component Type 2024 & 2032
- Figure 19: Europe Floating LNG Power Plant Market Revenue Share (%), by Component Type 2024 & 2032
- Figure 20: Europe Floating LNG Power Plant Market Revenue (Million), by Vessel Type 2024 & 2032
- Figure 21: Europe Floating LNG Power Plant Market Revenue Share (%), by Vessel Type 2024 & 2032
- Figure 22: Europe Floating LNG Power Plant Market Revenue (Million), by Country 2024 & 2032
- Figure 23: Europe Floating LNG Power Plant Market Revenue Share (%), by Country 2024 & 2032
- Figure 24: Asia Pacific Floating LNG Power Plant Market Revenue (Million), by Component Type 2024 & 2032
- Figure 25: Asia Pacific Floating LNG Power Plant Market Revenue Share (%), by Component Type 2024 & 2032
- Figure 26: Asia Pacific Floating LNG Power Plant Market Revenue (Million), by Vessel Type 2024 & 2032
- Figure 27: Asia Pacific Floating LNG Power Plant Market Revenue Share (%), by Vessel Type 2024 & 2032
- Figure 28: Asia Pacific Floating LNG Power Plant Market Revenue (Million), by Country 2024 & 2032
- Figure 29: Asia Pacific Floating LNG Power Plant Market Revenue Share (%), by Country 2024 & 2032
- Figure 30: South America Floating LNG Power Plant Market Revenue (Million), by Component Type 2024 & 2032
- Figure 31: South America Floating LNG Power Plant Market Revenue Share (%), by Component Type 2024 & 2032
- Figure 32: South America Floating LNG Power Plant Market Revenue (Million), by Vessel Type 2024 & 2032
- Figure 33: South America Floating LNG Power Plant Market Revenue Share (%), by Vessel Type 2024 & 2032
- Figure 34: South America Floating LNG Power Plant Market Revenue (Million), by Country 2024 & 2032
- Figure 35: South America Floating LNG Power Plant Market Revenue Share (%), by Country 2024 & 2032
- Figure 36: Middle East Floating LNG Power Plant Market Revenue (Million), by Component Type 2024 & 2032
- Figure 37: Middle East Floating LNG Power Plant Market Revenue Share (%), by Component Type 2024 & 2032
- Figure 38: Middle East Floating LNG Power Plant Market Revenue (Million), by Vessel Type 2024 & 2032
- Figure 39: Middle East Floating LNG Power Plant Market Revenue Share (%), by Vessel Type 2024 & 2032
- Figure 40: Middle East Floating LNG Power Plant Market Revenue (Million), by Country 2024 & 2032
- Figure 41: Middle East Floating LNG Power Plant Market Revenue Share (%), by Country 2024 & 2032
- Figure 42: Saudi Arabia Floating LNG Power Plant Market Revenue (Million), by Component Type 2024 & 2032
- Figure 43: Saudi Arabia Floating LNG Power Plant Market Revenue Share (%), by Component Type 2024 & 2032
- Figure 44: Saudi Arabia Floating LNG Power Plant Market Revenue (Million), by Vessel Type 2024 & 2032
- Figure 45: Saudi Arabia Floating LNG Power Plant Market Revenue Share (%), by Vessel Type 2024 & 2032
- Figure 46: Saudi Arabia Floating LNG Power Plant Market Revenue (Million), by Country 2024 & 2032
- Figure 47: Saudi Arabia Floating LNG Power Plant Market Revenue Share (%), by Country 2024 & 2032
List of Tables
- Table 1: Global Floating LNG Power Plant Market Revenue Million Forecast, by Region 2019 & 2032
- Table 2: Global Floating LNG Power Plant Market Revenue Million Forecast, by Component Type 2019 & 2032
- Table 3: Global Floating LNG Power Plant Market Revenue Million Forecast, by Vessel Type 2019 & 2032
- Table 4: Global Floating LNG Power Plant Market Revenue Million Forecast, by Region 2019 & 2032
- Table 5: Global Floating LNG Power Plant Market Revenue Million Forecast, by Country 2019 & 2032
- Table 6: United States Floating LNG Power Plant Market Revenue (Million) Forecast, by Application 2019 & 2032
- Table 7: Canada Floating LNG Power Plant Market Revenue (Million) Forecast, by Application 2019 & 2032
- Table 8: Mexico Floating LNG Power Plant Market Revenue (Million) Forecast, by Application 2019 & 2032
- Table 9: Global Floating LNG Power Plant Market Revenue Million Forecast, by Country 2019 & 2032
- Table 10: Germany Floating LNG Power Plant Market Revenue (Million) Forecast, by Application 2019 & 2032
- Table 11: United Kingdom Floating LNG Power Plant Market Revenue (Million) Forecast, by Application 2019 & 2032
- Table 12: France Floating LNG Power Plant Market Revenue (Million) Forecast, by Application 2019 & 2032
- Table 13: Spain Floating LNG Power Plant Market Revenue (Million) Forecast, by Application 2019 & 2032
- Table 14: Italy Floating LNG Power Plant Market Revenue (Million) Forecast, by Application 2019 & 2032
- Table 15: Spain Floating LNG Power Plant Market Revenue (Million) Forecast, by Application 2019 & 2032
- Table 16: Belgium Floating LNG Power Plant Market Revenue (Million) Forecast, by Application 2019 & 2032
- Table 17: Netherland Floating LNG Power Plant Market Revenue (Million) Forecast, by Application 2019 & 2032
- Table 18: Nordics Floating LNG Power Plant Market Revenue (Million) Forecast, by Application 2019 & 2032
- Table 19: Rest of Europe Floating LNG Power Plant Market Revenue (Million) Forecast, by Application 2019 & 2032
- Table 20: Global Floating LNG Power Plant Market Revenue Million Forecast, by Country 2019 & 2032
- Table 21: China Floating LNG Power Plant Market Revenue (Million) Forecast, by Application 2019 & 2032
- Table 22: Japan Floating LNG Power Plant Market Revenue (Million) Forecast, by Application 2019 & 2032
- Table 23: India Floating LNG Power Plant Market Revenue (Million) Forecast, by Application 2019 & 2032
- Table 24: South Korea Floating LNG Power Plant Market Revenue (Million) Forecast, by Application 2019 & 2032
- Table 25: Southeast Asia Floating LNG Power Plant Market Revenue (Million) Forecast, by Application 2019 & 2032
- Table 26: Australia Floating LNG Power Plant Market Revenue (Million) Forecast, by Application 2019 & 2032
- Table 27: Indonesia Floating LNG Power Plant Market Revenue (Million) Forecast, by Application 2019 & 2032
- Table 28: Phillipes Floating LNG Power Plant Market Revenue (Million) Forecast, by Application 2019 & 2032
- Table 29: Singapore Floating LNG Power Plant Market Revenue (Million) Forecast, by Application 2019 & 2032
- Table 30: Thailandc Floating LNG Power Plant Market Revenue (Million) Forecast, by Application 2019 & 2032
- Table 31: Rest of Asia Pacific Floating LNG Power Plant Market Revenue (Million) Forecast, by Application 2019 & 2032
- Table 32: Global Floating LNG Power Plant Market Revenue Million Forecast, by Country 2019 & 2032
- Table 33: Brazil Floating LNG Power Plant Market Revenue (Million) Forecast, by Application 2019 & 2032
- Table 34: Argentina Floating LNG Power Plant Market Revenue (Million) Forecast, by Application 2019 & 2032
- Table 35: Peru Floating LNG Power Plant Market Revenue (Million) Forecast, by Application 2019 & 2032
- Table 36: Chile Floating LNG Power Plant Market Revenue (Million) Forecast, by Application 2019 & 2032
- Table 37: Colombia Floating LNG Power Plant Market Revenue (Million) Forecast, by Application 2019 & 2032
- Table 38: Ecuador Floating LNG Power Plant Market Revenue (Million) Forecast, by Application 2019 & 2032
- Table 39: Venezuela Floating LNG Power Plant Market Revenue (Million) Forecast, by Application 2019 & 2032
- Table 40: Rest of South America Floating LNG Power Plant Market Revenue (Million) Forecast, by Application 2019 & 2032
- Table 41: Global Floating LNG Power Plant Market Revenue Million Forecast, by Country 2019 & 2032
- Table 42: United Arab Emirates Floating LNG Power Plant Market Revenue (Million) Forecast, by Application 2019 & 2032
- Table 43: Saudi Arabia Floating LNG Power Plant Market Revenue (Million) Forecast, by Application 2019 & 2032
- Table 44: South Africa Floating LNG Power Plant Market Revenue (Million) Forecast, by Application 2019 & 2032
- Table 45: Rest of Middle East and Africa Floating LNG Power Plant Market Revenue (Million) Forecast, by Application 2019 & 2032
- Table 46: Global Floating LNG Power Plant Market Revenue Million Forecast, by Component Type 2019 & 2032
- Table 47: Global Floating LNG Power Plant Market Revenue Million Forecast, by Vessel Type 2019 & 2032
- Table 48: Global Floating LNG Power Plant Market Revenue Million Forecast, by Country 2019 & 2032
- Table 49: United States Floating LNG Power Plant Market Revenue (Million) Forecast, by Application 2019 & 2032
- Table 50: Canada Floating LNG Power Plant Market Revenue (Million) Forecast, by Application 2019 & 2032
- Table 51: Rest of North America Floating LNG Power Plant Market Revenue (Million) Forecast, by Application 2019 & 2032
- Table 52: Global Floating LNG Power Plant Market Revenue Million Forecast, by Component Type 2019 & 2032
- Table 53: Global Floating LNG Power Plant Market Revenue Million Forecast, by Vessel Type 2019 & 2032
- Table 54: Global Floating LNG Power Plant Market Revenue Million Forecast, by Country 2019 & 2032
- Table 55: Germany Floating LNG Power Plant Market Revenue (Million) Forecast, by Application 2019 & 2032
- Table 56: United Kingdom Floating LNG Power Plant Market Revenue (Million) Forecast, by Application 2019 & 2032
- Table 57: France Floating LNG Power Plant Market Revenue (Million) Forecast, by Application 2019 & 2032
- Table 58: Spain Floating LNG Power Plant Market Revenue (Million) Forecast, by Application 2019 & 2032
- Table 59: Italy Floating LNG Power Plant Market Revenue (Million) Forecast, by Application 2019 & 2032
- Table 60: Nordic Countries Floating LNG Power Plant Market Revenue (Million) Forecast, by Application 2019 & 2032
- Table 61: Turkey Floating LNG Power Plant Market Revenue (Million) Forecast, by Application 2019 & 2032
- Table 62: Russia Floating LNG Power Plant Market Revenue (Million) Forecast, by Application 2019 & 2032
- Table 63: Rest of Europe Floating LNG Power Plant Market Revenue (Million) Forecast, by Application 2019 & 2032
- Table 64: Global Floating LNG Power Plant Market Revenue Million Forecast, by Component Type 2019 & 2032
- Table 65: Global Floating LNG Power Plant Market Revenue Million Forecast, by Vessel Type 2019 & 2032
- Table 66: Global Floating LNG Power Plant Market Revenue Million Forecast, by Country 2019 & 2032
- Table 67: China Floating LNG Power Plant Market Revenue (Million) Forecast, by Application 2019 & 2032
- Table 68: India Floating LNG Power Plant Market Revenue (Million) Forecast, by Application 2019 & 2032
- Table 69: Japan Floating LNG Power Plant Market Revenue (Million) Forecast, by Application 2019 & 2032
- Table 70: South Korea Floating LNG Power Plant Market Revenue (Million) Forecast, by Application 2019 & 2032
- Table 71: Malaysis Floating LNG Power Plant Market Revenue (Million) Forecast, by Application 2019 & 2032
- Table 72: Thailand Floating LNG Power Plant Market Revenue (Million) Forecast, by Application 2019 & 2032
- Table 73: Indonesia Floating LNG Power Plant Market Revenue (Million) Forecast, by Application 2019 & 2032
- Table 74: Vietnam Floating LNG Power Plant Market Revenue (Million) Forecast, by Application 2019 & 2032
- Table 75: Rest of Asia Pacific Floating LNG Power Plant Market Revenue (Million) Forecast, by Application 2019 & 2032
- Table 76: Global Floating LNG Power Plant Market Revenue Million Forecast, by Component Type 2019 & 2032
- Table 77: Global Floating LNG Power Plant Market Revenue Million Forecast, by Vessel Type 2019 & 2032
- Table 78: Global Floating LNG Power Plant Market Revenue Million Forecast, by Country 2019 & 2032
- Table 79: Brazil Floating LNG Power Plant Market Revenue (Million) Forecast, by Application 2019 & 2032
- Table 80: Argentina Floating LNG Power Plant Market Revenue (Million) Forecast, by Application 2019 & 2032
- Table 81: Colombia Floating LNG Power Plant Market Revenue (Million) Forecast, by Application 2019 & 2032
- Table 82: Rest of South America Floating LNG Power Plant Market Revenue (Million) Forecast, by Application 2019 & 2032
- Table 83: Global Floating LNG Power Plant Market Revenue Million Forecast, by Component Type 2019 & 2032
- Table 84: Global Floating LNG Power Plant Market Revenue Million Forecast, by Vessel Type 2019 & 2032
- Table 85: Global Floating LNG Power Plant Market Revenue Million Forecast, by Country 2019 & 2032
- Table 86: Global Floating LNG Power Plant Market Revenue Million Forecast, by Component Type 2019 & 2032
- Table 87: Global Floating LNG Power Plant Market Revenue Million Forecast, by Vessel Type 2019 & 2032
- Table 88: Global Floating LNG Power Plant Market Revenue Million Forecast, by Country 2019 & 2032
- Table 89: United Arab Emirates Floating LNG Power Plant Market Revenue (Million) Forecast, by Application 2019 & 2032
- Table 90: South Africa Floating LNG Power Plant Market Revenue (Million) Forecast, by Application 2019 & 2032
- Table 91: Nigeria Floating LNG Power Plant Market Revenue (Million) Forecast, by Application 2019 & 2032
- Table 92: Qatar Floating LNG Power Plant Market Revenue (Million) Forecast, by Application 2019 & 2032
- Table 93: Egypt Floating LNG Power Plant Market Revenue (Million) Forecast, by Application 2019 & 2032
- Table 94: Rest of Middle East Floating LNG Power Plant Market Revenue (Million) Forecast, by Application 2019 & 2032
Frequently Asked Questions
1. What is the projected Compound Annual Growth Rate (CAGR) of the Floating LNG Power Plant Market?
The projected CAGR is approximately 4.06%.
2. Which companies are prominent players in the Floating LNG Power Plant Market?
Key companies in the market include Waller Marine Inc, Wartsila Oyj Abp, Chiyoda Corporation, Wison Group, Karadeniz Holding, Siemens Energy AG, Kawasaki Heavy Industries Ltd.
3. What are the main segments of the Floating LNG Power Plant Market?
The market segments include Component Type, Vessel Type.
4. Can you provide details about the market size?
The market size is estimated to be USD 604.04 Million as of 2022.
5. What are some drivers contributing to market growth?
4.; An Increase in the Use of LNG as an Energy Source.
6. What are the notable trends driving market growth?
Power Barge Segment Expected to Dominate the Market.
7. Are there any restraints impacting market growth?
4.; Increasing Adoption of Solar and Wind Energy.
8. Can you provide examples of recent developments in the market?
January 2023: with the integration of the LNG floating storage and regasification unit (FSRU) Model into GasgridFinland's gas transmission network, Finland's first FSRU-based terminal, located in the deep harbor at Inkoo, is ready for commercial operations. The LNG floating terminal vessel is 291 m long and, when fully loaded, holds around 68,000 tonnes of liquefied natural gas (LNG), corresponding to about 1,050 GWh of energy.
9. What pricing options are available for accessing the report?
Pricing options include single-user, multi-user, and enterprise licenses priced at USD 4750, USD 5250, and USD 8750 respectively.
10. Is the market size provided in terms of value or volume?
The market size is provided in terms of value, measured in Million.
11. Are there any specific market keywords associated with the report?
Yes, the market keyword associated with the report is "Floating LNG Power Plant Market," which aids in identifying and referencing the specific market segment covered.
12. How do I determine which pricing option suits my needs best?
The pricing options vary based on user requirements and access needs. Individual users may opt for single-user licenses, while businesses requiring broader access may choose multi-user or enterprise licenses for cost-effective access to the report.
13. Are there any additional resources or data provided in the Floating LNG Power Plant Market report?
While the report offers comprehensive insights, it's advisable to review the specific contents or supplementary materials provided to ascertain if additional resources or data are available.
14. How can I stay updated on further developments or reports in the Floating LNG Power Plant Market?
To stay informed about further developments, trends, and reports in the Floating LNG Power Plant Market, consider subscribing to industry newsletters, following relevant companies and organizations, or regularly checking reputable industry news sources and publications.
Methodology
Step 1 - Identification of Relevant Samples Size from Population Database


Step 2 - Approaches for Defining Global Market Size (Value, Volume* & Price*)

Note*: In applicable scenarios
Step 3 - Data Sources
Primary Research
- Web Analytics
- Survey Reports
- Research Institute
- Latest Research Reports
- Opinion Leaders
Secondary Research
- Annual Reports
- White Paper
- Latest Press Release
- Industry Association
- Paid Database
- Investor Presentations

Step 4 - Data Triangulation
Involves using different sources of information in order to increase the validity of a study
These sources are likely to be stakeholders in a program - participants, other researchers, program staff, other community members, and so on.
Then we put all data in single framework & apply various statistical tools to find out the dynamic on the market.
During the analysis stage, feedback from the stakeholder groups would be compared to determine areas of agreement as well as areas of divergence


