
Key Insights
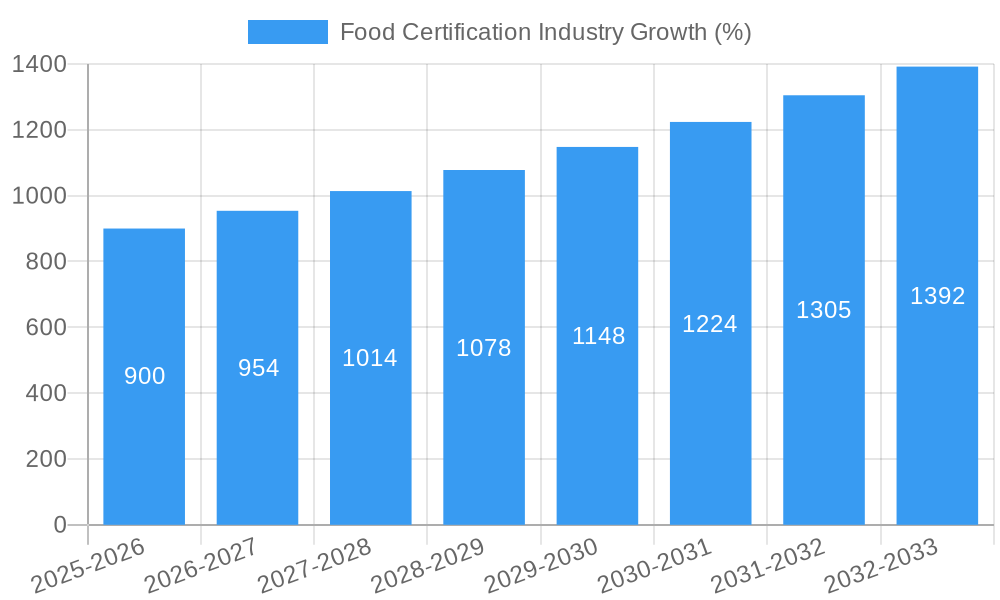
The global food certification market is experiencing robust growth, driven by increasing consumer demand for safe and ethically sourced food products. A compound annual growth rate (CAGR) of 5.90% from 2019 to 2024 indicates a significant upward trajectory. This expansion is fueled by several key factors. Stringent government regulations regarding food safety and quality are pushing businesses to obtain certifications like ISO 22000, BRCGS, and Halal, demonstrating compliance and building consumer trust. The rising prevalence of foodborne illnesses and increased awareness of food safety concerns further bolster the demand for third-party certifications. Growing e-commerce and globalized food supply chains necessitate robust verification processes to ensure traceability and quality throughout the entire production and distribution chain. Furthermore, the burgeoning demand for organic, sustainable, and ethically produced food products is creating new opportunities within the market, with certifications reflecting these attributes becoming increasingly sought after. Segmentation reveals strong growth across various end-user industries including meat, poultry, seafood, dairy, and infant food, reflecting the broad applicability of food safety and quality certifications across the food value chain.
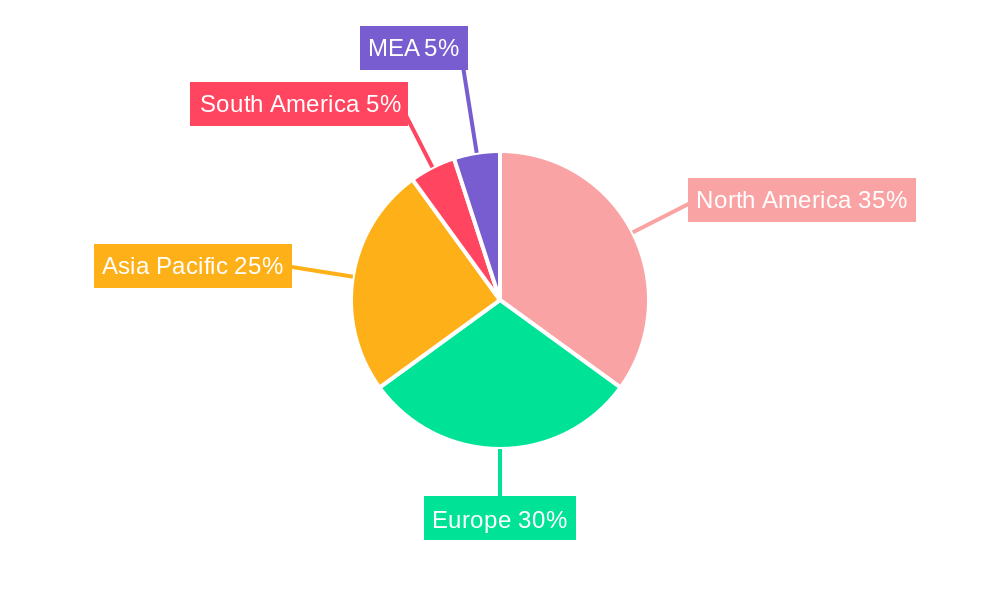
The market’s competitive landscape comprises major players such as Intertek, SGS, Bureau Veritas, and TÜV SÜD, along with several regional and specialized certification bodies. These companies are constantly adapting to evolving consumer preferences and regulatory changes, offering a diverse range of services beyond core food safety certifications. This includes certifications covering aspects like sustainable sourcing, fair trade practices, and environmental impact. Future growth will be influenced by technological advancements, particularly in blockchain technology for enhanced traceability and digitalization of certification processes, and the continued expansion of emerging markets, particularly in Asia-Pacific, where increasing disposable incomes and growing awareness of food safety are driving demand. The North American and European markets currently hold significant shares, but the Asia-Pacific region is poised for substantial growth in the coming years. The market's future hinges on continued consumer emphasis on food safety, evolving regulations, and the ability of certification bodies to adapt and innovate their offerings.
Food Certification Industry Market Report: 2019-2033
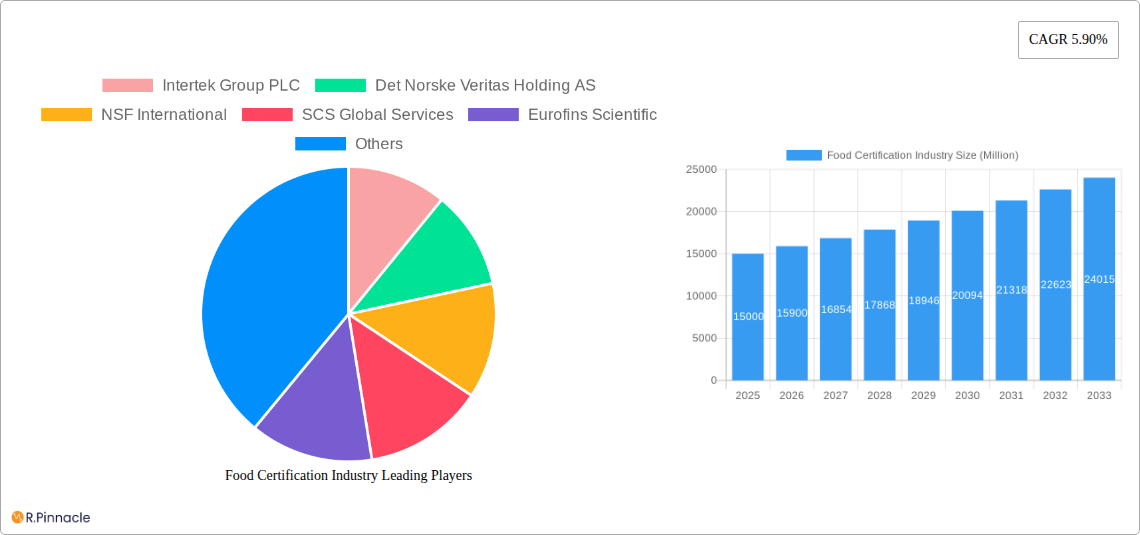
This comprehensive report provides an in-depth analysis of the global Food Certification Industry, projecting a market value exceeding $XX Million by 2033. The report covers the period 2019-2033, with a base year of 2025 and a forecast period of 2025-2033. It offers actionable insights for industry professionals, investors, and stakeholders seeking to navigate this dynamic market. Key players analyzed include Intertek Group PLC, Det Norske Veritas Holding AS, NSF International, SCS Global Services, Eurofins Scientific, Compagnie Merieux Alliance SAS (Merieux Nutrisciences), SGS Group, AsureQuality Limited, Bureau Veritas, and TÜV SÜD AG.
Food Certification Industry Market Structure & Innovation Trends
The Food Certification Industry exhibits a moderately concentrated market structure, with a few major players holding significant market share. Intertek, SGS, and Eurofins collectively account for approximately XX% of the global market in 2025. However, numerous smaller, specialized firms also contribute significantly, especially in niche certification areas. The industry is driven by increasing consumer demand for safe, high-quality, and ethically sourced food products, stringent regulatory frameworks (e.g., FSMA in the US, EU food safety regulations), and growing awareness of foodborne illnesses. Innovation is fueled by advancements in testing technologies, blockchain implementation for enhanced traceability, and the emergence of new certification standards addressing specific consumer needs (e.g., vegan, plant-based, organic).
- Market Share (2025 Estimate): Intertek: XX%; SGS: XX%; Eurofins: XX%; Others: XX%
- M&A Activity (2019-2024): XX deals with a total value exceeding $XX Million. Consolidation is expected to continue, driven by economies of scale and expansion into new geographic markets.
- Regulatory Frameworks: Stringent global regulations and standards are major drivers, mandating food safety certifications for many products and impacting market growth.
- Product Substitutes: While direct substitutes are limited, the industry faces indirect competition from companies offering alternative methods of ensuring food quality and safety.
Food Certification Industry Market Dynamics & Trends
The Food Certification Industry is experiencing robust growth, with a projected CAGR of XX% during the forecast period (2025-2033). Key growth drivers include rising disposable incomes in developing economies, increasing health consciousness among consumers, escalating demand for organic and ethically produced foods, and the proliferation of e-commerce platforms, leading to increased demand for food safety certifications. Technological disruptions such as AI-powered testing and blockchain-based traceability are transforming the industry, enhancing efficiency and transparency. Consumer preferences are shifting towards sustainable and transparent food systems, creating demand for certifications that address these concerns. Competitive dynamics are characterized by both collaboration and competition, with larger players engaging in strategic alliances while smaller firms focus on niche segments. Market penetration of various certification types varies greatly with ISO 22000 having the largest market share followed by BRCGS.
Dominant Regions & Segments in Food Certification Industry
The North American and European regions currently dominate the Food Certification Industry, driven by stringent regulatory environments, high consumer awareness, and established food safety infrastructures. However, developing economies in Asia-Pacific are experiencing rapid growth, driven by increasing disposable incomes and improving infrastructure.
Dominant End-user Industries:
- Meat, Poultry, and Seafood Products: This segment is the largest due to the inherent risks associated with foodborne illnesses in these products and strict government regulations.
- Dairy Products: High consumer demand for safe and high-quality dairy products drives the growth of this segment.
Dominant Certification Types:
- ISO 22000 - Food Safety Management System: This widely adopted standard ensures consistent food safety practices throughout the supply chain.
- BRCGS: The high standards of the BRCGS certification make it a highly sought-after choice for many food manufacturers.
Key Drivers:
- Stringent Regulations: Governments worldwide are implementing stricter food safety regulations, driving demand for certification.
- Consumer Demand: Increased consumer awareness of food safety and ethical sourcing is a major factor.
- Economic Growth: Rising disposable incomes in developing economies fuel increased demand for certified food products.
Food Certification Industry Product Innovations
Recent innovations include the development of specialized certifications for vegan and plant-based products, as demonstrated by Intertek's new vegan certification mark, and SGS's Food Contact Product Certification Mark addressing compliance and safety. These innovations respond to evolving consumer preferences and market demands for greater transparency and traceability. The adoption of blockchain technology enables real-time tracking of food products from farm to table, enhancing consumer trust and reducing the risk of fraud.
Report Scope & Segmentation Analysis
This report segments the Food Certification Industry by end-user industry (Meat, Poultry, and Seafood Products; Dairy Products; Infant Food; Beverages; Bakery and Confectionery Products; Other End-user Industries) and certification type (ISO 22000, BRCGS, Halal Certification, GMP+/FSA, Other Certifications). Each segment’s growth projection, market size, and competitive dynamics are detailed within the full report. For example, the Meat, Poultry, and Seafood Products segment is expected to demonstrate strong growth due to high consumer demand and stringent regulations. Similarly, ISO 22000 certification dominates due to its widespread adoption and international recognition.
Key Drivers of Food Certification Industry Growth
The Food Certification Industry's growth is primarily driven by increasing consumer awareness of food safety and quality, stricter government regulations, the rise of e-commerce and the need for greater transparency, and technological advancements in testing and traceability. The expanding middle class in developing countries further fuels demand for certified food products.
Challenges in the Food Certification Industry Sector
Challenges include the high cost of certification, which can be a barrier for smaller businesses; maintaining consistency and credibility across different certification bodies; and navigating complex and evolving regulatory landscapes. Supply chain disruptions can also impact the efficiency and cost-effectiveness of certification processes. Competition from lower-cost providers presents a persistent challenge.
Emerging Opportunities in Food Certification Industry
Emerging opportunities include the expansion into new markets, particularly in developing economies; the development of certifications for novel food products and sustainable practices; and the integration of blockchain technology to improve traceability and transparency. Certifications addressing specific dietary needs (e.g., allergen-free, gluten-free) are also showing strong growth potential.
Leading Players in the Food Certification Industry Market
- Intertek Group PLC
- Det Norske Veritas Holding AS
- NSF International
- SCS Global Services
- Eurofins Scientific
- Compagnie Merieux Alliance SAS (Merieux Nutrisciences)
- SGS Group
- AsureQuality Limited
- Bureau Veritas
- TÜV SÜD AG
Key Developments in Food Certification Industry
- November 2022: SCS Global Services launched its plant-based certification program, expanding its offerings into the growing plant-based market.
- November 2022: SGS SA introduced the SGS Food Contact Product Certification Mark, enhancing product safety and consumer trust.
- September 2022: Intertek Group PLC introduced a new vegan food certification mark, catering to the rising demand for vegan products.
Future Outlook for Food Certification Industry Market
The Food Certification Industry is poised for continued growth, driven by increasing consumer demand for safe, sustainable, and ethically sourced food products. Technological advancements, expanding regulations, and a growing global middle class will all contribute to market expansion. Strategic opportunities exist for companies that can effectively leverage technology, build strong brand trust, and adapt to evolving consumer preferences.
Food Certification Industry Segmentation
-
1. End-user Industry
- 1.1. Meat, Poultry, and Seafood Products
- 1.2. Dairy Products
- 1.3. Infant Food
- 1.4. Beverages
- 1.5. Bakery and Confectionery Products
- 1.6. Other End-user Industries
-
2. Type
- 2.1. ISO 22000 - Food Safety Management System
- 2.2. BRCGS
- 2.3. Halal Certification
- 2.4. GMP+/FSA
- 2.5. Other Certifications
Food Certification Industry Segmentation By Geography
-
1. North America
- 1.1. United States
- 1.2. Canada
- 1.3. Mexico
- 1.4. Rest of North America
-
2. Europe
- 2.1. United Kingdom
- 2.2. Germany
- 2.3. France
- 2.4. Russia
- 2.5. Italy
- 2.6. Spain
- 2.7. Rest of Europe
-
3. Asia Pacific
- 3.1. India
- 3.2. China
- 3.3. Japan
- 3.4. Australia
- 3.5. Rest of Asia Pacific
-
4. South America
- 4.1. Brazil
- 4.2. Argentina
- 4.3. Rest of South America
- 5. Middle East
-
6. South Africa
- 6.1. Saudi Arabia
- 6.2. Rest of Middle East
Food Certification Industry REPORT HIGHLIGHTS
| Aspects | Details |
|---|---|
| Study Period | 2019-2033 |
| Base Year | 2024 |
| Estimated Year | 2025 |
| Forecast Period | 2025-2033 |
| Historical Period | 2019-2024 |
| Growth Rate | CAGR of 5.90% from 2019-2033 |
| Segmentation |
|
Table of Contents
- 1. Introduction
- 1.1. Research Scope
- 1.2. Market Segmentation
- 1.3. Research Methodology
- 1.4. Definitions and Assumptions
- 2. Executive Summary
- 2.1. Introduction
- 3. Market Dynamics
- 3.1. Introduction
- 3.2. Market Drivers
- 3.2.1. Growing consumer demand for transparency and quality assurance in food products drives the need for certification
- 3.3. Market Restrains
- 3.3.1. High Certification Costs
- 3.4. Market Trends
- 3.4.1. Increasing use of technology such as blockchain and digital platforms is enhancing transparency and traceability in the certification process
- 4. Market Factor Analysis
- 4.1. Porters Five Forces
- 4.2. Supply/Value Chain
- 4.3. PESTEL analysis
- 4.4. Market Entropy
- 4.5. Patent/Trademark Analysis
- 5. Global Food Certification Industry Analysis, Insights and Forecast, 2019-2031
- 5.1. Market Analysis, Insights and Forecast - by End-user Industry
- 5.1.1. Meat, Poultry, and Seafood Products
- 5.1.2. Dairy Products
- 5.1.3. Infant Food
- 5.1.4. Beverages
- 5.1.5. Bakery and Confectionery Products
- 5.1.6. Other End-user Industries
- 5.2. Market Analysis, Insights and Forecast - by Type
- 5.2.1. ISO 22000 - Food Safety Management System
- 5.2.2. BRCGS
- 5.2.3. Halal Certification
- 5.2.4. GMP+/FSA
- 5.2.5. Other Certifications
- 5.3. Market Analysis, Insights and Forecast - by Region
- 5.3.1. North America
- 5.3.2. Europe
- 5.3.3. Asia Pacific
- 5.3.4. South America
- 5.3.5. Middle East
- 5.3.6. South Africa
- 5.1. Market Analysis, Insights and Forecast - by End-user Industry
- 6. North America Food Certification Industry Analysis, Insights and Forecast, 2019-2031
- 6.1. Market Analysis, Insights and Forecast - by End-user Industry
- 6.1.1. Meat, Poultry, and Seafood Products
- 6.1.2. Dairy Products
- 6.1.3. Infant Food
- 6.1.4. Beverages
- 6.1.5. Bakery and Confectionery Products
- 6.1.6. Other End-user Industries
- 6.2. Market Analysis, Insights and Forecast - by Type
- 6.2.1. ISO 22000 - Food Safety Management System
- 6.2.2. BRCGS
- 6.2.3. Halal Certification
- 6.2.4. GMP+/FSA
- 6.2.5. Other Certifications
- 6.1. Market Analysis, Insights and Forecast - by End-user Industry
- 7. Europe Food Certification Industry Analysis, Insights and Forecast, 2019-2031
- 7.1. Market Analysis, Insights and Forecast - by End-user Industry
- 7.1.1. Meat, Poultry, and Seafood Products
- 7.1.2. Dairy Products
- 7.1.3. Infant Food
- 7.1.4. Beverages
- 7.1.5. Bakery and Confectionery Products
- 7.1.6. Other End-user Industries
- 7.2. Market Analysis, Insights and Forecast - by Type
- 7.2.1. ISO 22000 - Food Safety Management System
- 7.2.2. BRCGS
- 7.2.3. Halal Certification
- 7.2.4. GMP+/FSA
- 7.2.5. Other Certifications
- 7.1. Market Analysis, Insights and Forecast - by End-user Industry
- 8. Asia Pacific Food Certification Industry Analysis, Insights and Forecast, 2019-2031
- 8.1. Market Analysis, Insights and Forecast - by End-user Industry
- 8.1.1. Meat, Poultry, and Seafood Products
- 8.1.2. Dairy Products
- 8.1.3. Infant Food
- 8.1.4. Beverages
- 8.1.5. Bakery and Confectionery Products
- 8.1.6. Other End-user Industries
- 8.2. Market Analysis, Insights and Forecast - by Type
- 8.2.1. ISO 22000 - Food Safety Management System
- 8.2.2. BRCGS
- 8.2.3. Halal Certification
- 8.2.4. GMP+/FSA
- 8.2.5. Other Certifications
- 8.1. Market Analysis, Insights and Forecast - by End-user Industry
- 9. South America Food Certification Industry Analysis, Insights and Forecast, 2019-2031
- 9.1. Market Analysis, Insights and Forecast - by End-user Industry
- 9.1.1. Meat, Poultry, and Seafood Products
- 9.1.2. Dairy Products
- 9.1.3. Infant Food
- 9.1.4. Beverages
- 9.1.5. Bakery and Confectionery Products
- 9.1.6. Other End-user Industries
- 9.2. Market Analysis, Insights and Forecast - by Type
- 9.2.1. ISO 22000 - Food Safety Management System
- 9.2.2. BRCGS
- 9.2.3. Halal Certification
- 9.2.4. GMP+/FSA
- 9.2.5. Other Certifications
- 9.1. Market Analysis, Insights and Forecast - by End-user Industry
- 10. Middle East Food Certification Industry Analysis, Insights and Forecast, 2019-2031
- 10.1. Market Analysis, Insights and Forecast - by End-user Industry
- 10.1.1. Meat, Poultry, and Seafood Products
- 10.1.2. Dairy Products
- 10.1.3. Infant Food
- 10.1.4. Beverages
- 10.1.5. Bakery and Confectionery Products
- 10.1.6. Other End-user Industries
- 10.2. Market Analysis, Insights and Forecast - by Type
- 10.2.1. ISO 22000 - Food Safety Management System
- 10.2.2. BRCGS
- 10.2.3. Halal Certification
- 10.2.4. GMP+/FSA
- 10.2.5. Other Certifications
- 10.1. Market Analysis, Insights and Forecast - by End-user Industry
- 11. South Africa Food Certification Industry Analysis, Insights and Forecast, 2019-2031
- 11.1. Market Analysis, Insights and Forecast - by End-user Industry
- 11.1.1. Meat, Poultry, and Seafood Products
- 11.1.2. Dairy Products
- 11.1.3. Infant Food
- 11.1.4. Beverages
- 11.1.5. Bakery and Confectionery Products
- 11.1.6. Other End-user Industries
- 11.2. Market Analysis, Insights and Forecast - by Type
- 11.2.1. ISO 22000 - Food Safety Management System
- 11.2.2. BRCGS
- 11.2.3. Halal Certification
- 11.2.4. GMP+/FSA
- 11.2.5. Other Certifications
- 11.1. Market Analysis, Insights and Forecast - by End-user Industry
- 12. North America Food Certification Industry Analysis, Insights and Forecast, 2019-2031
- 12.1. Market Analysis, Insights and Forecast - By Country/Sub-region
- 12.1.1 United States
- 12.1.2 Canada
- 12.1.3 Mexico
- 12.1.4 Rest of North America
- 13. Europe Food Certification Industry Analysis, Insights and Forecast, 2019-2031
- 13.1. Market Analysis, Insights and Forecast - By Country/Sub-region
- 13.1.1 United Kingdom
- 13.1.2 Germany
- 13.1.3 France
- 13.1.4 Russia
- 13.1.5 Italy
- 13.1.6 Spain
- 13.1.7 Rest of Europe
- 14. Asia Pacific Food Certification Industry Analysis, Insights and Forecast, 2019-2031
- 14.1. Market Analysis, Insights and Forecast - By Country/Sub-region
- 14.1.1 India
- 14.1.2 China
- 14.1.3 Japan
- 14.1.4 Australia
- 14.1.5 Rest of Asia Pacific
- 15. South America Food Certification Industry Analysis, Insights and Forecast, 2019-2031
- 15.1. Market Analysis, Insights and Forecast - By Country/Sub-region
- 15.1.1 Brazil
- 15.1.2 Argentina
- 15.1.3 Rest of South America
- 16. MEA Food Certification Industry Analysis, Insights and Forecast, 2019-2031
- 16.1. Market Analysis, Insights and Forecast - By Country/Sub-region
- 16.1.1 Middle East
- 16.1.2 Africa
- 17. Competitive Analysis
- 17.1. Global Market Share Analysis 2024
- 17.2. Company Profiles
- 17.2.1 Intertek Group PLC
- 17.2.1.1. Overview
- 17.2.1.2. Products
- 17.2.1.3. SWOT Analysis
- 17.2.1.4. Recent Developments
- 17.2.1.5. Financials (Based on Availability)
- 17.2.2 Det Norske Veritas Holding AS
- 17.2.2.1. Overview
- 17.2.2.2. Products
- 17.2.2.3. SWOT Analysis
- 17.2.2.4. Recent Developments
- 17.2.2.5. Financials (Based on Availability)
- 17.2.3 NSF International
- 17.2.3.1. Overview
- 17.2.3.2. Products
- 17.2.3.3. SWOT Analysis
- 17.2.3.4. Recent Developments
- 17.2.3.5. Financials (Based on Availability)
- 17.2.4 SCS Global Services
- 17.2.4.1. Overview
- 17.2.4.2. Products
- 17.2.4.3. SWOT Analysis
- 17.2.4.4. Recent Developments
- 17.2.4.5. Financials (Based on Availability)
- 17.2.5 Eurofins Scientific
- 17.2.5.1. Overview
- 17.2.5.2. Products
- 17.2.5.3. SWOT Analysis
- 17.2.5.4. Recent Developments
- 17.2.5.5. Financials (Based on Availability)
- 17.2.6 Compagnie Merieux Alliance SAS (Merieux Nutrisciences)
- 17.2.6.1. Overview
- 17.2.6.2. Products
- 17.2.6.3. SWOT Analysis
- 17.2.6.4. Recent Developments
- 17.2.6.5. Financials (Based on Availability)
- 17.2.7 SGS Group
- 17.2.7.1. Overview
- 17.2.7.2. Products
- 17.2.7.3. SWOT Analysis
- 17.2.7.4. Recent Developments
- 17.2.7.5. Financials (Based on Availability)
- 17.2.8 AsureQuality Limited
- 17.2.8.1. Overview
- 17.2.8.2. Products
- 17.2.8.3. SWOT Analysis
- 17.2.8.4. Recent Developments
- 17.2.8.5. Financials (Based on Availability)
- 17.2.9 Bureau Veritas
- 17.2.9.1. Overview
- 17.2.9.2. Products
- 17.2.9.3. SWOT Analysis
- 17.2.9.4. Recent Developments
- 17.2.9.5. Financials (Based on Availability)
- 17.2.10 TÜV SÜD AG
- 17.2.10.1. Overview
- 17.2.10.2. Products
- 17.2.10.3. SWOT Analysis
- 17.2.10.4. Recent Developments
- 17.2.10.5. Financials (Based on Availability)
- 17.2.1 Intertek Group PLC
List of Figures
- Figure 1: Global Food Certification Industry Revenue Breakdown (Million, %) by Region 2024 & 2032
- Figure 2: North America Food Certification Industry Revenue (Million), by Country 2024 & 2032
- Figure 3: North America Food Certification Industry Revenue Share (%), by Country 2024 & 2032
- Figure 4: Europe Food Certification Industry Revenue (Million), by Country 2024 & 2032
- Figure 5: Europe Food Certification Industry Revenue Share (%), by Country 2024 & 2032
- Figure 6: Asia Pacific Food Certification Industry Revenue (Million), by Country 2024 & 2032
- Figure 7: Asia Pacific Food Certification Industry Revenue Share (%), by Country 2024 & 2032
- Figure 8: South America Food Certification Industry Revenue (Million), by Country 2024 & 2032
- Figure 9: South America Food Certification Industry Revenue Share (%), by Country 2024 & 2032
- Figure 10: MEA Food Certification Industry Revenue (Million), by Country 2024 & 2032
- Figure 11: MEA Food Certification Industry Revenue Share (%), by Country 2024 & 2032
- Figure 12: North America Food Certification Industry Revenue (Million), by End-user Industry 2024 & 2032
- Figure 13: North America Food Certification Industry Revenue Share (%), by End-user Industry 2024 & 2032
- Figure 14: North America Food Certification Industry Revenue (Million), by Type 2024 & 2032
- Figure 15: North America Food Certification Industry Revenue Share (%), by Type 2024 & 2032
- Figure 16: North America Food Certification Industry Revenue (Million), by Country 2024 & 2032
- Figure 17: North America Food Certification Industry Revenue Share (%), by Country 2024 & 2032
- Figure 18: Europe Food Certification Industry Revenue (Million), by End-user Industry 2024 & 2032
- Figure 19: Europe Food Certification Industry Revenue Share (%), by End-user Industry 2024 & 2032
- Figure 20: Europe Food Certification Industry Revenue (Million), by Type 2024 & 2032
- Figure 21: Europe Food Certification Industry Revenue Share (%), by Type 2024 & 2032
- Figure 22: Europe Food Certification Industry Revenue (Million), by Country 2024 & 2032
- Figure 23: Europe Food Certification Industry Revenue Share (%), by Country 2024 & 2032
- Figure 24: Asia Pacific Food Certification Industry Revenue (Million), by End-user Industry 2024 & 2032
- Figure 25: Asia Pacific Food Certification Industry Revenue Share (%), by End-user Industry 2024 & 2032
- Figure 26: Asia Pacific Food Certification Industry Revenue (Million), by Type 2024 & 2032
- Figure 27: Asia Pacific Food Certification Industry Revenue Share (%), by Type 2024 & 2032
- Figure 28: Asia Pacific Food Certification Industry Revenue (Million), by Country 2024 & 2032
- Figure 29: Asia Pacific Food Certification Industry Revenue Share (%), by Country 2024 & 2032
- Figure 30: South America Food Certification Industry Revenue (Million), by End-user Industry 2024 & 2032
- Figure 31: South America Food Certification Industry Revenue Share (%), by End-user Industry 2024 & 2032
- Figure 32: South America Food Certification Industry Revenue (Million), by Type 2024 & 2032
- Figure 33: South America Food Certification Industry Revenue Share (%), by Type 2024 & 2032
- Figure 34: South America Food Certification Industry Revenue (Million), by Country 2024 & 2032
- Figure 35: South America Food Certification Industry Revenue Share (%), by Country 2024 & 2032
- Figure 36: Middle East Food Certification Industry Revenue (Million), by End-user Industry 2024 & 2032
- Figure 37: Middle East Food Certification Industry Revenue Share (%), by End-user Industry 2024 & 2032
- Figure 38: Middle East Food Certification Industry Revenue (Million), by Type 2024 & 2032
- Figure 39: Middle East Food Certification Industry Revenue Share (%), by Type 2024 & 2032
- Figure 40: Middle East Food Certification Industry Revenue (Million), by Country 2024 & 2032
- Figure 41: Middle East Food Certification Industry Revenue Share (%), by Country 2024 & 2032
- Figure 42: South Africa Food Certification Industry Revenue (Million), by End-user Industry 2024 & 2032
- Figure 43: South Africa Food Certification Industry Revenue Share (%), by End-user Industry 2024 & 2032
- Figure 44: South Africa Food Certification Industry Revenue (Million), by Type 2024 & 2032
- Figure 45: South Africa Food Certification Industry Revenue Share (%), by Type 2024 & 2032
- Figure 46: South Africa Food Certification Industry Revenue (Million), by Country 2024 & 2032
- Figure 47: South Africa Food Certification Industry Revenue Share (%), by Country 2024 & 2032
List of Tables
- Table 1: Global Food Certification Industry Revenue Million Forecast, by Region 2019 & 2032
- Table 2: Global Food Certification Industry Revenue Million Forecast, by End-user Industry 2019 & 2032
- Table 3: Global Food Certification Industry Revenue Million Forecast, by Type 2019 & 2032
- Table 4: Global Food Certification Industry Revenue Million Forecast, by Region 2019 & 2032
- Table 5: Global Food Certification Industry Revenue Million Forecast, by Country 2019 & 2032
- Table 6: United States Food Certification Industry Revenue (Million) Forecast, by Application 2019 & 2032
- Table 7: Canada Food Certification Industry Revenue (Million) Forecast, by Application 2019 & 2032
- Table 8: Mexico Food Certification Industry Revenue (Million) Forecast, by Application 2019 & 2032
- Table 9: Rest of North America Food Certification Industry Revenue (Million) Forecast, by Application 2019 & 2032
- Table 10: Global Food Certification Industry Revenue Million Forecast, by Country 2019 & 2032
- Table 11: United Kingdom Food Certification Industry Revenue (Million) Forecast, by Application 2019 & 2032
- Table 12: Germany Food Certification Industry Revenue (Million) Forecast, by Application 2019 & 2032
- Table 13: France Food Certification Industry Revenue (Million) Forecast, by Application 2019 & 2032
- Table 14: Russia Food Certification Industry Revenue (Million) Forecast, by Application 2019 & 2032
- Table 15: Italy Food Certification Industry Revenue (Million) Forecast, by Application 2019 & 2032
- Table 16: Spain Food Certification Industry Revenue (Million) Forecast, by Application 2019 & 2032
- Table 17: Rest of Europe Food Certification Industry Revenue (Million) Forecast, by Application 2019 & 2032
- Table 18: Global Food Certification Industry Revenue Million Forecast, by Country 2019 & 2032
- Table 19: India Food Certification Industry Revenue (Million) Forecast, by Application 2019 & 2032
- Table 20: China Food Certification Industry Revenue (Million) Forecast, by Application 2019 & 2032
- Table 21: Japan Food Certification Industry Revenue (Million) Forecast, by Application 2019 & 2032
- Table 22: Australia Food Certification Industry Revenue (Million) Forecast, by Application 2019 & 2032
- Table 23: Rest of Asia Pacific Food Certification Industry Revenue (Million) Forecast, by Application 2019 & 2032
- Table 24: Global Food Certification Industry Revenue Million Forecast, by Country 2019 & 2032
- Table 25: Brazil Food Certification Industry Revenue (Million) Forecast, by Application 2019 & 2032
- Table 26: Argentina Food Certification Industry Revenue (Million) Forecast, by Application 2019 & 2032
- Table 27: Rest of South America Food Certification Industry Revenue (Million) Forecast, by Application 2019 & 2032
- Table 28: Global Food Certification Industry Revenue Million Forecast, by Country 2019 & 2032
- Table 29: Middle East Food Certification Industry Revenue (Million) Forecast, by Application 2019 & 2032
- Table 30: Africa Food Certification Industry Revenue (Million) Forecast, by Application 2019 & 2032
- Table 31: Global Food Certification Industry Revenue Million Forecast, by End-user Industry 2019 & 2032
- Table 32: Global Food Certification Industry Revenue Million Forecast, by Type 2019 & 2032
- Table 33: Global Food Certification Industry Revenue Million Forecast, by Country 2019 & 2032
- Table 34: United States Food Certification Industry Revenue (Million) Forecast, by Application 2019 & 2032
- Table 35: Canada Food Certification Industry Revenue (Million) Forecast, by Application 2019 & 2032
- Table 36: Mexico Food Certification Industry Revenue (Million) Forecast, by Application 2019 & 2032
- Table 37: Rest of North America Food Certification Industry Revenue (Million) Forecast, by Application 2019 & 2032
- Table 38: Global Food Certification Industry Revenue Million Forecast, by End-user Industry 2019 & 2032
- Table 39: Global Food Certification Industry Revenue Million Forecast, by Type 2019 & 2032
- Table 40: Global Food Certification Industry Revenue Million Forecast, by Country 2019 & 2032
- Table 41: United Kingdom Food Certification Industry Revenue (Million) Forecast, by Application 2019 & 2032
- Table 42: Germany Food Certification Industry Revenue (Million) Forecast, by Application 2019 & 2032
- Table 43: France Food Certification Industry Revenue (Million) Forecast, by Application 2019 & 2032
- Table 44: Russia Food Certification Industry Revenue (Million) Forecast, by Application 2019 & 2032
- Table 45: Italy Food Certification Industry Revenue (Million) Forecast, by Application 2019 & 2032
- Table 46: Spain Food Certification Industry Revenue (Million) Forecast, by Application 2019 & 2032
- Table 47: Rest of Europe Food Certification Industry Revenue (Million) Forecast, by Application 2019 & 2032
- Table 48: Global Food Certification Industry Revenue Million Forecast, by End-user Industry 2019 & 2032
- Table 49: Global Food Certification Industry Revenue Million Forecast, by Type 2019 & 2032
- Table 50: Global Food Certification Industry Revenue Million Forecast, by Country 2019 & 2032
- Table 51: India Food Certification Industry Revenue (Million) Forecast, by Application 2019 & 2032
- Table 52: China Food Certification Industry Revenue (Million) Forecast, by Application 2019 & 2032
- Table 53: Japan Food Certification Industry Revenue (Million) Forecast, by Application 2019 & 2032
- Table 54: Australia Food Certification Industry Revenue (Million) Forecast, by Application 2019 & 2032
- Table 55: Rest of Asia Pacific Food Certification Industry Revenue (Million) Forecast, by Application 2019 & 2032
- Table 56: Global Food Certification Industry Revenue Million Forecast, by End-user Industry 2019 & 2032
- Table 57: Global Food Certification Industry Revenue Million Forecast, by Type 2019 & 2032
- Table 58: Global Food Certification Industry Revenue Million Forecast, by Country 2019 & 2032
- Table 59: Brazil Food Certification Industry Revenue (Million) Forecast, by Application 2019 & 2032
- Table 60: Argentina Food Certification Industry Revenue (Million) Forecast, by Application 2019 & 2032
- Table 61: Rest of South America Food Certification Industry Revenue (Million) Forecast, by Application 2019 & 2032
- Table 62: Global Food Certification Industry Revenue Million Forecast, by End-user Industry 2019 & 2032
- Table 63: Global Food Certification Industry Revenue Million Forecast, by Type 2019 & 2032
- Table 64: Global Food Certification Industry Revenue Million Forecast, by Country 2019 & 2032
- Table 65: Global Food Certification Industry Revenue Million Forecast, by End-user Industry 2019 & 2032
- Table 66: Global Food Certification Industry Revenue Million Forecast, by Type 2019 & 2032
- Table 67: Global Food Certification Industry Revenue Million Forecast, by Country 2019 & 2032
- Table 68: Saudi Arabia Food Certification Industry Revenue (Million) Forecast, by Application 2019 & 2032
- Table 69: Rest of Middle East Food Certification Industry Revenue (Million) Forecast, by Application 2019 & 2032
Frequently Asked Questions
1. What is the projected Compound Annual Growth Rate (CAGR) of the Food Certification Industry?
The projected CAGR is approximately 5.90%.
2. Which companies are prominent players in the Food Certification Industry?
Key companies in the market include Intertek Group PLC, Det Norske Veritas Holding AS, NSF International, SCS Global Services, Eurofins Scientific, Compagnie Merieux Alliance SAS (Merieux Nutrisciences), SGS Group, AsureQuality Limited, Bureau Veritas, TÜV SÜD AG.
3. What are the main segments of the Food Certification Industry?
The market segments include End-user Industry, Type.
4. Can you provide details about the market size?
The market size is estimated to be USD XX Million as of 2022.
5. What are some drivers contributing to market growth?
Growing consumer demand for transparency and quality assurance in food products drives the need for certification.
6. What are the notable trends driving market growth?
Increasing use of technology such as blockchain and digital platforms is enhancing transparency and traceability in the certification process.
7. Are there any restraints impacting market growth?
High Certification Costs.
8. Can you provide examples of recent developments in the market?
In November 2022, SCS Global Services launched its plant-based certification program. The program promotes plant-based alternatives and recognizes innovation in a wide range of consumer products. Food, beverages, CBD, and body care products are all eligible for certification under the SCS-109 Standard. Certification ensures that no animal-derived ingredients are used in the production of the product. Furthermore, products for human and animal consumption must contain at least 95% plant-based ingredients, while other products, such as body care products, must contain at least 50% plant-based ingredients.
9. What pricing options are available for accessing the report?
Pricing options include single-user, multi-user, and enterprise licenses priced at USD 4750, USD 5250, and USD 8750 respectively.
10. Is the market size provided in terms of value or volume?
The market size is provided in terms of value, measured in Million.
11. Are there any specific market keywords associated with the report?
Yes, the market keyword associated with the report is "Food Certification Industry," which aids in identifying and referencing the specific market segment covered.
12. How do I determine which pricing option suits my needs best?
The pricing options vary based on user requirements and access needs. Individual users may opt for single-user licenses, while businesses requiring broader access may choose multi-user or enterprise licenses for cost-effective access to the report.
13. Are there any additional resources or data provided in the Food Certification Industry report?
While the report offers comprehensive insights, it's advisable to review the specific contents or supplementary materials provided to ascertain if additional resources or data are available.
14. How can I stay updated on further developments or reports in the Food Certification Industry?
To stay informed about further developments, trends, and reports in the Food Certification Industry, consider subscribing to industry newsletters, following relevant companies and organizations, or regularly checking reputable industry news sources and publications.
Methodology
Step 1 - Identification of Relevant Samples Size from Population Database


Step 2 - Approaches for Defining Global Market Size (Value, Volume* & Price*)

Note*: In applicable scenarios
Step 3 - Data Sources
Primary Research
- Web Analytics
- Survey Reports
- Research Institute
- Latest Research Reports
- Opinion Leaders
Secondary Research
- Annual Reports
- White Paper
- Latest Press Release
- Industry Association
- Paid Database
- Investor Presentations

Step 4 - Data Triangulation
Involves using different sources of information in order to increase the validity of a study
These sources are likely to be stakeholders in a program - participants, other researchers, program staff, other community members, and so on.
Then we put all data in single framework & apply various statistical tools to find out the dynamic on the market.
During the analysis stage, feedback from the stakeholder groups would be compared to determine areas of agreement as well as areas of divergence


