
Key Insights
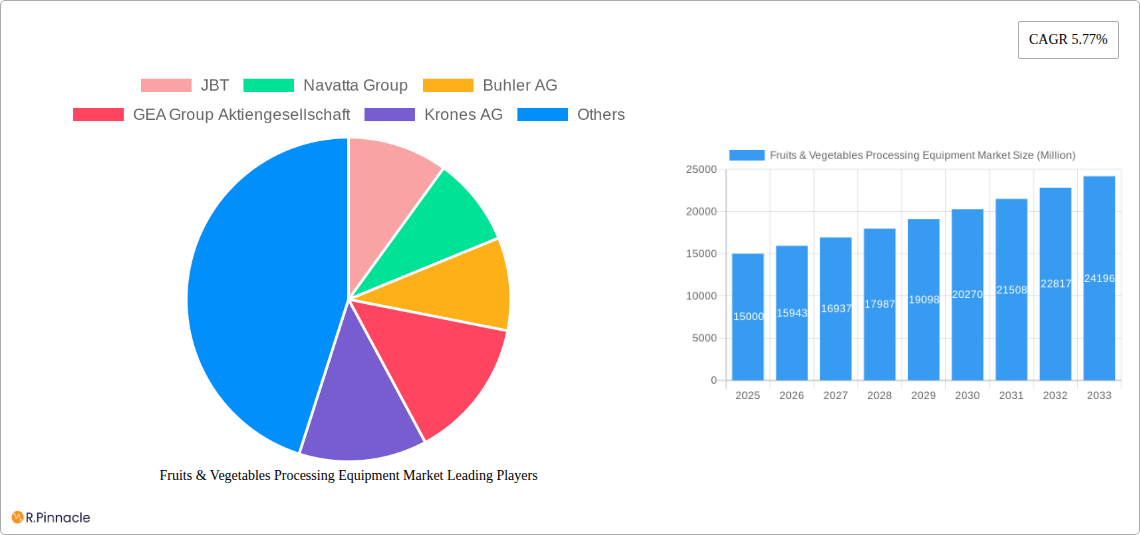
The global Fruits & Vegetables Processing Equipment market is experiencing robust growth, projected to reach a substantial size by 2033. A Compound Annual Growth Rate (CAGR) of 5.77% from 2019 to 2024 indicates a consistently expanding market driven by several key factors. The increasing demand for processed fruits and vegetables, fueled by changing consumer preferences towards convenient and ready-to-eat options, is a major catalyst. Furthermore, the growth of the food processing industry globally, particularly in developing economies experiencing rapid urbanization and rising disposable incomes, significantly contributes to market expansion. Technological advancements in processing equipment, leading to increased efficiency, reduced waste, and improved product quality, further propel market growth. The market is segmented by equipment type into pre-processing, processing, and packaging & handling equipment, each experiencing varying growth rates based on specific technological advancements and consumer demands. Pre-processing equipment, crucial for initial cleaning and preparation, shows consistent demand, while processing equipment, encompassing various technologies like juicing, freezing, and canning, witnesses significant growth due to innovations enhancing productivity and product preservation. Packaging and handling equipment, vital for maintaining product quality and extending shelf life, also contributes significantly to the overall market size. While the market faces restraints such as high initial investment costs for advanced equipment and fluctuating raw material prices, the long-term outlook remains positive, driven by continued innovation and the ever-growing demand for processed fruits and vegetables.
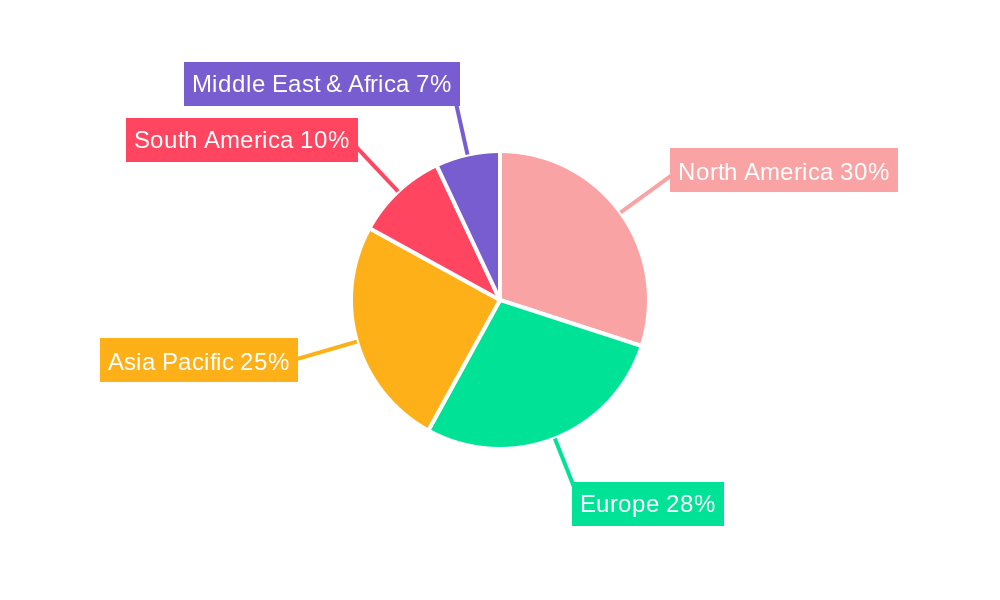
The regional distribution of the Fruits & Vegetables Processing Equipment market reveals significant variations. North America and Europe currently hold substantial market shares, driven by established food processing industries and high consumer demand for processed foods. However, the Asia-Pacific region is expected to witness the fastest growth in the coming years, fueled by rapid economic expansion, rising disposable incomes, and increasing urbanization across countries like India and China. Key players in the market, including JBT, Buhler AG, GEA Group, and Krones AG, are constantly innovating and expanding their product portfolios to cater to the growing demand and evolving technological landscape. The competitive landscape is characterized by both large multinational corporations and specialized smaller companies, offering a diverse range of equipment and services to various segments within the industry. This dynamic interplay of factors contributes to a complex yet promising growth trajectory for the Fruits & Vegetables Processing Equipment market in the forecast period.
Fruits & Vegetables Processing Equipment Market Report: 2019-2033
This comprehensive report provides an in-depth analysis of the Fruits & Vegetables Processing Equipment market, offering invaluable insights for industry professionals, investors, and strategic decision-makers. Covering the period from 2019 to 2033, with a focus on 2025, this report dissects market dynamics, technological advancements, and competitive landscapes to provide a clear and actionable understanding of this dynamic sector. The report leverages extensive data analysis to forecast market growth and identify key opportunities.
Fruits & Vegetables Processing Equipment Market Structure & Innovation Trends
This section analyzes the market's competitive landscape, highlighting key trends driving innovation and shaping its future. We examine market concentration, identifying the leading players and their respective market shares. The report details the influence of regulatory frameworks, the impact of substitute products, and the evolving demographics of end-users. Furthermore, we explore mergers and acquisitions (M&A) activities within the industry, analyzing deal values and their implications for market consolidation.
Market Concentration: The market exhibits a moderately concentrated structure, with a few major players holding significant market share. JBT, Buhler AG, and GEA Group Aktiengesellschaft are among the prominent players, collectively accounting for an estimated xx% of the market in 2025.
Innovation Drivers: Key drivers of innovation include increasing demand for automation, the need for efficient processing techniques to minimize waste, and stringent food safety regulations.
M&A Activity: The past five years have witnessed significant M&A activity, with deal values totaling an estimated xx Million. These transactions reflect the industry's consolidation trend and the pursuit of greater economies of scale.
Fruits & Vegetables Processing Equipment Market Dynamics & Trends
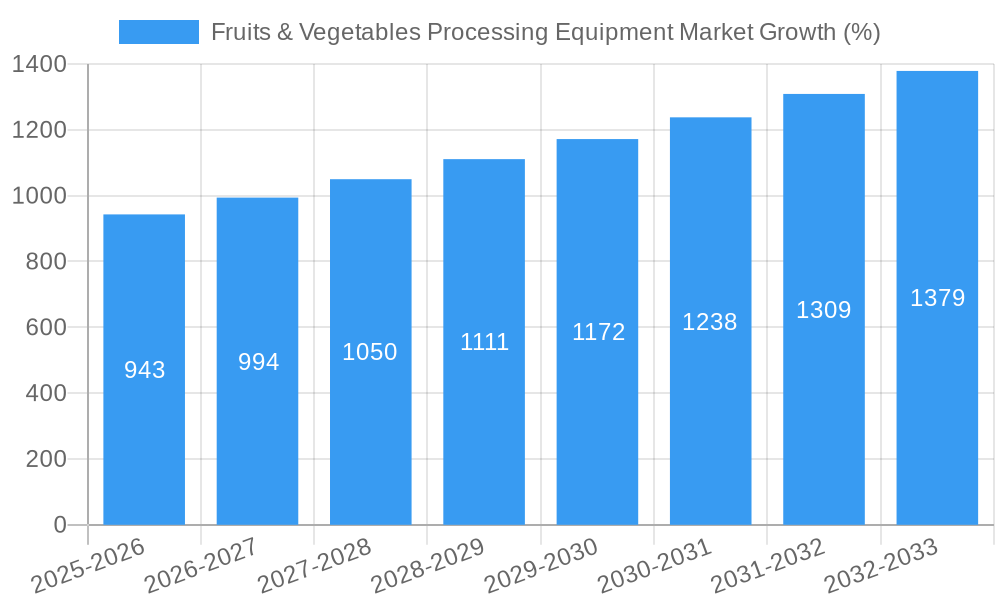
This section delves into the forces shaping market growth, exploring key drivers, disruptive technologies, shifting consumer preferences, and the intensifying competitive landscape. We analyze historical market performance (2019-2024) and project future growth (2025-2033) using a robust forecasting model. Specific metrics like Compound Annual Growth Rate (CAGR) and market penetration rates are provided for key segments. The increasing demand for processed fruits and vegetables, driven by changing lifestyles and health consciousness, is a major growth catalyst. Furthermore, advancements in automation and AI are transforming processing efficiency and yield.
The market is anticipated to register a CAGR of xx% during the forecast period (2025-2033), driven by factors such as increasing consumer demand for convenient and processed food products, technological advancements in processing equipment, and rising investments in the food processing industry. Market penetration of automated equipment is projected to increase by xx% by 2033.
Dominant Regions & Segments in Fruits & Vegetables Processing Equipment Market
This section identifies the leading geographical regions and product segments within the Fruits & Vegetables Processing Equipment market. We provide a detailed analysis of market dominance, exploring the underlying factors contributing to the success of specific regions and product categories.
Dominant Region: North America currently holds a leading position, driven by high consumer demand, advanced infrastructure, and a strong focus on food safety.
Dominant Segments:
- By Type: Processing Equipment is the dominant segment, due to the high demand for efficient and advanced technologies. This segment is expected to maintain its dominance over the forecast period, accounting for approximately xx% of the market.
Key Drivers (by region and segment):
- North America: Strong regulatory frameworks, technological advancements, and high disposable incomes drive market growth.
- Europe: Growing focus on sustainable processing techniques and increasing demand for organic products.
- Asia-Pacific: Rapid economic growth, expanding population, and increasing urbanization fuel market expansion.
- Processing Equipment: High demand for automation, advanced technologies like high-pressure processing, and efficient waste management solutions drive segment growth.
Fruits & Vegetables Processing Equipment Market Product Innovations
The market is witnessing rapid innovation, with companies focusing on developing advanced technologies to enhance processing efficiency, reduce waste, and improve product quality. Recent product innovations include advanced automated systems for sorting, cleaning, and cutting fruits and vegetables. The focus is on improving energy efficiency and integrating advanced software for process optimization. These innovations offer significant competitive advantages, allowing companies to enhance their market share and operational efficiency.
Report Scope & Segmentation Analysis
This report segments the Fruits & Vegetables Processing Equipment market by type:
Pre-processing Equipment: This segment includes washing, peeling, and slicing equipment. The market size for pre-processing equipment is estimated at xx Million in 2025, projected to reach xx Million by 2033. Competition is high, with many players offering similar products.
Processing Equipment: This segment encompasses blanching, pasteurization, and freezing equipment. The market size for processing equipment is significantly larger, estimated at xx Million in 2025, with projected growth to xx Million by 2033. Technological advancements and increasing demand drive competition in this segment.
Packaging and Handling Equipment: This segment focuses on equipment for packaging, labeling, and transporting processed fruits and vegetables. Market size is estimated at xx Million in 2025, anticipated to grow to xx Million by 2033, driven by advancements in automated packaging technologies.
Key Drivers of Fruits & Vegetables Processing Equipment Market Growth
Several key factors are driving the growth of the Fruits & Vegetables Processing Equipment market. These include increasing demand for processed food products, advancements in technology leading to improved efficiency and reduced waste, stringent food safety regulations, and the rising adoption of automation across the food processing industry. Government initiatives promoting food processing and investments in infrastructure further fuel market expansion.
Challenges in the Fruits & Vegetables Processing Equipment Market Sector
The Fruits & Vegetables Processing Equipment market faces several challenges, including fluctuating raw material prices, stringent regulatory compliance requirements which increase production costs, and intense competition among numerous players. Supply chain disruptions caused by geopolitical events or natural disasters can also impact market stability. The high initial investment required for advanced equipment can be a barrier to entry for smaller businesses. These factors can influence profitability and growth.
Emerging Opportunities in Fruits & Vegetables Processing Equipment Market
Several emerging opportunities exist for growth within this market. The increasing demand for minimally processed foods and convenient ready-to-eat products opens new avenues for specialized processing equipment. The rising adoption of sustainable and eco-friendly processing technologies offers opportunities for innovation and differentiation. Expanding into new markets, especially in developing economies, presents further growth potential.
Leading Players in the Fruits & Vegetables Processing Equipment Market Market
- JBT
- Navatta Group
- Buhler AG
- GEA Group Aktiengesellschaft
- Krones AG
- Haith Tickhill Group of Companies
- Syntegon Technology GmbH
- Turatti Group
- Allround Vegetable Processing
- SVZ Industrial Fruit & Vegetable Ingredients
*List Not Exhaustive
Key Developments in Fruits & Vegetables Processing Equipment Market Industry
- January 2023: JBT launched a new line of automated fruit and vegetable processing equipment.
- March 2022: Buhler AG acquired a smaller competitor specializing in packaging technology.
- June 2021: GEA Group Aktiengesellschaft invested in research and development of energy-efficient processing techniques.
- (Add other relevant developments with year/month)
Future Outlook for Fruits & Vegetables Processing Equipment Market Market
The future outlook for the Fruits & Vegetables Processing Equipment market is positive, driven by sustained growth in the processed food industry, technological advancements, and increasing consumer demand for convenient and healthy food options. Strategic investments in research and development, focus on sustainability, and expansion into new markets will be crucial for companies to capitalize on the emerging opportunities and maintain a competitive edge in this dynamic sector. The market is poised for continued expansion, with significant growth projected throughout the forecast period.
Fruits & Vegetables Processing Equipment Market Segmentation
-
1. Type
- 1.1. Pre-processing Equipment
- 1.2. Processing Equipment
- 1.3. Packaging and Handling Equipment
Fruits & Vegetables Processing Equipment Market Segmentation By Geography
-
1. North America
- 1.1. United States
- 1.2. Canada
- 1.3. Mexico
- 1.4. Rest of North America
-
2. Europe
- 2.1. United Kingdom
- 2.2. Germany
- 2.3. France
- 2.4. Russia
- 2.5. Italy
- 2.6. Spain
- 2.7. Rest of Europe
-
3. Asia Pacific
- 3.1. India
- 3.2. China
- 3.3. Japan
- 3.4. Australia
- 3.5. Rest of Asia Pacific
-
4. South America
- 4.1. Brazil
- 4.2. Argentina
- 4.3. Rest of South America
- 5. Middle East
-
6. South Africa
- 6.1. Saudi Arabia
- 6.2. Rest of Middle East
Fruits & Vegetables Processing Equipment Market REPORT HIGHLIGHTS
| Aspects | Details |
|---|---|
| Study Period | 2019-2033 |
| Base Year | 2024 |
| Estimated Year | 2025 |
| Forecast Period | 2025-2033 |
| Historical Period | 2019-2024 |
| Growth Rate | CAGR of 5.77% from 2019-2033 |
| Segmentation |
|
Table of Contents
- 1. Introduction
- 1.1. Research Scope
- 1.2. Market Segmentation
- 1.3. Research Methodology
- 1.4. Definitions and Assumptions
- 2. Executive Summary
- 2.1. Introduction
- 3. Market Dynamics
- 3.1. Introduction
- 3.2. Market Drivers
- 3.2.1. Rising Health & Wellness Trends; Strategic Initiatives By Key Players
- 3.3. Market Restrains
- 3.3.1. Cost Considerations Coupled With Availability Of Alternatives
- 3.4. Market Trends
- 3.4.1. Growing Demand for Convenience Foods
- 4. Market Factor Analysis
- 4.1. Porters Five Forces
- 4.2. Supply/Value Chain
- 4.3. PESTEL analysis
- 4.4. Market Entropy
- 4.5. Patent/Trademark Analysis
- 5. Global Fruits & Vegetables Processing Equipment Market Analysis, Insights and Forecast, 2019-2031
- 5.1. Market Analysis, Insights and Forecast - by Type
- 5.1.1. Pre-processing Equipment
- 5.1.2. Processing Equipment
- 5.1.3. Packaging and Handling Equipment
- 5.2. Market Analysis, Insights and Forecast - by Region
- 5.2.1. North America
- 5.2.2. Europe
- 5.2.3. Asia Pacific
- 5.2.4. South America
- 5.2.5. Middle East
- 5.2.6. South Africa
- 5.1. Market Analysis, Insights and Forecast - by Type
- 6. North America Fruits & Vegetables Processing Equipment Market Analysis, Insights and Forecast, 2019-2031
- 6.1. Market Analysis, Insights and Forecast - by Type
- 6.1.1. Pre-processing Equipment
- 6.1.2. Processing Equipment
- 6.1.3. Packaging and Handling Equipment
- 6.1. Market Analysis, Insights and Forecast - by Type
- 7. Europe Fruits & Vegetables Processing Equipment Market Analysis, Insights and Forecast, 2019-2031
- 7.1. Market Analysis, Insights and Forecast - by Type
- 7.1.1. Pre-processing Equipment
- 7.1.2. Processing Equipment
- 7.1.3. Packaging and Handling Equipment
- 7.1. Market Analysis, Insights and Forecast - by Type
- 8. Asia Pacific Fruits & Vegetables Processing Equipment Market Analysis, Insights and Forecast, 2019-2031
- 8.1. Market Analysis, Insights and Forecast - by Type
- 8.1.1. Pre-processing Equipment
- 8.1.2. Processing Equipment
- 8.1.3. Packaging and Handling Equipment
- 8.1. Market Analysis, Insights and Forecast - by Type
- 9. South America Fruits & Vegetables Processing Equipment Market Analysis, Insights and Forecast, 2019-2031
- 9.1. Market Analysis, Insights and Forecast - by Type
- 9.1.1. Pre-processing Equipment
- 9.1.2. Processing Equipment
- 9.1.3. Packaging and Handling Equipment
- 9.1. Market Analysis, Insights and Forecast - by Type
- 10. Middle East Fruits & Vegetables Processing Equipment Market Analysis, Insights and Forecast, 2019-2031
- 10.1. Market Analysis, Insights and Forecast - by Type
- 10.1.1. Pre-processing Equipment
- 10.1.2. Processing Equipment
- 10.1.3. Packaging and Handling Equipment
- 10.1. Market Analysis, Insights and Forecast - by Type
- 11. South Africa Fruits & Vegetables Processing Equipment Market Analysis, Insights and Forecast, 2019-2031
- 11.1. Market Analysis, Insights and Forecast - by Type
- 11.1.1. Pre-processing Equipment
- 11.1.2. Processing Equipment
- 11.1.3. Packaging and Handling Equipment
- 11.1. Market Analysis, Insights and Forecast - by Type
- 12. North America Fruits & Vegetables Processing Equipment Market Analysis, Insights and Forecast, 2019-2031
- 12.1. Market Analysis, Insights and Forecast - By Country/Sub-region
- 12.1.1 United States
- 12.1.2 Canada
- 12.1.3 Mexico
- 12.1.4 Rest of North America
- 13. Europe Fruits & Vegetables Processing Equipment Market Analysis, Insights and Forecast, 2019-2031
- 13.1. Market Analysis, Insights and Forecast - By Country/Sub-region
- 13.1.1 United Kingdom
- 13.1.2 Germany
- 13.1.3 France
- 13.1.4 Russia
- 13.1.5 Italy
- 13.1.6 Spain
- 13.1.7 Rest of Europe
- 14. Asia Pacific Fruits & Vegetables Processing Equipment Market Analysis, Insights and Forecast, 2019-2031
- 14.1. Market Analysis, Insights and Forecast - By Country/Sub-region
- 14.1.1 India
- 14.1.2 China
- 14.1.3 Japan
- 14.1.4 Australia
- 14.1.5 Rest of Asia Pacific
- 15. South America Fruits & Vegetables Processing Equipment Market Analysis, Insights and Forecast, 2019-2031
- 15.1. Market Analysis, Insights and Forecast - By Country/Sub-region
- 15.1.1 Brazil
- 15.1.2 Argentina
- 15.1.3 Rest of South America
- 16. Middle East Fruits & Vegetables Processing Equipment Market Analysis, Insights and Forecast, 2019-2031
- 16.1. Market Analysis, Insights and Forecast - By Country/Sub-region
- 16.1.1.
- 17. South Africa Fruits & Vegetables Processing Equipment Market Analysis, Insights and Forecast, 2019-2031
- 17.1. Market Analysis, Insights and Forecast - By Country/Sub-region
- 17.1.1 Saudi Arabia
- 17.1.2 Rest of Middle East
- 18. Competitive Analysis
- 18.1. Global Market Share Analysis 2024
- 18.2. Company Profiles
- 18.2.1 JBT
- 18.2.1.1. Overview
- 18.2.1.2. Products
- 18.2.1.3. SWOT Analysis
- 18.2.1.4. Recent Developments
- 18.2.1.5. Financials (Based on Availability)
- 18.2.2 Navatta Group
- 18.2.2.1. Overview
- 18.2.2.2. Products
- 18.2.2.3. SWOT Analysis
- 18.2.2.4. Recent Developments
- 18.2.2.5. Financials (Based on Availability)
- 18.2.3 Buhler AG
- 18.2.3.1. Overview
- 18.2.3.2. Products
- 18.2.3.3. SWOT Analysis
- 18.2.3.4. Recent Developments
- 18.2.3.5. Financials (Based on Availability)
- 18.2.4 GEA Group Aktiengesellschaft
- 18.2.4.1. Overview
- 18.2.4.2. Products
- 18.2.4.3. SWOT Analysis
- 18.2.4.4. Recent Developments
- 18.2.4.5. Financials (Based on Availability)
- 18.2.5 Krones AG
- 18.2.5.1. Overview
- 18.2.5.2. Products
- 18.2.5.3. SWOT Analysis
- 18.2.5.4. Recent Developments
- 18.2.5.5. Financials (Based on Availability)
- 18.2.6 Haith Tickhill Group of Companies
- 18.2.6.1. Overview
- 18.2.6.2. Products
- 18.2.6.3. SWOT Analysis
- 18.2.6.4. Recent Developments
- 18.2.6.5. Financials (Based on Availability)
- 18.2.7 Syntegon Technology GmbH
- 18.2.7.1. Overview
- 18.2.7.2. Products
- 18.2.7.3. SWOT Analysis
- 18.2.7.4. Recent Developments
- 18.2.7.5. Financials (Based on Availability)
- 18.2.8 Turatti Group*List Not Exhaustive
- 18.2.8.1. Overview
- 18.2.8.2. Products
- 18.2.8.3. SWOT Analysis
- 18.2.8.4. Recent Developments
- 18.2.8.5. Financials (Based on Availability)
- 18.2.9 Allround Vegetable Processing
- 18.2.9.1. Overview
- 18.2.9.2. Products
- 18.2.9.3. SWOT Analysis
- 18.2.9.4. Recent Developments
- 18.2.9.5. Financials (Based on Availability)
- 18.2.10 SVZ Industrial Fruit & Vegetable Ingredients
- 18.2.10.1. Overview
- 18.2.10.2. Products
- 18.2.10.3. SWOT Analysis
- 18.2.10.4. Recent Developments
- 18.2.10.5. Financials (Based on Availability)
- 18.2.1 JBT
List of Figures
- Figure 1: Global Fruits & Vegetables Processing Equipment Market Revenue Breakdown (Million, %) by Region 2024 & 2032
- Figure 2: Global Fruits & Vegetables Processing Equipment Market Volume Breakdown (K Units, %) by Region 2024 & 2032
- Figure 3: North America Fruits & Vegetables Processing Equipment Market Revenue (Million), by Country 2024 & 2032
- Figure 4: North America Fruits & Vegetables Processing Equipment Market Volume (K Units), by Country 2024 & 2032
- Figure 5: North America Fruits & Vegetables Processing Equipment Market Revenue Share (%), by Country 2024 & 2032
- Figure 6: North America Fruits & Vegetables Processing Equipment Market Volume Share (%), by Country 2024 & 2032
- Figure 7: Europe Fruits & Vegetables Processing Equipment Market Revenue (Million), by Country 2024 & 2032
- Figure 8: Europe Fruits & Vegetables Processing Equipment Market Volume (K Units), by Country 2024 & 2032
- Figure 9: Europe Fruits & Vegetables Processing Equipment Market Revenue Share (%), by Country 2024 & 2032
- Figure 10: Europe Fruits & Vegetables Processing Equipment Market Volume Share (%), by Country 2024 & 2032
- Figure 11: Asia Pacific Fruits & Vegetables Processing Equipment Market Revenue (Million), by Country 2024 & 2032
- Figure 12: Asia Pacific Fruits & Vegetables Processing Equipment Market Volume (K Units), by Country 2024 & 2032
- Figure 13: Asia Pacific Fruits & Vegetables Processing Equipment Market Revenue Share (%), by Country 2024 & 2032
- Figure 14: Asia Pacific Fruits & Vegetables Processing Equipment Market Volume Share (%), by Country 2024 & 2032
- Figure 15: South America Fruits & Vegetables Processing Equipment Market Revenue (Million), by Country 2024 & 2032
- Figure 16: South America Fruits & Vegetables Processing Equipment Market Volume (K Units), by Country 2024 & 2032
- Figure 17: South America Fruits & Vegetables Processing Equipment Market Revenue Share (%), by Country 2024 & 2032
- Figure 18: South America Fruits & Vegetables Processing Equipment Market Volume Share (%), by Country 2024 & 2032
- Figure 19: Middle East Fruits & Vegetables Processing Equipment Market Revenue (Million), by Country 2024 & 2032
- Figure 20: Middle East Fruits & Vegetables Processing Equipment Market Volume (K Units), by Country 2024 & 2032
- Figure 21: Middle East Fruits & Vegetables Processing Equipment Market Revenue Share (%), by Country 2024 & 2032
- Figure 22: Middle East Fruits & Vegetables Processing Equipment Market Volume Share (%), by Country 2024 & 2032
- Figure 23: South Africa Fruits & Vegetables Processing Equipment Market Revenue (Million), by Country 2024 & 2032
- Figure 24: South Africa Fruits & Vegetables Processing Equipment Market Volume (K Units), by Country 2024 & 2032
- Figure 25: South Africa Fruits & Vegetables Processing Equipment Market Revenue Share (%), by Country 2024 & 2032
- Figure 26: South Africa Fruits & Vegetables Processing Equipment Market Volume Share (%), by Country 2024 & 2032
- Figure 27: North America Fruits & Vegetables Processing Equipment Market Revenue (Million), by Type 2024 & 2032
- Figure 28: North America Fruits & Vegetables Processing Equipment Market Volume (K Units), by Type 2024 & 2032
- Figure 29: North America Fruits & Vegetables Processing Equipment Market Revenue Share (%), by Type 2024 & 2032
- Figure 30: North America Fruits & Vegetables Processing Equipment Market Volume Share (%), by Type 2024 & 2032
- Figure 31: North America Fruits & Vegetables Processing Equipment Market Revenue (Million), by Country 2024 & 2032
- Figure 32: North America Fruits & Vegetables Processing Equipment Market Volume (K Units), by Country 2024 & 2032
- Figure 33: North America Fruits & Vegetables Processing Equipment Market Revenue Share (%), by Country 2024 & 2032
- Figure 34: North America Fruits & Vegetables Processing Equipment Market Volume Share (%), by Country 2024 & 2032
- Figure 35: Europe Fruits & Vegetables Processing Equipment Market Revenue (Million), by Type 2024 & 2032
- Figure 36: Europe Fruits & Vegetables Processing Equipment Market Volume (K Units), by Type 2024 & 2032
- Figure 37: Europe Fruits & Vegetables Processing Equipment Market Revenue Share (%), by Type 2024 & 2032
- Figure 38: Europe Fruits & Vegetables Processing Equipment Market Volume Share (%), by Type 2024 & 2032
- Figure 39: Europe Fruits & Vegetables Processing Equipment Market Revenue (Million), by Country 2024 & 2032
- Figure 40: Europe Fruits & Vegetables Processing Equipment Market Volume (K Units), by Country 2024 & 2032
- Figure 41: Europe Fruits & Vegetables Processing Equipment Market Revenue Share (%), by Country 2024 & 2032
- Figure 42: Europe Fruits & Vegetables Processing Equipment Market Volume Share (%), by Country 2024 & 2032
- Figure 43: Asia Pacific Fruits & Vegetables Processing Equipment Market Revenue (Million), by Type 2024 & 2032
- Figure 44: Asia Pacific Fruits & Vegetables Processing Equipment Market Volume (K Units), by Type 2024 & 2032
- Figure 45: Asia Pacific Fruits & Vegetables Processing Equipment Market Revenue Share (%), by Type 2024 & 2032
- Figure 46: Asia Pacific Fruits & Vegetables Processing Equipment Market Volume Share (%), by Type 2024 & 2032
- Figure 47: Asia Pacific Fruits & Vegetables Processing Equipment Market Revenue (Million), by Country 2024 & 2032
- Figure 48: Asia Pacific Fruits & Vegetables Processing Equipment Market Volume (K Units), by Country 2024 & 2032
- Figure 49: Asia Pacific Fruits & Vegetables Processing Equipment Market Revenue Share (%), by Country 2024 & 2032
- Figure 50: Asia Pacific Fruits & Vegetables Processing Equipment Market Volume Share (%), by Country 2024 & 2032
- Figure 51: South America Fruits & Vegetables Processing Equipment Market Revenue (Million), by Type 2024 & 2032
- Figure 52: South America Fruits & Vegetables Processing Equipment Market Volume (K Units), by Type 2024 & 2032
- Figure 53: South America Fruits & Vegetables Processing Equipment Market Revenue Share (%), by Type 2024 & 2032
- Figure 54: South America Fruits & Vegetables Processing Equipment Market Volume Share (%), by Type 2024 & 2032
- Figure 55: South America Fruits & Vegetables Processing Equipment Market Revenue (Million), by Country 2024 & 2032
- Figure 56: South America Fruits & Vegetables Processing Equipment Market Volume (K Units), by Country 2024 & 2032
- Figure 57: South America Fruits & Vegetables Processing Equipment Market Revenue Share (%), by Country 2024 & 2032
- Figure 58: South America Fruits & Vegetables Processing Equipment Market Volume Share (%), by Country 2024 & 2032
- Figure 59: Middle East Fruits & Vegetables Processing Equipment Market Revenue (Million), by Type 2024 & 2032
- Figure 60: Middle East Fruits & Vegetables Processing Equipment Market Volume (K Units), by Type 2024 & 2032
- Figure 61: Middle East Fruits & Vegetables Processing Equipment Market Revenue Share (%), by Type 2024 & 2032
- Figure 62: Middle East Fruits & Vegetables Processing Equipment Market Volume Share (%), by Type 2024 & 2032
- Figure 63: Middle East Fruits & Vegetables Processing Equipment Market Revenue (Million), by Country 2024 & 2032
- Figure 64: Middle East Fruits & Vegetables Processing Equipment Market Volume (K Units), by Country 2024 & 2032
- Figure 65: Middle East Fruits & Vegetables Processing Equipment Market Revenue Share (%), by Country 2024 & 2032
- Figure 66: Middle East Fruits & Vegetables Processing Equipment Market Volume Share (%), by Country 2024 & 2032
- Figure 67: South Africa Fruits & Vegetables Processing Equipment Market Revenue (Million), by Type 2024 & 2032
- Figure 68: South Africa Fruits & Vegetables Processing Equipment Market Volume (K Units), by Type 2024 & 2032
- Figure 69: South Africa Fruits & Vegetables Processing Equipment Market Revenue Share (%), by Type 2024 & 2032
- Figure 70: South Africa Fruits & Vegetables Processing Equipment Market Volume Share (%), by Type 2024 & 2032
- Figure 71: South Africa Fruits & Vegetables Processing Equipment Market Revenue (Million), by Country 2024 & 2032
- Figure 72: South Africa Fruits & Vegetables Processing Equipment Market Volume (K Units), by Country 2024 & 2032
- Figure 73: South Africa Fruits & Vegetables Processing Equipment Market Revenue Share (%), by Country 2024 & 2032
- Figure 74: South Africa Fruits & Vegetables Processing Equipment Market Volume Share (%), by Country 2024 & 2032
List of Tables
- Table 1: Global Fruits & Vegetables Processing Equipment Market Revenue Million Forecast, by Region 2019 & 2032
- Table 2: Global Fruits & Vegetables Processing Equipment Market Volume K Units Forecast, by Region 2019 & 2032
- Table 3: Global Fruits & Vegetables Processing Equipment Market Revenue Million Forecast, by Type 2019 & 2032
- Table 4: Global Fruits & Vegetables Processing Equipment Market Volume K Units Forecast, by Type 2019 & 2032
- Table 5: Global Fruits & Vegetables Processing Equipment Market Revenue Million Forecast, by Region 2019 & 2032
- Table 6: Global Fruits & Vegetables Processing Equipment Market Volume K Units Forecast, by Region 2019 & 2032
- Table 7: Global Fruits & Vegetables Processing Equipment Market Revenue Million Forecast, by Country 2019 & 2032
- Table 8: Global Fruits & Vegetables Processing Equipment Market Volume K Units Forecast, by Country 2019 & 2032
- Table 9: United States Fruits & Vegetables Processing Equipment Market Revenue (Million) Forecast, by Application 2019 & 2032
- Table 10: United States Fruits & Vegetables Processing Equipment Market Volume (K Units) Forecast, by Application 2019 & 2032
- Table 11: Canada Fruits & Vegetables Processing Equipment Market Revenue (Million) Forecast, by Application 2019 & 2032
- Table 12: Canada Fruits & Vegetables Processing Equipment Market Volume (K Units) Forecast, by Application 2019 & 2032
- Table 13: Mexico Fruits & Vegetables Processing Equipment Market Revenue (Million) Forecast, by Application 2019 & 2032
- Table 14: Mexico Fruits & Vegetables Processing Equipment Market Volume (K Units) Forecast, by Application 2019 & 2032
- Table 15: Rest of North America Fruits & Vegetables Processing Equipment Market Revenue (Million) Forecast, by Application 2019 & 2032
- Table 16: Rest of North America Fruits & Vegetables Processing Equipment Market Volume (K Units) Forecast, by Application 2019 & 2032
- Table 17: Global Fruits & Vegetables Processing Equipment Market Revenue Million Forecast, by Country 2019 & 2032
- Table 18: Global Fruits & Vegetables Processing Equipment Market Volume K Units Forecast, by Country 2019 & 2032
- Table 19: United Kingdom Fruits & Vegetables Processing Equipment Market Revenue (Million) Forecast, by Application 2019 & 2032
- Table 20: United Kingdom Fruits & Vegetables Processing Equipment Market Volume (K Units) Forecast, by Application 2019 & 2032
- Table 21: Germany Fruits & Vegetables Processing Equipment Market Revenue (Million) Forecast, by Application 2019 & 2032
- Table 22: Germany Fruits & Vegetables Processing Equipment Market Volume (K Units) Forecast, by Application 2019 & 2032
- Table 23: France Fruits & Vegetables Processing Equipment Market Revenue (Million) Forecast, by Application 2019 & 2032
- Table 24: France Fruits & Vegetables Processing Equipment Market Volume (K Units) Forecast, by Application 2019 & 2032
- Table 25: Russia Fruits & Vegetables Processing Equipment Market Revenue (Million) Forecast, by Application 2019 & 2032
- Table 26: Russia Fruits & Vegetables Processing Equipment Market Volume (K Units) Forecast, by Application 2019 & 2032
- Table 27: Italy Fruits & Vegetables Processing Equipment Market Revenue (Million) Forecast, by Application 2019 & 2032
- Table 28: Italy Fruits & Vegetables Processing Equipment Market Volume (K Units) Forecast, by Application 2019 & 2032
- Table 29: Spain Fruits & Vegetables Processing Equipment Market Revenue (Million) Forecast, by Application 2019 & 2032
- Table 30: Spain Fruits & Vegetables Processing Equipment Market Volume (K Units) Forecast, by Application 2019 & 2032
- Table 31: Rest of Europe Fruits & Vegetables Processing Equipment Market Revenue (Million) Forecast, by Application 2019 & 2032
- Table 32: Rest of Europe Fruits & Vegetables Processing Equipment Market Volume (K Units) Forecast, by Application 2019 & 2032
- Table 33: Global Fruits & Vegetables Processing Equipment Market Revenue Million Forecast, by Country 2019 & 2032
- Table 34: Global Fruits & Vegetables Processing Equipment Market Volume K Units Forecast, by Country 2019 & 2032
- Table 35: India Fruits & Vegetables Processing Equipment Market Revenue (Million) Forecast, by Application 2019 & 2032
- Table 36: India Fruits & Vegetables Processing Equipment Market Volume (K Units) Forecast, by Application 2019 & 2032
- Table 37: China Fruits & Vegetables Processing Equipment Market Revenue (Million) Forecast, by Application 2019 & 2032
- Table 38: China Fruits & Vegetables Processing Equipment Market Volume (K Units) Forecast, by Application 2019 & 2032
- Table 39: Japan Fruits & Vegetables Processing Equipment Market Revenue (Million) Forecast, by Application 2019 & 2032
- Table 40: Japan Fruits & Vegetables Processing Equipment Market Volume (K Units) Forecast, by Application 2019 & 2032
- Table 41: Australia Fruits & Vegetables Processing Equipment Market Revenue (Million) Forecast, by Application 2019 & 2032
- Table 42: Australia Fruits & Vegetables Processing Equipment Market Volume (K Units) Forecast, by Application 2019 & 2032
- Table 43: Rest of Asia Pacific Fruits & Vegetables Processing Equipment Market Revenue (Million) Forecast, by Application 2019 & 2032
- Table 44: Rest of Asia Pacific Fruits & Vegetables Processing Equipment Market Volume (K Units) Forecast, by Application 2019 & 2032
- Table 45: Global Fruits & Vegetables Processing Equipment Market Revenue Million Forecast, by Country 2019 & 2032
- Table 46: Global Fruits & Vegetables Processing Equipment Market Volume K Units Forecast, by Country 2019 & 2032
- Table 47: Brazil Fruits & Vegetables Processing Equipment Market Revenue (Million) Forecast, by Application 2019 & 2032
- Table 48: Brazil Fruits & Vegetables Processing Equipment Market Volume (K Units) Forecast, by Application 2019 & 2032
- Table 49: Argentina Fruits & Vegetables Processing Equipment Market Revenue (Million) Forecast, by Application 2019 & 2032
- Table 50: Argentina Fruits & Vegetables Processing Equipment Market Volume (K Units) Forecast, by Application 2019 & 2032
- Table 51: Rest of South America Fruits & Vegetables Processing Equipment Market Revenue (Million) Forecast, by Application 2019 & 2032
- Table 52: Rest of South America Fruits & Vegetables Processing Equipment Market Volume (K Units) Forecast, by Application 2019 & 2032
- Table 53: Global Fruits & Vegetables Processing Equipment Market Revenue Million Forecast, by Country 2019 & 2032
- Table 54: Global Fruits & Vegetables Processing Equipment Market Volume K Units Forecast, by Country 2019 & 2032
- Table 55: Fruits & Vegetables Processing Equipment Market Revenue (Million) Forecast, by Application 2019 & 2032
- Table 56: Fruits & Vegetables Processing Equipment Market Volume (K Units) Forecast, by Application 2019 & 2032
- Table 57: Global Fruits & Vegetables Processing Equipment Market Revenue Million Forecast, by Country 2019 & 2032
- Table 58: Global Fruits & Vegetables Processing Equipment Market Volume K Units Forecast, by Country 2019 & 2032
- Table 59: Saudi Arabia Fruits & Vegetables Processing Equipment Market Revenue (Million) Forecast, by Application 2019 & 2032
- Table 60: Saudi Arabia Fruits & Vegetables Processing Equipment Market Volume (K Units) Forecast, by Application 2019 & 2032
- Table 61: Rest of Middle East Fruits & Vegetables Processing Equipment Market Revenue (Million) Forecast, by Application 2019 & 2032
- Table 62: Rest of Middle East Fruits & Vegetables Processing Equipment Market Volume (K Units) Forecast, by Application 2019 & 2032
- Table 63: Global Fruits & Vegetables Processing Equipment Market Revenue Million Forecast, by Type 2019 & 2032
- Table 64: Global Fruits & Vegetables Processing Equipment Market Volume K Units Forecast, by Type 2019 & 2032
- Table 65: Global Fruits & Vegetables Processing Equipment Market Revenue Million Forecast, by Country 2019 & 2032
- Table 66: Global Fruits & Vegetables Processing Equipment Market Volume K Units Forecast, by Country 2019 & 2032
- Table 67: United States Fruits & Vegetables Processing Equipment Market Revenue (Million) Forecast, by Application 2019 & 2032
- Table 68: United States Fruits & Vegetables Processing Equipment Market Volume (K Units) Forecast, by Application 2019 & 2032
- Table 69: Canada Fruits & Vegetables Processing Equipment Market Revenue (Million) Forecast, by Application 2019 & 2032
- Table 70: Canada Fruits & Vegetables Processing Equipment Market Volume (K Units) Forecast, by Application 2019 & 2032
- Table 71: Mexico Fruits & Vegetables Processing Equipment Market Revenue (Million) Forecast, by Application 2019 & 2032
- Table 72: Mexico Fruits & Vegetables Processing Equipment Market Volume (K Units) Forecast, by Application 2019 & 2032
- Table 73: Rest of North America Fruits & Vegetables Processing Equipment Market Revenue (Million) Forecast, by Application 2019 & 2032
- Table 74: Rest of North America Fruits & Vegetables Processing Equipment Market Volume (K Units) Forecast, by Application 2019 & 2032
- Table 75: Global Fruits & Vegetables Processing Equipment Market Revenue Million Forecast, by Type 2019 & 2032
- Table 76: Global Fruits & Vegetables Processing Equipment Market Volume K Units Forecast, by Type 2019 & 2032
- Table 77: Global Fruits & Vegetables Processing Equipment Market Revenue Million Forecast, by Country 2019 & 2032
- Table 78: Global Fruits & Vegetables Processing Equipment Market Volume K Units Forecast, by Country 2019 & 2032
- Table 79: United Kingdom Fruits & Vegetables Processing Equipment Market Revenue (Million) Forecast, by Application 2019 & 2032
- Table 80: United Kingdom Fruits & Vegetables Processing Equipment Market Volume (K Units) Forecast, by Application 2019 & 2032
- Table 81: Germany Fruits & Vegetables Processing Equipment Market Revenue (Million) Forecast, by Application 2019 & 2032
- Table 82: Germany Fruits & Vegetables Processing Equipment Market Volume (K Units) Forecast, by Application 2019 & 2032
- Table 83: France Fruits & Vegetables Processing Equipment Market Revenue (Million) Forecast, by Application 2019 & 2032
- Table 84: France Fruits & Vegetables Processing Equipment Market Volume (K Units) Forecast, by Application 2019 & 2032
- Table 85: Russia Fruits & Vegetables Processing Equipment Market Revenue (Million) Forecast, by Application 2019 & 2032
- Table 86: Russia Fruits & Vegetables Processing Equipment Market Volume (K Units) Forecast, by Application 2019 & 2032
- Table 87: Italy Fruits & Vegetables Processing Equipment Market Revenue (Million) Forecast, by Application 2019 & 2032
- Table 88: Italy Fruits & Vegetables Processing Equipment Market Volume (K Units) Forecast, by Application 2019 & 2032
- Table 89: Spain Fruits & Vegetables Processing Equipment Market Revenue (Million) Forecast, by Application 2019 & 2032
- Table 90: Spain Fruits & Vegetables Processing Equipment Market Volume (K Units) Forecast, by Application 2019 & 2032
- Table 91: Rest of Europe Fruits & Vegetables Processing Equipment Market Revenue (Million) Forecast, by Application 2019 & 2032
- Table 92: Rest of Europe Fruits & Vegetables Processing Equipment Market Volume (K Units) Forecast, by Application 2019 & 2032
- Table 93: Global Fruits & Vegetables Processing Equipment Market Revenue Million Forecast, by Type 2019 & 2032
- Table 94: Global Fruits & Vegetables Processing Equipment Market Volume K Units Forecast, by Type 2019 & 2032
- Table 95: Global Fruits & Vegetables Processing Equipment Market Revenue Million Forecast, by Country 2019 & 2032
- Table 96: Global Fruits & Vegetables Processing Equipment Market Volume K Units Forecast, by Country 2019 & 2032
- Table 97: India Fruits & Vegetables Processing Equipment Market Revenue (Million) Forecast, by Application 2019 & 2032
- Table 98: India Fruits & Vegetables Processing Equipment Market Volume (K Units) Forecast, by Application 2019 & 2032
- Table 99: China Fruits & Vegetables Processing Equipment Market Revenue (Million) Forecast, by Application 2019 & 2032
- Table 100: China Fruits & Vegetables Processing Equipment Market Volume (K Units) Forecast, by Application 2019 & 2032
- Table 101: Japan Fruits & Vegetables Processing Equipment Market Revenue (Million) Forecast, by Application 2019 & 2032
- Table 102: Japan Fruits & Vegetables Processing Equipment Market Volume (K Units) Forecast, by Application 2019 & 2032
- Table 103: Australia Fruits & Vegetables Processing Equipment Market Revenue (Million) Forecast, by Application 2019 & 2032
- Table 104: Australia Fruits & Vegetables Processing Equipment Market Volume (K Units) Forecast, by Application 2019 & 2032
- Table 105: Rest of Asia Pacific Fruits & Vegetables Processing Equipment Market Revenue (Million) Forecast, by Application 2019 & 2032
- Table 106: Rest of Asia Pacific Fruits & Vegetables Processing Equipment Market Volume (K Units) Forecast, by Application 2019 & 2032
- Table 107: Global Fruits & Vegetables Processing Equipment Market Revenue Million Forecast, by Type 2019 & 2032
- Table 108: Global Fruits & Vegetables Processing Equipment Market Volume K Units Forecast, by Type 2019 & 2032
- Table 109: Global Fruits & Vegetables Processing Equipment Market Revenue Million Forecast, by Country 2019 & 2032
- Table 110: Global Fruits & Vegetables Processing Equipment Market Volume K Units Forecast, by Country 2019 & 2032
- Table 111: Brazil Fruits & Vegetables Processing Equipment Market Revenue (Million) Forecast, by Application 2019 & 2032
- Table 112: Brazil Fruits & Vegetables Processing Equipment Market Volume (K Units) Forecast, by Application 2019 & 2032
- Table 113: Argentina Fruits & Vegetables Processing Equipment Market Revenue (Million) Forecast, by Application 2019 & 2032
- Table 114: Argentina Fruits & Vegetables Processing Equipment Market Volume (K Units) Forecast, by Application 2019 & 2032
- Table 115: Rest of South America Fruits & Vegetables Processing Equipment Market Revenue (Million) Forecast, by Application 2019 & 2032
- Table 116: Rest of South America Fruits & Vegetables Processing Equipment Market Volume (K Units) Forecast, by Application 2019 & 2032
- Table 117: Global Fruits & Vegetables Processing Equipment Market Revenue Million Forecast, by Type 2019 & 2032
- Table 118: Global Fruits & Vegetables Processing Equipment Market Volume K Units Forecast, by Type 2019 & 2032
- Table 119: Global Fruits & Vegetables Processing Equipment Market Revenue Million Forecast, by Country 2019 & 2032
- Table 120: Global Fruits & Vegetables Processing Equipment Market Volume K Units Forecast, by Country 2019 & 2032
- Table 121: Global Fruits & Vegetables Processing Equipment Market Revenue Million Forecast, by Type 2019 & 2032
- Table 122: Global Fruits & Vegetables Processing Equipment Market Volume K Units Forecast, by Type 2019 & 2032
- Table 123: Global Fruits & Vegetables Processing Equipment Market Revenue Million Forecast, by Country 2019 & 2032
- Table 124: Global Fruits & Vegetables Processing Equipment Market Volume K Units Forecast, by Country 2019 & 2032
- Table 125: Saudi Arabia Fruits & Vegetables Processing Equipment Market Revenue (Million) Forecast, by Application 2019 & 2032
- Table 126: Saudi Arabia Fruits & Vegetables Processing Equipment Market Volume (K Units) Forecast, by Application 2019 & 2032
- Table 127: Rest of Middle East Fruits & Vegetables Processing Equipment Market Revenue (Million) Forecast, by Application 2019 & 2032
- Table 128: Rest of Middle East Fruits & Vegetables Processing Equipment Market Volume (K Units) Forecast, by Application 2019 & 2032
Frequently Asked Questions
1. What is the projected Compound Annual Growth Rate (CAGR) of the Fruits & Vegetables Processing Equipment Market?
The projected CAGR is approximately 5.77%.
2. Which companies are prominent players in the Fruits & Vegetables Processing Equipment Market?
Key companies in the market include JBT, Navatta Group, Buhler AG, GEA Group Aktiengesellschaft, Krones AG, Haith Tickhill Group of Companies, Syntegon Technology GmbH, Turatti Group*List Not Exhaustive, Allround Vegetable Processing, SVZ Industrial Fruit & Vegetable Ingredients.
3. What are the main segments of the Fruits & Vegetables Processing Equipment Market?
The market segments include Type.
4. Can you provide details about the market size?
The market size is estimated to be USD XX Million as of 2022.
5. What are some drivers contributing to market growth?
Rising Health & Wellness Trends; Strategic Initiatives By Key Players.
6. What are the notable trends driving market growth?
Growing Demand for Convenience Foods.
7. Are there any restraints impacting market growth?
Cost Considerations Coupled With Availability Of Alternatives.
8. Can you provide examples of recent developments in the market?
N/A
9. What pricing options are available for accessing the report?
Pricing options include single-user, multi-user, and enterprise licenses priced at USD 4750, USD 5250, and USD 8750 respectively.
10. Is the market size provided in terms of value or volume?
The market size is provided in terms of value, measured in Million and volume, measured in K Units.
11. Are there any specific market keywords associated with the report?
Yes, the market keyword associated with the report is "Fruits & Vegetables Processing Equipment Market," which aids in identifying and referencing the specific market segment covered.
12. How do I determine which pricing option suits my needs best?
The pricing options vary based on user requirements and access needs. Individual users may opt for single-user licenses, while businesses requiring broader access may choose multi-user or enterprise licenses for cost-effective access to the report.
13. Are there any additional resources or data provided in the Fruits & Vegetables Processing Equipment Market report?
While the report offers comprehensive insights, it's advisable to review the specific contents or supplementary materials provided to ascertain if additional resources or data are available.
14. How can I stay updated on further developments or reports in the Fruits & Vegetables Processing Equipment Market?
To stay informed about further developments, trends, and reports in the Fruits & Vegetables Processing Equipment Market, consider subscribing to industry newsletters, following relevant companies and organizations, or regularly checking reputable industry news sources and publications.
Methodology
Step 1 - Identification of Relevant Samples Size from Population Database


Step 2 - Approaches for Defining Global Market Size (Value, Volume* & Price*)

Note*: In applicable scenarios
Step 3 - Data Sources
Primary Research
- Web Analytics
- Survey Reports
- Research Institute
- Latest Research Reports
- Opinion Leaders
Secondary Research
- Annual Reports
- White Paper
- Latest Press Release
- Industry Association
- Paid Database
- Investor Presentations

Step 4 - Data Triangulation
Involves using different sources of information in order to increase the validity of a study
These sources are likely to be stakeholders in a program - participants, other researchers, program staff, other community members, and so on.
Then we put all data in single framework & apply various statistical tools to find out the dynamic on the market.
During the analysis stage, feedback from the stakeholder groups would be compared to determine areas of agreement as well as areas of divergence


