
Key Insights
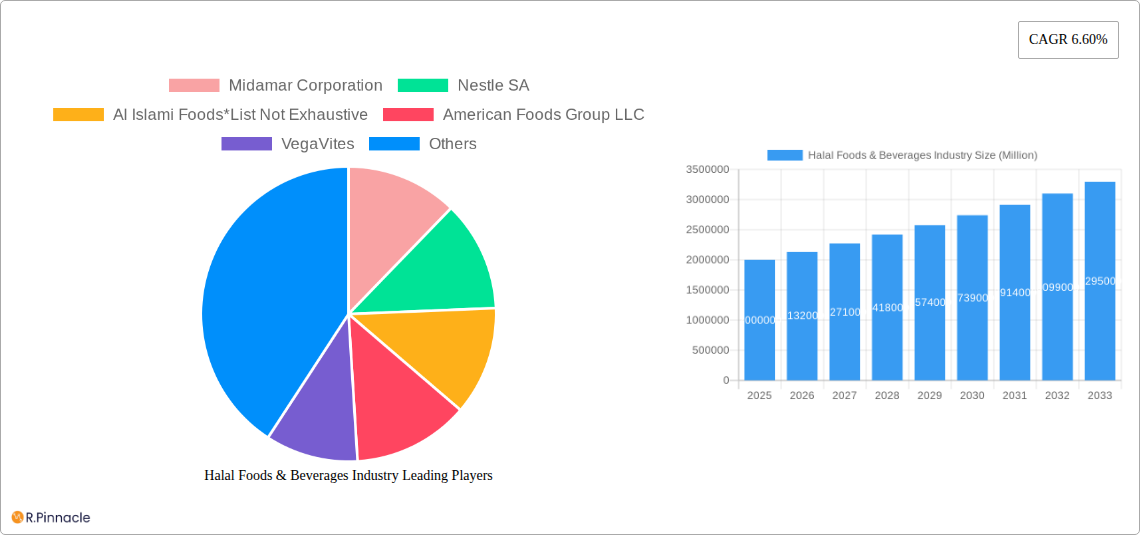
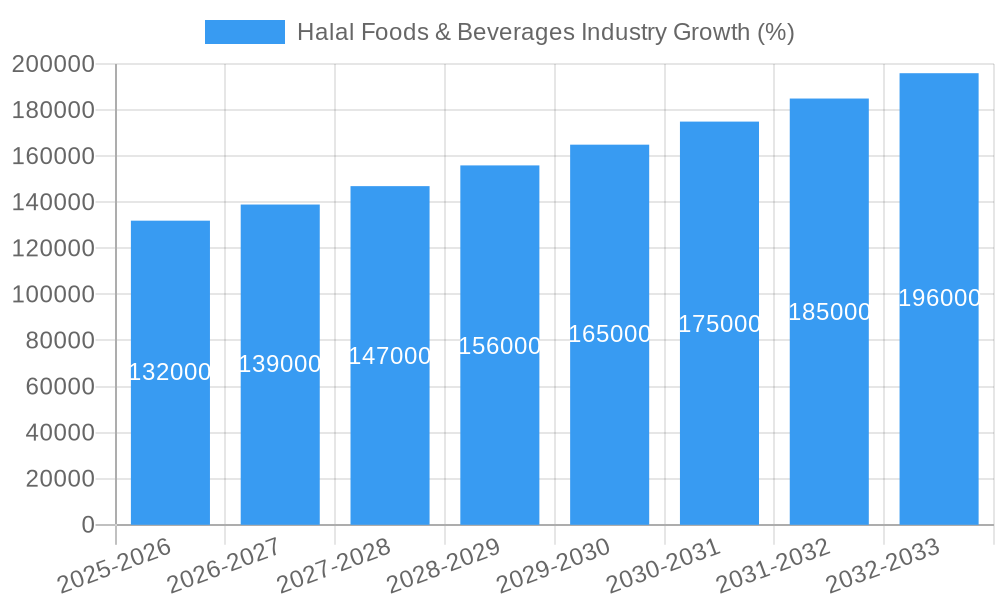
The global Halal food and beverage market, valued at approximately $2 trillion in 2025, is experiencing robust growth, projected to expand at a Compound Annual Growth Rate (CAGR) of 6.60% from 2025 to 2033. This significant expansion is driven by several key factors. The burgeoning Muslim population globally fuels increasing demand for Halal-certified products. Rising consumer awareness regarding health and ethical food choices further contributes to market growth, with many consumers appreciating the quality standards often associated with Halal certification. The increasing availability of Halal products through diverse distribution channels, including supermarkets, convenience stores, and particularly the rapidly growing online retail sector, enhances accessibility and convenience for consumers. Furthermore, innovation in product development, focusing on healthier options and catering to diverse tastes and preferences, is a significant driver. Product diversification within segments like Halal beverages (including functional drinks and healthier options) and Halal supplements contributes significantly to the market's expansion.
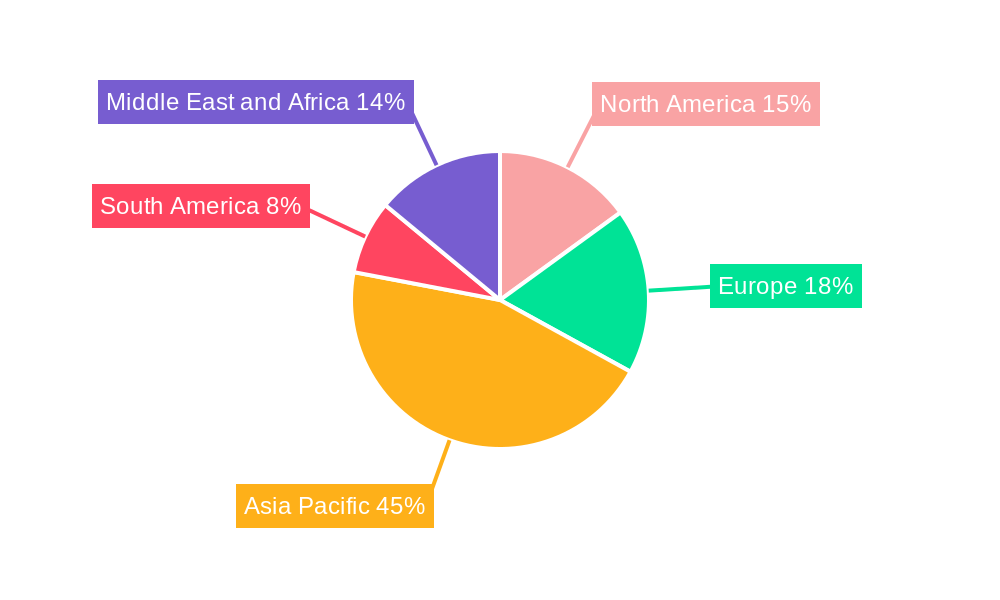
However, the market faces certain challenges. Stringent certification processes and regulatory requirements can present hurdles for manufacturers, particularly smaller businesses. Maintaining consistent quality and supply chain integrity across diverse geographical regions is crucial and requires substantial investment. Fluctuations in raw material prices and economic conditions can impact profitability. Despite these constraints, the long-term outlook remains positive, driven by the underlying demographic trends, increasing consumer awareness, and the ongoing diversification of the Halal food and beverage sector. Specific regional growth varies, with the Asia Pacific region expected to lead due to its large Muslim population and expanding middle class. North America and Europe will experience steady growth, propelled by increasing multiculturalism and growing demand for ethically sourced and healthy foods.
Halal Foods & Beverages Industry: Market Analysis Report (2019-2033)
This comprehensive report provides an in-depth analysis of the Halal Foods & Beverages industry, offering invaluable insights for industry professionals, investors, and stakeholders. With a focus on market dynamics, segmentation, and future trends, this report covers the period from 2019 to 2033, with a base year of 2025 and a forecast period from 2025 to 2033. The global Halal Foods & Beverages market is projected to reach xx Million by 2033, exhibiting a CAGR of xx% during the forecast period.
Halal Foods & Beverages Industry Market Structure & Innovation Trends
The Halal Foods & Beverages industry exhibits a moderately concentrated market structure, with key players like Midamar Corporation, Nestle SA, and Al Islami Foods holding significant market share. However, the presence of numerous smaller players and regional brands indicates a competitive landscape. Innovation is driven by increasing consumer demand for healthier, more convenient, and diverse Halal products. Regulatory frameworks, varying across regions, play a significant role in shaping product development and market access. Product substitutes, primarily conventional food and beverages, pose a constant challenge. The end-user demographic is largely driven by the growing Muslim population globally, with a focus on younger consumers seeking convenient and ethically sourced products. M&A activities are anticipated to increase with estimated deal values totaling xx Million in the next 5 years, fueled by the desire for market expansion and enhanced product portfolios. Market share for the top three players is estimated at xx%.
Halal Foods & Beverages Industry Market Dynamics & Trends
The Halal Foods & Beverages market is experiencing robust growth, driven by several key factors. The expanding global Muslim population is a primary driver, increasing demand for certified Halal products. Rising disposable incomes in emerging economies are further fueling consumption. Technological advancements in food processing and packaging are enhancing product quality, shelf life, and convenience. Consumer preferences are shifting towards healthier, more natural, and ethically sourced Halal options, leading to innovation in product formulation and ingredients. Competitive dynamics are characterized by both established multinational players and smaller, niche brands, creating a diverse and dynamic market. The increasing adoption of online retail channels is reshaping distribution strategies. The market penetration of Halal products varies across regions, with higher penetration observed in Muslim-majority countries. The industry is expected to maintain a steady growth trajectory, driven by increased consumer awareness, evolving dietary preferences, and expanding distribution networks.
Dominant Regions & Segments in Halal Foods & Beverages Industry
The Asia-Pacific region currently dominates the Halal Foods & Beverages market, driven by a large Muslim population and strong economic growth. Key drivers include:
- Strong economic growth: Increased disposable incomes lead to higher spending on food and beverages.
- Favorable government policies: Supportive regulations and incentives promote the growth of the Halal industry.
- Well-developed infrastructure: Efficient supply chains and distribution networks facilitate market access.
Other significant regions include the Middle East and North Africa, followed by Southeast Asia. Within the segments, Halal food holds the largest market share, followed by Halal beverages. Supermarkets/hypermarkets are the dominant distribution channel, followed by convenience stores and online retail stores, which are experiencing rapid growth.
Halal Foods & Beverages Industry Product Innovations
Recent product innovations focus on healthier options, such as plant-based Halal meat alternatives and functional beverages enriched with vitamins and minerals. Technological advancements in food processing and packaging are enhancing product quality and shelf life, catering to consumer demands for convenience and longer expiration dates. Products emphasizing natural ingredients and sustainability are gaining significant traction, reflecting a wider consumer trend towards ethical consumption. These innovations are enhancing the competitive advantage of players by addressing specific consumer preferences and market gaps.
Report Scope & Segmentation Analysis
This report segments the Halal Foods & Beverages market by type (Halal Food, Halal Beverages, Halal Supplements) and distribution channel (Supermarkets/Hypermarkets, Convenience Stores, Online Retail Stores, Other Distribution Channels). Each segment presents unique growth projections and competitive dynamics. For instance, the Halal food segment is expected to witness significant growth due to the increasing popularity of ready-to-eat meals and convenience foods. Similarly, online retail is expected to exhibit high growth rates driven by increasing internet penetration and consumer preference for online shopping. Market sizes for each segment are estimated to reach xx Million by 2033.
Key Drivers of Halal Foods & Beverages Industry Growth
Several factors drive the growth of the Halal Foods & Beverages industry. The burgeoning Muslim population globally is the most significant driver, leading to increased demand. Rising disposable incomes, particularly in developing countries, contribute to increased consumption. Government initiatives and supportive regulatory frameworks in many countries facilitate the industry's expansion. Technological advancements in food processing, packaging, and distribution further propel market growth.
Challenges in the Halal Foods & Beverages Industry Sector
The Halal Foods & Beverages industry faces various challenges. Maintaining consistent Halal certification and traceability across the supply chain is crucial and can be complex. Ensuring compliance with diverse regional regulations presents a considerable obstacle. Competitive pressures from both established and emerging players require constant innovation and adaptation. Fluctuating raw material prices and supply chain disruptions impact profitability. The estimated cost of regulatory compliance adds xx Million annually to industry expenses.
Emerging Opportunities in Halal Foods & Beverages Industry
The Halal Foods & Beverages industry presents several emerging opportunities. The expansion into new markets, particularly in developing countries with growing Muslim populations, offers significant potential. Developing innovative Halal products catering to specific dietary needs and preferences (e.g., vegan, organic) creates new market niches. Leveraging digital marketing and e-commerce channels enhances market reach and efficiency.
Leading Players in the Halal Foods & Beverages Industry Market
- Midamar Corporation
- Nestle SA
- Al Islami Foods
- American Foods Group LLC
- VegaVites
- Crescent Foods Inc
- Ferrero International SA
- American Halal Company Inc
- BRF SA
- JBS SA
Key Developments in Halal Foods & Beverages Industry Industry
- 2022-03: Nestle SA launched a new line of Halal-certified confectionery products in the Middle East.
- 2021-11: Midamar Corporation acquired a new processing facility to increase production capacity.
- 2020-09: Al Islami Foods partnered with a major retailer to expand its distribution network. (Further developments will be added in the full report)
Future Outlook for Halal Foods & Beverages Industry Market
The Halal Foods & Beverages market is poised for continued strong growth, driven by a combination of factors including the expanding global Muslim population, rising disposable incomes, and increasing demand for convenient and healthier food options. Strategic opportunities exist in leveraging technological advancements, expanding into new markets, and fostering collaborations across the value chain. The market is expected to reach xx Million by 2033, reflecting a promising future for the industry.
Halal Foods & Beverages Industry Segmentation
-
1. Type
- 1.1. Halal Food
- 1.2. Halal Beverages
- 1.3. Halal Supplements
-
2. Distribution Channel
- 2.1. Supermarkets and Hypermarkets
- 2.2. Convenience Stores
- 2.3. Online Retail Stores
- 2.4. Other Distribution Channels
Halal Foods & Beverages Industry Segmentation By Geography
-
1. North America
- 1.1. United States
- 1.2. Canada
- 1.3. Mexico
- 1.4. Rest of North America
-
2. Europe
- 2.1. Germany
- 2.2. United Kingdom
- 2.3. Spain
- 2.4. France
- 2.5. Italy
- 2.6. Russia
- 2.7. Rest of Europe
-
3. Asia Pacific
- 3.1. China
- 3.2. Japan
- 3.3. India
- 3.4. Australia
- 3.5. Indonesia
- 3.6. Malaysia
- 3.7. Singapore
- 3.8. Rest of Asia Pacific
-
4. South America
- 4.1. Brazil
- 4.2. Argentina
- 4.3. Rest of South America
-
5. Middle East and Africa
- 5.1. South Africa
- 5.2. Egypt
- 5.3. Saudi Arabia
- 5.4. United Arab Emirates
- 5.5. Oman
- 5.6. Rest of Middle East and Africa
Halal Foods & Beverages Industry REPORT HIGHLIGHTS
| Aspects | Details |
|---|---|
| Study Period | 2019-2033 |
| Base Year | 2024 |
| Estimated Year | 2025 |
| Forecast Period | 2025-2033 |
| Historical Period | 2019-2024 |
| Growth Rate | CAGR of 6.60% from 2019-2033 |
| Segmentation |
|
Table of Contents
- 1. Introduction
- 1.1. Research Scope
- 1.2. Market Segmentation
- 1.3. Research Methodology
- 1.4. Definitions and Assumptions
- 2. Executive Summary
- 2.1. Introduction
- 3. Market Dynamics
- 3.1. Introduction
- 3.2. Market Drivers
- 3.2.1. Demand for specialty and organic coffee pods and capsules; Innovations in packaging formats
- 3.3. Market Restrains
- 3.3.1. Availability of counterfeit products
- 3.4. Market Trends
- 3.4.1. Increasing Muslim Expatriate Population
- 4. Market Factor Analysis
- 4.1. Porters Five Forces
- 4.2. Supply/Value Chain
- 4.3. PESTEL analysis
- 4.4. Market Entropy
- 4.5. Patent/Trademark Analysis
- 5. Global Halal Foods & Beverages Industry Analysis, Insights and Forecast, 2019-2031
- 5.1. Market Analysis, Insights and Forecast - by Type
- 5.1.1. Halal Food
- 5.1.2. Halal Beverages
- 5.1.3. Halal Supplements
- 5.2. Market Analysis, Insights and Forecast - by Distribution Channel
- 5.2.1. Supermarkets and Hypermarkets
- 5.2.2. Convenience Stores
- 5.2.3. Online Retail Stores
- 5.2.4. Other Distribution Channels
- 5.3. Market Analysis, Insights and Forecast - by Region
- 5.3.1. North America
- 5.3.2. Europe
- 5.3.3. Asia Pacific
- 5.3.4. South America
- 5.3.5. Middle East and Africa
- 5.1. Market Analysis, Insights and Forecast - by Type
- 6. North America Halal Foods & Beverages Industry Analysis, Insights and Forecast, 2019-2031
- 6.1. Market Analysis, Insights and Forecast - by Type
- 6.1.1. Halal Food
- 6.1.2. Halal Beverages
- 6.1.3. Halal Supplements
- 6.2. Market Analysis, Insights and Forecast - by Distribution Channel
- 6.2.1. Supermarkets and Hypermarkets
- 6.2.2. Convenience Stores
- 6.2.3. Online Retail Stores
- 6.2.4. Other Distribution Channels
- 6.1. Market Analysis, Insights and Forecast - by Type
- 7. Europe Halal Foods & Beverages Industry Analysis, Insights and Forecast, 2019-2031
- 7.1. Market Analysis, Insights and Forecast - by Type
- 7.1.1. Halal Food
- 7.1.2. Halal Beverages
- 7.1.3. Halal Supplements
- 7.2. Market Analysis, Insights and Forecast - by Distribution Channel
- 7.2.1. Supermarkets and Hypermarkets
- 7.2.2. Convenience Stores
- 7.2.3. Online Retail Stores
- 7.2.4. Other Distribution Channels
- 7.1. Market Analysis, Insights and Forecast - by Type
- 8. Asia Pacific Halal Foods & Beverages Industry Analysis, Insights and Forecast, 2019-2031
- 8.1. Market Analysis, Insights and Forecast - by Type
- 8.1.1. Halal Food
- 8.1.2. Halal Beverages
- 8.1.3. Halal Supplements
- 8.2. Market Analysis, Insights and Forecast - by Distribution Channel
- 8.2.1. Supermarkets and Hypermarkets
- 8.2.2. Convenience Stores
- 8.2.3. Online Retail Stores
- 8.2.4. Other Distribution Channels
- 8.1. Market Analysis, Insights and Forecast - by Type
- 9. South America Halal Foods & Beverages Industry Analysis, Insights and Forecast, 2019-2031
- 9.1. Market Analysis, Insights and Forecast - by Type
- 9.1.1. Halal Food
- 9.1.2. Halal Beverages
- 9.1.3. Halal Supplements
- 9.2. Market Analysis, Insights and Forecast - by Distribution Channel
- 9.2.1. Supermarkets and Hypermarkets
- 9.2.2. Convenience Stores
- 9.2.3. Online Retail Stores
- 9.2.4. Other Distribution Channels
- 9.1. Market Analysis, Insights and Forecast - by Type
- 10. Middle East and Africa Halal Foods & Beverages Industry Analysis, Insights and Forecast, 2019-2031
- 10.1. Market Analysis, Insights and Forecast - by Type
- 10.1.1. Halal Food
- 10.1.2. Halal Beverages
- 10.1.3. Halal Supplements
- 10.2. Market Analysis, Insights and Forecast - by Distribution Channel
- 10.2.1. Supermarkets and Hypermarkets
- 10.2.2. Convenience Stores
- 10.2.3. Online Retail Stores
- 10.2.4. Other Distribution Channels
- 10.1. Market Analysis, Insights and Forecast - by Type
- 11. North America Halal Foods & Beverages Industry Analysis, Insights and Forecast, 2019-2031
- 11.1. Market Analysis, Insights and Forecast - By Country/Sub-region
- 11.1.1 United States
- 11.1.2 Canada
- 11.1.3 Mexico
- 11.1.4 Rest of North America
- 12. Europe Halal Foods & Beverages Industry Analysis, Insights and Forecast, 2019-2031
- 12.1. Market Analysis, Insights and Forecast - By Country/Sub-region
- 12.1.1 Germany
- 12.1.2 United Kingdom
- 12.1.3 Spain
- 12.1.4 France
- 12.1.5 Italy
- 12.1.6 Russia
- 12.1.7 Rest of Europe
- 13. Asia Pacific Halal Foods & Beverages Industry Analysis, Insights and Forecast, 2019-2031
- 13.1. Market Analysis, Insights and Forecast - By Country/Sub-region
- 13.1.1 China
- 13.1.2 Japan
- 13.1.3 India
- 13.1.4 Australia
- 13.1.5 Indonesia
- 13.1.6 Malaysia
- 13.1.7 Singapore
- 13.1.8 Rest of Asia Pacific
- 14. South America Halal Foods & Beverages Industry Analysis, Insights and Forecast, 2019-2031
- 14.1. Market Analysis, Insights and Forecast - By Country/Sub-region
- 14.1.1 Brazil
- 14.1.2 Argentina
- 14.1.3 Rest of South America
- 15. Middle East and Africa Halal Foods & Beverages Industry Analysis, Insights and Forecast, 2019-2031
- 15.1. Market Analysis, Insights and Forecast - By Country/Sub-region
- 15.1.1 South Africa
- 15.1.2 Egypt
- 15.1.3 Saudi Arabia
- 15.1.4 United Arab Emirates
- 15.1.5 Oman
- 15.1.6 Rest of Middle East and Africa
- 16. Competitive Analysis
- 16.1. Global Market Share Analysis 2024
- 16.2. Company Profiles
- 16.2.1 Midamar Corporation
- 16.2.1.1. Overview
- 16.2.1.2. Products
- 16.2.1.3. SWOT Analysis
- 16.2.1.4. Recent Developments
- 16.2.1.5. Financials (Based on Availability)
- 16.2.2 Nestle SA
- 16.2.2.1. Overview
- 16.2.2.2. Products
- 16.2.2.3. SWOT Analysis
- 16.2.2.4. Recent Developments
- 16.2.2.5. Financials (Based on Availability)
- 16.2.3 Al Islami Foods*List Not Exhaustive
- 16.2.3.1. Overview
- 16.2.3.2. Products
- 16.2.3.3. SWOT Analysis
- 16.2.3.4. Recent Developments
- 16.2.3.5. Financials (Based on Availability)
- 16.2.4 American Foods Group LLC
- 16.2.4.1. Overview
- 16.2.4.2. Products
- 16.2.4.3. SWOT Analysis
- 16.2.4.4. Recent Developments
- 16.2.4.5. Financials (Based on Availability)
- 16.2.5 VegaVites
- 16.2.5.1. Overview
- 16.2.5.2. Products
- 16.2.5.3. SWOT Analysis
- 16.2.5.4. Recent Developments
- 16.2.5.5. Financials (Based on Availability)
- 16.2.6 Crescent Foods Inc
- 16.2.6.1. Overview
- 16.2.6.2. Products
- 16.2.6.3. SWOT Analysis
- 16.2.6.4. Recent Developments
- 16.2.6.5. Financials (Based on Availability)
- 16.2.7 Ferrero International SA
- 16.2.7.1. Overview
- 16.2.7.2. Products
- 16.2.7.3. SWOT Analysis
- 16.2.7.4. Recent Developments
- 16.2.7.5. Financials (Based on Availability)
- 16.2.8 American Halal Company Inc
- 16.2.8.1. Overview
- 16.2.8.2. Products
- 16.2.8.3. SWOT Analysis
- 16.2.8.4. Recent Developments
- 16.2.8.5. Financials (Based on Availability)
- 16.2.9 BRF SA
- 16.2.9.1. Overview
- 16.2.9.2. Products
- 16.2.9.3. SWOT Analysis
- 16.2.9.4. Recent Developments
- 16.2.9.5. Financials (Based on Availability)
- 16.2.10 JBS SA
- 16.2.10.1. Overview
- 16.2.10.2. Products
- 16.2.10.3. SWOT Analysis
- 16.2.10.4. Recent Developments
- 16.2.10.5. Financials (Based on Availability)
- 16.2.1 Midamar Corporation
List of Figures
- Figure 1: Global Halal Foods & Beverages Industry Revenue Breakdown (Million, %) by Region 2024 & 2032
- Figure 2: North America Halal Foods & Beverages Industry Revenue (Million), by Country 2024 & 2032
- Figure 3: North America Halal Foods & Beverages Industry Revenue Share (%), by Country 2024 & 2032
- Figure 4: Europe Halal Foods & Beverages Industry Revenue (Million), by Country 2024 & 2032
- Figure 5: Europe Halal Foods & Beverages Industry Revenue Share (%), by Country 2024 & 2032
- Figure 6: Asia Pacific Halal Foods & Beverages Industry Revenue (Million), by Country 2024 & 2032
- Figure 7: Asia Pacific Halal Foods & Beverages Industry Revenue Share (%), by Country 2024 & 2032
- Figure 8: South America Halal Foods & Beverages Industry Revenue (Million), by Country 2024 & 2032
- Figure 9: South America Halal Foods & Beverages Industry Revenue Share (%), by Country 2024 & 2032
- Figure 10: Middle East and Africa Halal Foods & Beverages Industry Revenue (Million), by Country 2024 & 2032
- Figure 11: Middle East and Africa Halal Foods & Beverages Industry Revenue Share (%), by Country 2024 & 2032
- Figure 12: North America Halal Foods & Beverages Industry Revenue (Million), by Type 2024 & 2032
- Figure 13: North America Halal Foods & Beverages Industry Revenue Share (%), by Type 2024 & 2032
- Figure 14: North America Halal Foods & Beverages Industry Revenue (Million), by Distribution Channel 2024 & 2032
- Figure 15: North America Halal Foods & Beverages Industry Revenue Share (%), by Distribution Channel 2024 & 2032
- Figure 16: North America Halal Foods & Beverages Industry Revenue (Million), by Country 2024 & 2032
- Figure 17: North America Halal Foods & Beverages Industry Revenue Share (%), by Country 2024 & 2032
- Figure 18: Europe Halal Foods & Beverages Industry Revenue (Million), by Type 2024 & 2032
- Figure 19: Europe Halal Foods & Beverages Industry Revenue Share (%), by Type 2024 & 2032
- Figure 20: Europe Halal Foods & Beverages Industry Revenue (Million), by Distribution Channel 2024 & 2032
- Figure 21: Europe Halal Foods & Beverages Industry Revenue Share (%), by Distribution Channel 2024 & 2032
- Figure 22: Europe Halal Foods & Beverages Industry Revenue (Million), by Country 2024 & 2032
- Figure 23: Europe Halal Foods & Beverages Industry Revenue Share (%), by Country 2024 & 2032
- Figure 24: Asia Pacific Halal Foods & Beverages Industry Revenue (Million), by Type 2024 & 2032
- Figure 25: Asia Pacific Halal Foods & Beverages Industry Revenue Share (%), by Type 2024 & 2032
- Figure 26: Asia Pacific Halal Foods & Beverages Industry Revenue (Million), by Distribution Channel 2024 & 2032
- Figure 27: Asia Pacific Halal Foods & Beverages Industry Revenue Share (%), by Distribution Channel 2024 & 2032
- Figure 28: Asia Pacific Halal Foods & Beverages Industry Revenue (Million), by Country 2024 & 2032
- Figure 29: Asia Pacific Halal Foods & Beverages Industry Revenue Share (%), by Country 2024 & 2032
- Figure 30: South America Halal Foods & Beverages Industry Revenue (Million), by Type 2024 & 2032
- Figure 31: South America Halal Foods & Beverages Industry Revenue Share (%), by Type 2024 & 2032
- Figure 32: South America Halal Foods & Beverages Industry Revenue (Million), by Distribution Channel 2024 & 2032
- Figure 33: South America Halal Foods & Beverages Industry Revenue Share (%), by Distribution Channel 2024 & 2032
- Figure 34: South America Halal Foods & Beverages Industry Revenue (Million), by Country 2024 & 2032
- Figure 35: South America Halal Foods & Beverages Industry Revenue Share (%), by Country 2024 & 2032
- Figure 36: Middle East and Africa Halal Foods & Beverages Industry Revenue (Million), by Type 2024 & 2032
- Figure 37: Middle East and Africa Halal Foods & Beverages Industry Revenue Share (%), by Type 2024 & 2032
- Figure 38: Middle East and Africa Halal Foods & Beverages Industry Revenue (Million), by Distribution Channel 2024 & 2032
- Figure 39: Middle East and Africa Halal Foods & Beverages Industry Revenue Share (%), by Distribution Channel 2024 & 2032
- Figure 40: Middle East and Africa Halal Foods & Beverages Industry Revenue (Million), by Country 2024 & 2032
- Figure 41: Middle East and Africa Halal Foods & Beverages Industry Revenue Share (%), by Country 2024 & 2032
List of Tables
- Table 1: Global Halal Foods & Beverages Industry Revenue Million Forecast, by Region 2019 & 2032
- Table 2: Global Halal Foods & Beverages Industry Revenue Million Forecast, by Type 2019 & 2032
- Table 3: Global Halal Foods & Beverages Industry Revenue Million Forecast, by Distribution Channel 2019 & 2032
- Table 4: Global Halal Foods & Beverages Industry Revenue Million Forecast, by Region 2019 & 2032
- Table 5: Global Halal Foods & Beverages Industry Revenue Million Forecast, by Country 2019 & 2032
- Table 6: United States Halal Foods & Beverages Industry Revenue (Million) Forecast, by Application 2019 & 2032
- Table 7: Canada Halal Foods & Beverages Industry Revenue (Million) Forecast, by Application 2019 & 2032
- Table 8: Mexico Halal Foods & Beverages Industry Revenue (Million) Forecast, by Application 2019 & 2032
- Table 9: Rest of North America Halal Foods & Beverages Industry Revenue (Million) Forecast, by Application 2019 & 2032
- Table 10: Global Halal Foods & Beverages Industry Revenue Million Forecast, by Country 2019 & 2032
- Table 11: Germany Halal Foods & Beverages Industry Revenue (Million) Forecast, by Application 2019 & 2032
- Table 12: United Kingdom Halal Foods & Beverages Industry Revenue (Million) Forecast, by Application 2019 & 2032
- Table 13: Spain Halal Foods & Beverages Industry Revenue (Million) Forecast, by Application 2019 & 2032
- Table 14: France Halal Foods & Beverages Industry Revenue (Million) Forecast, by Application 2019 & 2032
- Table 15: Italy Halal Foods & Beverages Industry Revenue (Million) Forecast, by Application 2019 & 2032
- Table 16: Russia Halal Foods & Beverages Industry Revenue (Million) Forecast, by Application 2019 & 2032
- Table 17: Rest of Europe Halal Foods & Beverages Industry Revenue (Million) Forecast, by Application 2019 & 2032
- Table 18: Global Halal Foods & Beverages Industry Revenue Million Forecast, by Country 2019 & 2032
- Table 19: China Halal Foods & Beverages Industry Revenue (Million) Forecast, by Application 2019 & 2032
- Table 20: Japan Halal Foods & Beverages Industry Revenue (Million) Forecast, by Application 2019 & 2032
- Table 21: India Halal Foods & Beverages Industry Revenue (Million) Forecast, by Application 2019 & 2032
- Table 22: Australia Halal Foods & Beverages Industry Revenue (Million) Forecast, by Application 2019 & 2032
- Table 23: Indonesia Halal Foods & Beverages Industry Revenue (Million) Forecast, by Application 2019 & 2032
- Table 24: Malaysia Halal Foods & Beverages Industry Revenue (Million) Forecast, by Application 2019 & 2032
- Table 25: Singapore Halal Foods & Beverages Industry Revenue (Million) Forecast, by Application 2019 & 2032
- Table 26: Rest of Asia Pacific Halal Foods & Beverages Industry Revenue (Million) Forecast, by Application 2019 & 2032
- Table 27: Global Halal Foods & Beverages Industry Revenue Million Forecast, by Country 2019 & 2032
- Table 28: Brazil Halal Foods & Beverages Industry Revenue (Million) Forecast, by Application 2019 & 2032
- Table 29: Argentina Halal Foods & Beverages Industry Revenue (Million) Forecast, by Application 2019 & 2032
- Table 30: Rest of South America Halal Foods & Beverages Industry Revenue (Million) Forecast, by Application 2019 & 2032
- Table 31: Global Halal Foods & Beverages Industry Revenue Million Forecast, by Country 2019 & 2032
- Table 32: South Africa Halal Foods & Beverages Industry Revenue (Million) Forecast, by Application 2019 & 2032
- Table 33: Egypt Halal Foods & Beverages Industry Revenue (Million) Forecast, by Application 2019 & 2032
- Table 34: Saudi Arabia Halal Foods & Beverages Industry Revenue (Million) Forecast, by Application 2019 & 2032
- Table 35: United Arab Emirates Halal Foods & Beverages Industry Revenue (Million) Forecast, by Application 2019 & 2032
- Table 36: Oman Halal Foods & Beverages Industry Revenue (Million) Forecast, by Application 2019 & 2032
- Table 37: Rest of Middle East and Africa Halal Foods & Beverages Industry Revenue (Million) Forecast, by Application 2019 & 2032
- Table 38: Global Halal Foods & Beverages Industry Revenue Million Forecast, by Type 2019 & 2032
- Table 39: Global Halal Foods & Beverages Industry Revenue Million Forecast, by Distribution Channel 2019 & 2032
- Table 40: Global Halal Foods & Beverages Industry Revenue Million Forecast, by Country 2019 & 2032
- Table 41: United States Halal Foods & Beverages Industry Revenue (Million) Forecast, by Application 2019 & 2032
- Table 42: Canada Halal Foods & Beverages Industry Revenue (Million) Forecast, by Application 2019 & 2032
- Table 43: Mexico Halal Foods & Beverages Industry Revenue (Million) Forecast, by Application 2019 & 2032
- Table 44: Rest of North America Halal Foods & Beverages Industry Revenue (Million) Forecast, by Application 2019 & 2032
- Table 45: Global Halal Foods & Beverages Industry Revenue Million Forecast, by Type 2019 & 2032
- Table 46: Global Halal Foods & Beverages Industry Revenue Million Forecast, by Distribution Channel 2019 & 2032
- Table 47: Global Halal Foods & Beverages Industry Revenue Million Forecast, by Country 2019 & 2032
- Table 48: Germany Halal Foods & Beverages Industry Revenue (Million) Forecast, by Application 2019 & 2032
- Table 49: United Kingdom Halal Foods & Beverages Industry Revenue (Million) Forecast, by Application 2019 & 2032
- Table 50: Spain Halal Foods & Beverages Industry Revenue (Million) Forecast, by Application 2019 & 2032
- Table 51: France Halal Foods & Beverages Industry Revenue (Million) Forecast, by Application 2019 & 2032
- Table 52: Italy Halal Foods & Beverages Industry Revenue (Million) Forecast, by Application 2019 & 2032
- Table 53: Russia Halal Foods & Beverages Industry Revenue (Million) Forecast, by Application 2019 & 2032
- Table 54: Rest of Europe Halal Foods & Beverages Industry Revenue (Million) Forecast, by Application 2019 & 2032
- Table 55: Global Halal Foods & Beverages Industry Revenue Million Forecast, by Type 2019 & 2032
- Table 56: Global Halal Foods & Beverages Industry Revenue Million Forecast, by Distribution Channel 2019 & 2032
- Table 57: Global Halal Foods & Beverages Industry Revenue Million Forecast, by Country 2019 & 2032
- Table 58: China Halal Foods & Beverages Industry Revenue (Million) Forecast, by Application 2019 & 2032
- Table 59: Japan Halal Foods & Beverages Industry Revenue (Million) Forecast, by Application 2019 & 2032
- Table 60: India Halal Foods & Beverages Industry Revenue (Million) Forecast, by Application 2019 & 2032
- Table 61: Australia Halal Foods & Beverages Industry Revenue (Million) Forecast, by Application 2019 & 2032
- Table 62: Indonesia Halal Foods & Beverages Industry Revenue (Million) Forecast, by Application 2019 & 2032
- Table 63: Malaysia Halal Foods & Beverages Industry Revenue (Million) Forecast, by Application 2019 & 2032
- Table 64: Singapore Halal Foods & Beverages Industry Revenue (Million) Forecast, by Application 2019 & 2032
- Table 65: Rest of Asia Pacific Halal Foods & Beverages Industry Revenue (Million) Forecast, by Application 2019 & 2032
- Table 66: Global Halal Foods & Beverages Industry Revenue Million Forecast, by Type 2019 & 2032
- Table 67: Global Halal Foods & Beverages Industry Revenue Million Forecast, by Distribution Channel 2019 & 2032
- Table 68: Global Halal Foods & Beverages Industry Revenue Million Forecast, by Country 2019 & 2032
- Table 69: Brazil Halal Foods & Beverages Industry Revenue (Million) Forecast, by Application 2019 & 2032
- Table 70: Argentina Halal Foods & Beverages Industry Revenue (Million) Forecast, by Application 2019 & 2032
- Table 71: Rest of South America Halal Foods & Beverages Industry Revenue (Million) Forecast, by Application 2019 & 2032
- Table 72: Global Halal Foods & Beverages Industry Revenue Million Forecast, by Type 2019 & 2032
- Table 73: Global Halal Foods & Beverages Industry Revenue Million Forecast, by Distribution Channel 2019 & 2032
- Table 74: Global Halal Foods & Beverages Industry Revenue Million Forecast, by Country 2019 & 2032
- Table 75: South Africa Halal Foods & Beverages Industry Revenue (Million) Forecast, by Application 2019 & 2032
- Table 76: Egypt Halal Foods & Beverages Industry Revenue (Million) Forecast, by Application 2019 & 2032
- Table 77: Saudi Arabia Halal Foods & Beverages Industry Revenue (Million) Forecast, by Application 2019 & 2032
- Table 78: United Arab Emirates Halal Foods & Beverages Industry Revenue (Million) Forecast, by Application 2019 & 2032
- Table 79: Oman Halal Foods & Beverages Industry Revenue (Million) Forecast, by Application 2019 & 2032
- Table 80: Rest of Middle East and Africa Halal Foods & Beverages Industry Revenue (Million) Forecast, by Application 2019 & 2032
Frequently Asked Questions
1. What is the projected Compound Annual Growth Rate (CAGR) of the Halal Foods & Beverages Industry?
The projected CAGR is approximately 6.60%.
2. Which companies are prominent players in the Halal Foods & Beverages Industry?
Key companies in the market include Midamar Corporation, Nestle SA, Al Islami Foods*List Not Exhaustive, American Foods Group LLC, VegaVites, Crescent Foods Inc, Ferrero International SA, American Halal Company Inc, BRF SA, JBS SA.
3. What are the main segments of the Halal Foods & Beverages Industry?
The market segments include Type, Distribution Channel.
4. Can you provide details about the market size?
The market size is estimated to be USD XX Million as of 2022.
5. What are some drivers contributing to market growth?
Demand for specialty and organic coffee pods and capsules; Innovations in packaging formats.
6. What are the notable trends driving market growth?
Increasing Muslim Expatriate Population.
7. Are there any restraints impacting market growth?
Availability of counterfeit products.
8. Can you provide examples of recent developments in the market?
N/A
9. What pricing options are available for accessing the report?
Pricing options include single-user, multi-user, and enterprise licenses priced at USD 4750, USD 5250, and USD 8750 respectively.
10. Is the market size provided in terms of value or volume?
The market size is provided in terms of value, measured in Million.
11. Are there any specific market keywords associated with the report?
Yes, the market keyword associated with the report is "Halal Foods & Beverages Industry," which aids in identifying and referencing the specific market segment covered.
12. How do I determine which pricing option suits my needs best?
The pricing options vary based on user requirements and access needs. Individual users may opt for single-user licenses, while businesses requiring broader access may choose multi-user or enterprise licenses for cost-effective access to the report.
13. Are there any additional resources or data provided in the Halal Foods & Beverages Industry report?
While the report offers comprehensive insights, it's advisable to review the specific contents or supplementary materials provided to ascertain if additional resources or data are available.
14. How can I stay updated on further developments or reports in the Halal Foods & Beverages Industry?
To stay informed about further developments, trends, and reports in the Halal Foods & Beverages Industry, consider subscribing to industry newsletters, following relevant companies and organizations, or regularly checking reputable industry news sources and publications.
Methodology
Step 1 - Identification of Relevant Samples Size from Population Database


Step 2 - Approaches for Defining Global Market Size (Value, Volume* & Price*)

Note*: In applicable scenarios
Step 3 - Data Sources
Primary Research
- Web Analytics
- Survey Reports
- Research Institute
- Latest Research Reports
- Opinion Leaders
Secondary Research
- Annual Reports
- White Paper
- Latest Press Release
- Industry Association
- Paid Database
- Investor Presentations

Step 4 - Data Triangulation
Involves using different sources of information in order to increase the validity of a study
These sources are likely to be stakeholders in a program - participants, other researchers, program staff, other community members, and so on.
Then we put all data in single framework & apply various statistical tools to find out the dynamic on the market.
During the analysis stage, feedback from the stakeholder groups would be compared to determine areas of agreement as well as areas of divergence


