
Key Insights
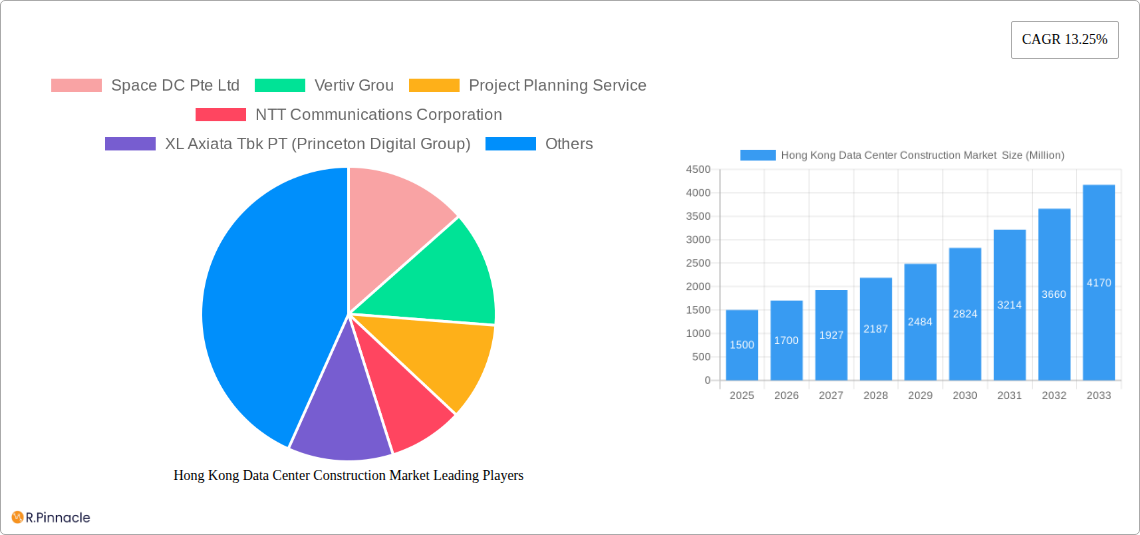
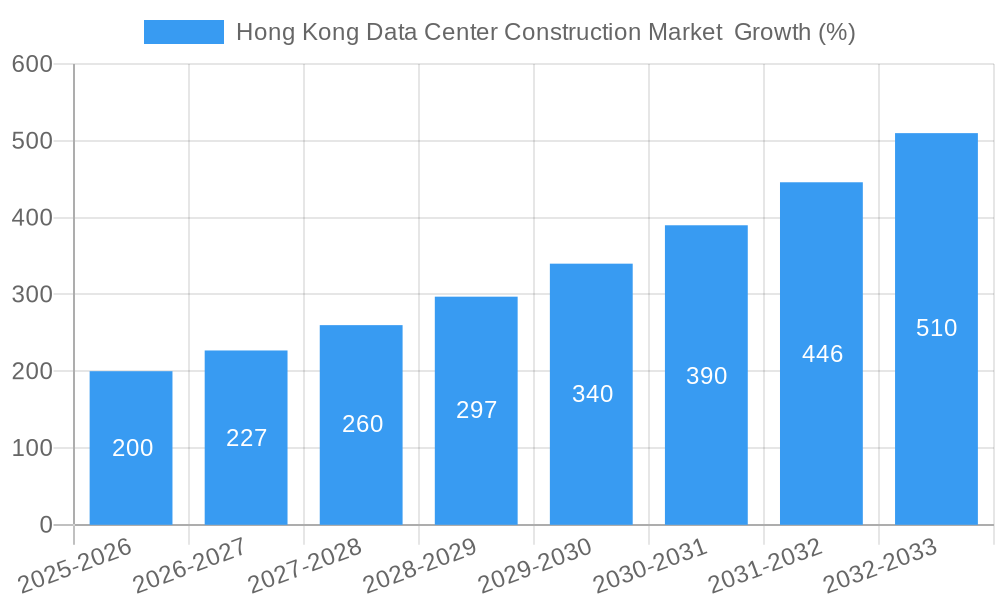
The Hong Kong data center construction market exhibits robust growth, fueled by the region's burgeoning digital economy and increasing demand for cloud services. The market's Compound Annual Growth Rate (CAGR) of 13.25% from 2019 to 2024 indicates significant expansion. This growth is driven by several key factors: the expanding IT and telecommunications sector, the rise of financial technology (FinTech) within the BFSI sector, government initiatives promoting digital transformation, and the increasing adoption of cloud computing across various industries. Furthermore, the demand for advanced cooling infrastructure, such as evaporative cooling systems, within data centers is escalating, alongside requirements for robust power distribution units (PDUs) to support high-density server deployments. The market is segmented by infrastructure type (cooling, power, security), end-user (IT & Telecom, BFSI, Government, Healthcare), data center size (small, medium, large, mega, massive), and tier level (Tier 1, Tier 2, Tier 3, etc.). The presence of major players like Vertiv, NTT Communications, and Schneider Electric underscores the market's maturity and attractiveness to international investors.
The Hong Kong data center construction market is expected to continue its upward trajectory through 2033, driven by sustained investment in digital infrastructure and the growing need for reliable data storage and processing capabilities. However, potential restraints include land scarcity, high construction costs in Hong Kong, and the need for environmentally sustainable solutions. Companies operating within the market are strategically focusing on providing comprehensive design and consulting services alongside infrastructure solutions. The market's future will depend on the ongoing government support for digital infrastructure development, continued growth in the IT sector, and the successful adoption of energy-efficient technologies within data center designs to mitigate environmental concerns. The diversity of the customer base, ranging from large multinational corporations to smaller businesses, signifies the widespread adoption of data center solutions across various industry segments within the Hong Kong market.
Hong Kong Data Center Construction Market: A Comprehensive Report (2019-2033)
This in-depth report provides a comprehensive analysis of the Hong Kong data center construction market, offering invaluable insights for industry professionals, investors, and strategic planners. Covering the period from 2019 to 2033, with a base year of 2025 and a forecast period of 2025-2033, this report meticulously examines market structure, dynamics, key players, and future trends. The report utilizes data from the historical period (2019-2024) to project future market growth and potential. The market is segmented by various key parameters, ensuring a granular understanding of the market's complexities.
Hong Kong Data Center Construction Market Structure & Innovation Trends
This section analyzes the competitive landscape of Hong Kong's data center construction market, exploring market concentration, innovation drivers, regulatory frameworks, and M&A activities. The market is characterized by a mix of both established global players and regional specialists.
Market Concentration: The market exhibits a moderately concentrated structure with a few major players holding significant market share. Space DC Pte Ltd, Vertiv Group, and NTT Communications Corporation are some of the key players, but the exact market share distribution for 2025 is currently unavailable (xx%). Further investigation is needed to quantify the market concentration index (e.g., Herfindahl-Hirschman Index).
Innovation Drivers: Growing demand for cloud computing, the rise of big data analytics, and increasing government initiatives promoting digital transformation are driving innovation in data center technologies, including advancements in cooling systems (e.g., evaporative cooling), power infrastructure, and security systems.
Regulatory Framework: The Hong Kong government's supportive policies towards technology and infrastructure development create a favorable environment for data center construction. However, stringent regulations regarding data security and environmental impact assessments need to be considered.
Product Substitutes: While traditional on-premise data centers remain dominant, cloud-based services pose a potential competitive threat, although often integrated rather than substitutive.
End-User Demographics: The primary end-users include IT & Telecommunication companies, BFSI (Banking, Financial Services, and Insurance) institutions, government agencies, healthcare providers, and other diverse organizations. The exact percentage of market share for each sector in 2025 is xx%.
M&A Activities: The market has witnessed several mergers and acquisitions in recent years, with deal values exceeding USD xx Million in the past five years. Notable examples include the November 2022 launch of BDx Indonesia, a USD 300 Million joint venture. Further analysis of M&A activity is crucial for understanding market consolidation trends.
Hong Kong Data Center Construction Market Dynamics & Trends
This section delves into the market's dynamic trends, focusing on growth drivers, technological disruptions, and competitive dynamics. The Hong Kong data center construction market is anticipated to experience significant growth throughout the forecast period, with a projected Compound Annual Growth Rate (CAGR) of xx% from 2025 to 2033.
The market's growth is primarily propelled by the increasing adoption of cloud computing and digital transformation initiatives. The rising demand for data storage and processing capabilities within various sectors, such as BFSI, IT & Telecommunications, and government, is further fueling market expansion. Technological advancements, particularly in areas such as artificial intelligence (AI) and the Internet of Things (IoT), are creating new opportunities and driving the adoption of more efficient and scalable data center solutions. However, competitive pressures from established players and the emergence of new entrants are influencing pricing strategies and service offerings within the market. Market penetration for cloud-based data center solutions is also expected to rise to xx% by 2033. Specific challenges like land scarcity and energy consumption remain key considerations shaping market dynamics.
Dominant Regions & Segments in Hong Kong Data Center Construction Market
This section identifies the dominant regions and segments within the Hong Kong data center construction market. While Hong Kong itself is the primary focus, the report might incorporate regional comparisons for context, if relevant data is available.
Key Drivers:
- Economic Policies: Government support for technological advancement and infrastructure development.
- Infrastructure: Existing robust telecommunication infrastructure and strategic geographic location.
Dominant Segments: Further research is required to pinpoint the most dominant segments. Data on market share for each segment (Evaporative Cooling, Power Infrastructure, Power Distribution Unit (PDU), Racks and Cabinets, Servers, Networking Equipment, Physical Security Infrastructure, Design and Consulting Services, Other Infrastructure, IT & Telecommunication, BFSI, Government, Healthcare, Other End User, Tier 1, Tier 2, Tier 3, Small, Medium, Large, Mega, Massive Data Centers, and Cooling Infrastructure) for 2025 is currently unavailable (xx%). The report will provide detailed analysis once this data becomes available.
Hong Kong Data Center Construction Market Product Innovations
The market is witnessing continuous product innovation, with a focus on energy efficiency, enhanced security, and scalability. Advancements in cooling technologies (e.g., liquid cooling) and modular data center designs are gaining traction. These innovations enhance operational efficiency and reduce capital expenditure, making data center construction more sustainable and cost-effective.
Report Scope & Segmentation Analysis
This report provides a detailed segmentation analysis of the Hong Kong data center construction market across various parameters, including infrastructure type (cooling, power, etc.), data center size (small, medium, large, mega, massive), tier type (Tier 1, Tier 2, Tier 3), and end-user sectors (IT & Telecommunication, BFSI, Government, Healthcare, and Others). Each segment's growth projections, market size (in Millions of USD), and competitive dynamics will be comprehensively analyzed within the full report, using the available data.
Key Drivers of Hong Kong Data Center Construction Market Growth
The Hong Kong data center construction market's growth is driven by several factors: the increasing adoption of cloud computing services; the growing demand for big data analytics and AI; government initiatives promoting digital transformation; and the expansion of the financial technology (FinTech) sector. The city's robust infrastructure and strategic location also contribute to its attractiveness as a data center hub.
Challenges in the Hong Kong Data Center Construction Market Sector
Challenges include land scarcity and high construction costs in Hong Kong, which can impact project feasibility and profitability. Furthermore, regulatory compliance requirements concerning data security and environmental sustainability necessitate considerable investment and expertise. Competition among existing and new market entrants also influences pricing strategies and profitability. The impact of these challenges on the market is currently estimated at xx% reduction in market growth.
Emerging Opportunities in Hong Kong Data Center Construction Market
Opportunities lie in the adoption of sustainable and energy-efficient technologies; the growing demand for edge computing infrastructure; and the expansion of 5G networks. The development of hyperscale data centers and the rising need for robust data security solutions also present significant growth potential.
Leading Players in the Hong Kong Data Center Construction Market Market
- Space DC Pte Ltd
- Vertiv Group
- Project Planning Service
- NTT Communications Corporation
- XL Axiata Tbk PT (Princeton Digital Group)
- Telkomsigma
- GTN Data Center
- BYME Engineering
- Arup Group
- Lintasarta
- Biznet Networks
- JupiterDC
- PT Faasri Utama Sakti
- Aurecon
- Schneider Electric
- Gulf Energy Development Public Company Limited
- Mitsubishi Electric
- Indosat Tbk PT
Key Developments in Hong Kong Data Center Construction Market Industry
- November 2022: A company (name unspecified in prompt) announced the opening of a new regional office in Kowloon, Hong Kong, to support business expansion in the Asia-Pacific region.
- November 2022: The launch of BDx Indonesia, a USD 300 Million joint venture between PT Indosat Tbk, PT Aplikanusa Lintasarta, and Big Data Exchange (BDx), signifies significant investment in the Indonesian data center market and indirectly impacts the regional landscape.
Future Outlook for Hong Kong Data Center Construction Market Market
The Hong Kong data center construction market is poised for sustained growth, driven by technological advancements, increasing digitalization across various sectors, and favorable government policies. Strategic partnerships, investments in sustainable technologies, and a focus on innovation will be critical for success in this dynamic and competitive market. The potential for growth is significant, with the projected market value estimated to reach USD xx Million by 2033.
Hong Kong Data Center Construction Market Segmentation
-
1. Tier Type
- 1.1. Tier 1 and 2
- 1.2. Tier 3
- 1.3. Tier 4
-
2. Data Center Size
- 2.1. Small
- 2.2. Medium
- 2.3. Large
- 2.4. Mega
- 2.5. Massive
-
3. Infrastructure
-
3.1. Cooling Infrastructure
- 3.1.1. Air-based Cooling
- 3.1.2. Liquid-based Cooling
- 3.1.3. Evaporative Cooling
-
3.2. Power Infrastructure
- 3.2.1. UPS Systems
- 3.2.2. Generators
- 3.2.3. Power Distribution Unit (PDU)
- 3.3. Racks and Cabinets
- 3.4. Servers
- 3.5. Networking Equipment
- 3.6. Physical Security Infrastructure
- 3.7. Design and Consulting Services
- 3.8. Other Infrastructure
-
3.1. Cooling Infrastructure
-
4. End-User
- 4.1. IT & Telecommunication
- 4.2. BFSI
- 4.3. Government
- 4.4. Healthcare
- 4.5. Other End User
Hong Kong Data Center Construction Market Segmentation By Geography
-
1. North America
- 1.1. United States
- 1.2. Canada
- 1.3. Mexico
-
2. South America
- 2.1. Brazil
- 2.2. Argentina
- 2.3. Rest of South America
-
3. Europe
- 3.1. United Kingdom
- 3.2. Germany
- 3.3. France
- 3.4. Italy
- 3.5. Spain
- 3.6. Russia
- 3.7. Benelux
- 3.8. Nordics
- 3.9. Rest of Europe
-
4. Middle East & Africa
- 4.1. Turkey
- 4.2. Israel
- 4.3. GCC
- 4.4. North Africa
- 4.5. South Africa
- 4.6. Rest of Middle East & Africa
-
5. Asia Pacific
- 5.1. China
- 5.2. India
- 5.3. Japan
- 5.4. South Korea
- 5.5. ASEAN
- 5.6. Oceania
- 5.7. Rest of Asia Pacific
Hong Kong Data Center Construction Market REPORT HIGHLIGHTS
| Aspects | Details |
|---|---|
| Study Period | 2019-2033 |
| Base Year | 2024 |
| Estimated Year | 2025 |
| Forecast Period | 2025-2033 |
| Historical Period | 2019-2024 |
| Growth Rate | CAGR of 13.25% from 2019-2033 |
| Segmentation |
|
Table of Contents
- 1. Introduction
- 1.1. Research Scope
- 1.2. Market Segmentation
- 1.3. Research Methodology
- 1.4. Definitions and Assumptions
- 2. Executive Summary
- 2.1. Introduction
- 3. Market Dynamics
- 3.1. Introduction
- 3.2. Market Drivers
- 3.2.1. Major Initiatives Undertaken by Governments to Promote Digital Economy and Connectivity Infrastructure; Rising Adoption of Hyperscale Data Centers
- 3.3. Market Restrains
- 3.3.1 Environmental
- 3.3.2 Cost
- 3.3.3 and Workforce-related Challenges
- 3.4. Market Trends
- 3.4.1. IT and Telcom Segment is Expected to Gain Significant Market Share
- 4. Market Factor Analysis
- 4.1. Porters Five Forces
- 4.2. Supply/Value Chain
- 4.3. PESTEL analysis
- 4.4. Market Entropy
- 4.5. Patent/Trademark Analysis
- 5. Global Hong Kong Data Center Construction Market Analysis, Insights and Forecast, 2019-2031
- 5.1. Market Analysis, Insights and Forecast - by Tier Type
- 5.1.1. Tier 1 and 2
- 5.1.2. Tier 3
- 5.1.3. Tier 4
- 5.2. Market Analysis, Insights and Forecast - by Data Center Size
- 5.2.1. Small
- 5.2.2. Medium
- 5.2.3. Large
- 5.2.4. Mega
- 5.2.5. Massive
- 5.3. Market Analysis, Insights and Forecast - by Infrastructure
- 5.3.1. Cooling Infrastructure
- 5.3.1.1. Air-based Cooling
- 5.3.1.2. Liquid-based Cooling
- 5.3.1.3. Evaporative Cooling
- 5.3.2. Power Infrastructure
- 5.3.2.1. UPS Systems
- 5.3.2.2. Generators
- 5.3.2.3. Power Distribution Unit (PDU)
- 5.3.3. Racks and Cabinets
- 5.3.4. Servers
- 5.3.5. Networking Equipment
- 5.3.6. Physical Security Infrastructure
- 5.3.7. Design and Consulting Services
- 5.3.8. Other Infrastructure
- 5.3.1. Cooling Infrastructure
- 5.4. Market Analysis, Insights and Forecast - by End-User
- 5.4.1. IT & Telecommunication
- 5.4.2. BFSI
- 5.4.3. Government
- 5.4.4. Healthcare
- 5.4.5. Other End User
- 5.5. Market Analysis, Insights and Forecast - by Region
- 5.5.1. North America
- 5.5.2. South America
- 5.5.3. Europe
- 5.5.4. Middle East & Africa
- 5.5.5. Asia Pacific
- 5.1. Market Analysis, Insights and Forecast - by Tier Type
- 6. North America Hong Kong Data Center Construction Market Analysis, Insights and Forecast, 2019-2031
- 6.1. Market Analysis, Insights and Forecast - by Tier Type
- 6.1.1. Tier 1 and 2
- 6.1.2. Tier 3
- 6.1.3. Tier 4
- 6.2. Market Analysis, Insights and Forecast - by Data Center Size
- 6.2.1. Small
- 6.2.2. Medium
- 6.2.3. Large
- 6.2.4. Mega
- 6.2.5. Massive
- 6.3. Market Analysis, Insights and Forecast - by Infrastructure
- 6.3.1. Cooling Infrastructure
- 6.3.1.1. Air-based Cooling
- 6.3.1.2. Liquid-based Cooling
- 6.3.1.3. Evaporative Cooling
- 6.3.2. Power Infrastructure
- 6.3.2.1. UPS Systems
- 6.3.2.2. Generators
- 6.3.2.3. Power Distribution Unit (PDU)
- 6.3.3. Racks and Cabinets
- 6.3.4. Servers
- 6.3.5. Networking Equipment
- 6.3.6. Physical Security Infrastructure
- 6.3.7. Design and Consulting Services
- 6.3.8. Other Infrastructure
- 6.3.1. Cooling Infrastructure
- 6.4. Market Analysis, Insights and Forecast - by End-User
- 6.4.1. IT & Telecommunication
- 6.4.2. BFSI
- 6.4.3. Government
- 6.4.4. Healthcare
- 6.4.5. Other End User
- 6.1. Market Analysis, Insights and Forecast - by Tier Type
- 7. South America Hong Kong Data Center Construction Market Analysis, Insights and Forecast, 2019-2031
- 7.1. Market Analysis, Insights and Forecast - by Tier Type
- 7.1.1. Tier 1 and 2
- 7.1.2. Tier 3
- 7.1.3. Tier 4
- 7.2. Market Analysis, Insights and Forecast - by Data Center Size
- 7.2.1. Small
- 7.2.2. Medium
- 7.2.3. Large
- 7.2.4. Mega
- 7.2.5. Massive
- 7.3. Market Analysis, Insights and Forecast - by Infrastructure
- 7.3.1. Cooling Infrastructure
- 7.3.1.1. Air-based Cooling
- 7.3.1.2. Liquid-based Cooling
- 7.3.1.3. Evaporative Cooling
- 7.3.2. Power Infrastructure
- 7.3.2.1. UPS Systems
- 7.3.2.2. Generators
- 7.3.2.3. Power Distribution Unit (PDU)
- 7.3.3. Racks and Cabinets
- 7.3.4. Servers
- 7.3.5. Networking Equipment
- 7.3.6. Physical Security Infrastructure
- 7.3.7. Design and Consulting Services
- 7.3.8. Other Infrastructure
- 7.3.1. Cooling Infrastructure
- 7.4. Market Analysis, Insights and Forecast - by End-User
- 7.4.1. IT & Telecommunication
- 7.4.2. BFSI
- 7.4.3. Government
- 7.4.4. Healthcare
- 7.4.5. Other End User
- 7.1. Market Analysis, Insights and Forecast - by Tier Type
- 8. Europe Hong Kong Data Center Construction Market Analysis, Insights and Forecast, 2019-2031
- 8.1. Market Analysis, Insights and Forecast - by Tier Type
- 8.1.1. Tier 1 and 2
- 8.1.2. Tier 3
- 8.1.3. Tier 4
- 8.2. Market Analysis, Insights and Forecast - by Data Center Size
- 8.2.1. Small
- 8.2.2. Medium
- 8.2.3. Large
- 8.2.4. Mega
- 8.2.5. Massive
- 8.3. Market Analysis, Insights and Forecast - by Infrastructure
- 8.3.1. Cooling Infrastructure
- 8.3.1.1. Air-based Cooling
- 8.3.1.2. Liquid-based Cooling
- 8.3.1.3. Evaporative Cooling
- 8.3.2. Power Infrastructure
- 8.3.2.1. UPS Systems
- 8.3.2.2. Generators
- 8.3.2.3. Power Distribution Unit (PDU)
- 8.3.3. Racks and Cabinets
- 8.3.4. Servers
- 8.3.5. Networking Equipment
- 8.3.6. Physical Security Infrastructure
- 8.3.7. Design and Consulting Services
- 8.3.8. Other Infrastructure
- 8.3.1. Cooling Infrastructure
- 8.4. Market Analysis, Insights and Forecast - by End-User
- 8.4.1. IT & Telecommunication
- 8.4.2. BFSI
- 8.4.3. Government
- 8.4.4. Healthcare
- 8.4.5. Other End User
- 8.1. Market Analysis, Insights and Forecast - by Tier Type
- 9. Middle East & Africa Hong Kong Data Center Construction Market Analysis, Insights and Forecast, 2019-2031
- 9.1. Market Analysis, Insights and Forecast - by Tier Type
- 9.1.1. Tier 1 and 2
- 9.1.2. Tier 3
- 9.1.3. Tier 4
- 9.2. Market Analysis, Insights and Forecast - by Data Center Size
- 9.2.1. Small
- 9.2.2. Medium
- 9.2.3. Large
- 9.2.4. Mega
- 9.2.5. Massive
- 9.3. Market Analysis, Insights and Forecast - by Infrastructure
- 9.3.1. Cooling Infrastructure
- 9.3.1.1. Air-based Cooling
- 9.3.1.2. Liquid-based Cooling
- 9.3.1.3. Evaporative Cooling
- 9.3.2. Power Infrastructure
- 9.3.2.1. UPS Systems
- 9.3.2.2. Generators
- 9.3.2.3. Power Distribution Unit (PDU)
- 9.3.3. Racks and Cabinets
- 9.3.4. Servers
- 9.3.5. Networking Equipment
- 9.3.6. Physical Security Infrastructure
- 9.3.7. Design and Consulting Services
- 9.3.8. Other Infrastructure
- 9.3.1. Cooling Infrastructure
- 9.4. Market Analysis, Insights and Forecast - by End-User
- 9.4.1. IT & Telecommunication
- 9.4.2. BFSI
- 9.4.3. Government
- 9.4.4. Healthcare
- 9.4.5. Other End User
- 9.1. Market Analysis, Insights and Forecast - by Tier Type
- 10. Asia Pacific Hong Kong Data Center Construction Market Analysis, Insights and Forecast, 2019-2031
- 10.1. Market Analysis, Insights and Forecast - by Tier Type
- 10.1.1. Tier 1 and 2
- 10.1.2. Tier 3
- 10.1.3. Tier 4
- 10.2. Market Analysis, Insights and Forecast - by Data Center Size
- 10.2.1. Small
- 10.2.2. Medium
- 10.2.3. Large
- 10.2.4. Mega
- 10.2.5. Massive
- 10.3. Market Analysis, Insights and Forecast - by Infrastructure
- 10.3.1. Cooling Infrastructure
- 10.3.1.1. Air-based Cooling
- 10.3.1.2. Liquid-based Cooling
- 10.3.1.3. Evaporative Cooling
- 10.3.2. Power Infrastructure
- 10.3.2.1. UPS Systems
- 10.3.2.2. Generators
- 10.3.2.3. Power Distribution Unit (PDU)
- 10.3.3. Racks and Cabinets
- 10.3.4. Servers
- 10.3.5. Networking Equipment
- 10.3.6. Physical Security Infrastructure
- 10.3.7. Design and Consulting Services
- 10.3.8. Other Infrastructure
- 10.3.1. Cooling Infrastructure
- 10.4. Market Analysis, Insights and Forecast - by End-User
- 10.4.1. IT & Telecommunication
- 10.4.2. BFSI
- 10.4.3. Government
- 10.4.4. Healthcare
- 10.4.5. Other End User
- 10.1. Market Analysis, Insights and Forecast - by Tier Type
- 11. Competitive Analysis
- 11.1. Global Market Share Analysis 2024
- 11.2. Company Profiles
- 11.2.1 Space DC Pte Ltd
- 11.2.1.1. Overview
- 11.2.1.2. Products
- 11.2.1.3. SWOT Analysis
- 11.2.1.4. Recent Developments
- 11.2.1.5. Financials (Based on Availability)
- 11.2.2 Vertiv Grou
- 11.2.2.1. Overview
- 11.2.2.2. Products
- 11.2.2.3. SWOT Analysis
- 11.2.2.4. Recent Developments
- 11.2.2.5. Financials (Based on Availability)
- 11.2.3 Project Planning Service
- 11.2.3.1. Overview
- 11.2.3.2. Products
- 11.2.3.3. SWOT Analysis
- 11.2.3.4. Recent Developments
- 11.2.3.5. Financials (Based on Availability)
- 11.2.4 NTT Communications Corporation
- 11.2.4.1. Overview
- 11.2.4.2. Products
- 11.2.4.3. SWOT Analysis
- 11.2.4.4. Recent Developments
- 11.2.4.5. Financials (Based on Availability)
- 11.2.5 XL Axiata Tbk PT (Princeton Digital Group)
- 11.2.5.1. Overview
- 11.2.5.2. Products
- 11.2.5.3. SWOT Analysis
- 11.2.5.4. Recent Developments
- 11.2.5.5. Financials (Based on Availability)
- 11.2.6 Telkomsigma
- 11.2.6.1. Overview
- 11.2.6.2. Products
- 11.2.6.3. SWOT Analysis
- 11.2.6.4. Recent Developments
- 11.2.6.5. Financials (Based on Availability)
- 11.2.7 GTN Data Center
- 11.2.7.1. Overview
- 11.2.7.2. Products
- 11.2.7.3. SWOT Analysis
- 11.2.7.4. Recent Developments
- 11.2.7.5. Financials (Based on Availability)
- 11.2.8 BYME Engineering
- 11.2.8.1. Overview
- 11.2.8.2. Products
- 11.2.8.3. SWOT Analysis
- 11.2.8.4. Recent Developments
- 11.2.8.5. Financials (Based on Availability)
- 11.2.9 Arup Group
- 11.2.9.1. Overview
- 11.2.9.2. Products
- 11.2.9.3. SWOT Analysis
- 11.2.9.4. Recent Developments
- 11.2.9.5. Financials (Based on Availability)
- 11.2.10 Lintasarta
- 11.2.10.1. Overview
- 11.2.10.2. Products
- 11.2.10.3. SWOT Analysis
- 11.2.10.4. Recent Developments
- 11.2.10.5. Financials (Based on Availability)
- 11.2.11 Biznet Networks
- 11.2.11.1. Overview
- 11.2.11.2. Products
- 11.2.11.3. SWOT Analysis
- 11.2.11.4. Recent Developments
- 11.2.11.5. Financials (Based on Availability)
- 11.2.12 JupiterDC
- 11.2.12.1. Overview
- 11.2.12.2. Products
- 11.2.12.3. SWOT Analysis
- 11.2.12.4. Recent Developments
- 11.2.12.5. Financials (Based on Availability)
- 11.2.13 PT Faasri Utama Sakti
- 11.2.13.1. Overview
- 11.2.13.2. Products
- 11.2.13.3. SWOT Analysis
- 11.2.13.4. Recent Developments
- 11.2.13.5. Financials (Based on Availability)
- 11.2.14 Aurecon
- 11.2.14.1. Overview
- 11.2.14.2. Products
- 11.2.14.3. SWOT Analysis
- 11.2.14.4. Recent Developments
- 11.2.14.5. Financials (Based on Availability)
- 11.2.15 Schneider Electric
- 11.2.15.1. Overview
- 11.2.15.2. Products
- 11.2.15.3. SWOT Analysis
- 11.2.15.4. Recent Developments
- 11.2.15.5. Financials (Based on Availability)
- 11.2.16 Gulf Energy Development Public Company Limited
- 11.2.16.1. Overview
- 11.2.16.2. Products
- 11.2.16.3. SWOT Analysis
- 11.2.16.4. Recent Developments
- 11.2.16.5. Financials (Based on Availability)
- 11.2.17 Mitsubishi Electric
- 11.2.17.1. Overview
- 11.2.17.2. Products
- 11.2.17.3. SWOT Analysis
- 11.2.17.4. Recent Developments
- 11.2.17.5. Financials (Based on Availability)
- 11.2.18 Indosat Tbk PT
- 11.2.18.1. Overview
- 11.2.18.2. Products
- 11.2.18.3. SWOT Analysis
- 11.2.18.4. Recent Developments
- 11.2.18.5. Financials (Based on Availability)
- 11.2.1 Space DC Pte Ltd
List of Figures
- Figure 1: Global Hong Kong Data Center Construction Market Revenue Breakdown (Million, %) by Region 2024 & 2032
- Figure 2: Hong Kong Hong Kong Data Center Construction Market Revenue (Million), by Country 2024 & 2032
- Figure 3: Hong Kong Hong Kong Data Center Construction Market Revenue Share (%), by Country 2024 & 2032
- Figure 4: North America Hong Kong Data Center Construction Market Revenue (Million), by Tier Type 2024 & 2032
- Figure 5: North America Hong Kong Data Center Construction Market Revenue Share (%), by Tier Type 2024 & 2032
- Figure 6: North America Hong Kong Data Center Construction Market Revenue (Million), by Data Center Size 2024 & 2032
- Figure 7: North America Hong Kong Data Center Construction Market Revenue Share (%), by Data Center Size 2024 & 2032
- Figure 8: North America Hong Kong Data Center Construction Market Revenue (Million), by Infrastructure 2024 & 2032
- Figure 9: North America Hong Kong Data Center Construction Market Revenue Share (%), by Infrastructure 2024 & 2032
- Figure 10: North America Hong Kong Data Center Construction Market Revenue (Million), by End-User 2024 & 2032
- Figure 11: North America Hong Kong Data Center Construction Market Revenue Share (%), by End-User 2024 & 2032
- Figure 12: North America Hong Kong Data Center Construction Market Revenue (Million), by Country 2024 & 2032
- Figure 13: North America Hong Kong Data Center Construction Market Revenue Share (%), by Country 2024 & 2032
- Figure 14: South America Hong Kong Data Center Construction Market Revenue (Million), by Tier Type 2024 & 2032
- Figure 15: South America Hong Kong Data Center Construction Market Revenue Share (%), by Tier Type 2024 & 2032
- Figure 16: South America Hong Kong Data Center Construction Market Revenue (Million), by Data Center Size 2024 & 2032
- Figure 17: South America Hong Kong Data Center Construction Market Revenue Share (%), by Data Center Size 2024 & 2032
- Figure 18: South America Hong Kong Data Center Construction Market Revenue (Million), by Infrastructure 2024 & 2032
- Figure 19: South America Hong Kong Data Center Construction Market Revenue Share (%), by Infrastructure 2024 & 2032
- Figure 20: South America Hong Kong Data Center Construction Market Revenue (Million), by End-User 2024 & 2032
- Figure 21: South America Hong Kong Data Center Construction Market Revenue Share (%), by End-User 2024 & 2032
- Figure 22: South America Hong Kong Data Center Construction Market Revenue (Million), by Country 2024 & 2032
- Figure 23: South America Hong Kong Data Center Construction Market Revenue Share (%), by Country 2024 & 2032
- Figure 24: Europe Hong Kong Data Center Construction Market Revenue (Million), by Tier Type 2024 & 2032
- Figure 25: Europe Hong Kong Data Center Construction Market Revenue Share (%), by Tier Type 2024 & 2032
- Figure 26: Europe Hong Kong Data Center Construction Market Revenue (Million), by Data Center Size 2024 & 2032
- Figure 27: Europe Hong Kong Data Center Construction Market Revenue Share (%), by Data Center Size 2024 & 2032
- Figure 28: Europe Hong Kong Data Center Construction Market Revenue (Million), by Infrastructure 2024 & 2032
- Figure 29: Europe Hong Kong Data Center Construction Market Revenue Share (%), by Infrastructure 2024 & 2032
- Figure 30: Europe Hong Kong Data Center Construction Market Revenue (Million), by End-User 2024 & 2032
- Figure 31: Europe Hong Kong Data Center Construction Market Revenue Share (%), by End-User 2024 & 2032
- Figure 32: Europe Hong Kong Data Center Construction Market Revenue (Million), by Country 2024 & 2032
- Figure 33: Europe Hong Kong Data Center Construction Market Revenue Share (%), by Country 2024 & 2032
- Figure 34: Middle East & Africa Hong Kong Data Center Construction Market Revenue (Million), by Tier Type 2024 & 2032
- Figure 35: Middle East & Africa Hong Kong Data Center Construction Market Revenue Share (%), by Tier Type 2024 & 2032
- Figure 36: Middle East & Africa Hong Kong Data Center Construction Market Revenue (Million), by Data Center Size 2024 & 2032
- Figure 37: Middle East & Africa Hong Kong Data Center Construction Market Revenue Share (%), by Data Center Size 2024 & 2032
- Figure 38: Middle East & Africa Hong Kong Data Center Construction Market Revenue (Million), by Infrastructure 2024 & 2032
- Figure 39: Middle East & Africa Hong Kong Data Center Construction Market Revenue Share (%), by Infrastructure 2024 & 2032
- Figure 40: Middle East & Africa Hong Kong Data Center Construction Market Revenue (Million), by End-User 2024 & 2032
- Figure 41: Middle East & Africa Hong Kong Data Center Construction Market Revenue Share (%), by End-User 2024 & 2032
- Figure 42: Middle East & Africa Hong Kong Data Center Construction Market Revenue (Million), by Country 2024 & 2032
- Figure 43: Middle East & Africa Hong Kong Data Center Construction Market Revenue Share (%), by Country 2024 & 2032
- Figure 44: Asia Pacific Hong Kong Data Center Construction Market Revenue (Million), by Tier Type 2024 & 2032
- Figure 45: Asia Pacific Hong Kong Data Center Construction Market Revenue Share (%), by Tier Type 2024 & 2032
- Figure 46: Asia Pacific Hong Kong Data Center Construction Market Revenue (Million), by Data Center Size 2024 & 2032
- Figure 47: Asia Pacific Hong Kong Data Center Construction Market Revenue Share (%), by Data Center Size 2024 & 2032
- Figure 48: Asia Pacific Hong Kong Data Center Construction Market Revenue (Million), by Infrastructure 2024 & 2032
- Figure 49: Asia Pacific Hong Kong Data Center Construction Market Revenue Share (%), by Infrastructure 2024 & 2032
- Figure 50: Asia Pacific Hong Kong Data Center Construction Market Revenue (Million), by End-User 2024 & 2032
- Figure 51: Asia Pacific Hong Kong Data Center Construction Market Revenue Share (%), by End-User 2024 & 2032
- Figure 52: Asia Pacific Hong Kong Data Center Construction Market Revenue (Million), by Country 2024 & 2032
- Figure 53: Asia Pacific Hong Kong Data Center Construction Market Revenue Share (%), by Country 2024 & 2032
List of Tables
- Table 1: Global Hong Kong Data Center Construction Market Revenue Million Forecast, by Region 2019 & 2032
- Table 2: Global Hong Kong Data Center Construction Market Revenue Million Forecast, by Tier Type 2019 & 2032
- Table 3: Global Hong Kong Data Center Construction Market Revenue Million Forecast, by Data Center Size 2019 & 2032
- Table 4: Global Hong Kong Data Center Construction Market Revenue Million Forecast, by Infrastructure 2019 & 2032
- Table 5: Global Hong Kong Data Center Construction Market Revenue Million Forecast, by End-User 2019 & 2032
- Table 6: Global Hong Kong Data Center Construction Market Revenue Million Forecast, by Region 2019 & 2032
- Table 7: Global Hong Kong Data Center Construction Market Revenue Million Forecast, by Country 2019 & 2032
- Table 8: Global Hong Kong Data Center Construction Market Revenue Million Forecast, by Tier Type 2019 & 2032
- Table 9: Global Hong Kong Data Center Construction Market Revenue Million Forecast, by Data Center Size 2019 & 2032
- Table 10: Global Hong Kong Data Center Construction Market Revenue Million Forecast, by Infrastructure 2019 & 2032
- Table 11: Global Hong Kong Data Center Construction Market Revenue Million Forecast, by End-User 2019 & 2032
- Table 12: Global Hong Kong Data Center Construction Market Revenue Million Forecast, by Country 2019 & 2032
- Table 13: United States Hong Kong Data Center Construction Market Revenue (Million) Forecast, by Application 2019 & 2032
- Table 14: Canada Hong Kong Data Center Construction Market Revenue (Million) Forecast, by Application 2019 & 2032
- Table 15: Mexico Hong Kong Data Center Construction Market Revenue (Million) Forecast, by Application 2019 & 2032
- Table 16: Global Hong Kong Data Center Construction Market Revenue Million Forecast, by Tier Type 2019 & 2032
- Table 17: Global Hong Kong Data Center Construction Market Revenue Million Forecast, by Data Center Size 2019 & 2032
- Table 18: Global Hong Kong Data Center Construction Market Revenue Million Forecast, by Infrastructure 2019 & 2032
- Table 19: Global Hong Kong Data Center Construction Market Revenue Million Forecast, by End-User 2019 & 2032
- Table 20: Global Hong Kong Data Center Construction Market Revenue Million Forecast, by Country 2019 & 2032
- Table 21: Brazil Hong Kong Data Center Construction Market Revenue (Million) Forecast, by Application 2019 & 2032
- Table 22: Argentina Hong Kong Data Center Construction Market Revenue (Million) Forecast, by Application 2019 & 2032
- Table 23: Rest of South America Hong Kong Data Center Construction Market Revenue (Million) Forecast, by Application 2019 & 2032
- Table 24: Global Hong Kong Data Center Construction Market Revenue Million Forecast, by Tier Type 2019 & 2032
- Table 25: Global Hong Kong Data Center Construction Market Revenue Million Forecast, by Data Center Size 2019 & 2032
- Table 26: Global Hong Kong Data Center Construction Market Revenue Million Forecast, by Infrastructure 2019 & 2032
- Table 27: Global Hong Kong Data Center Construction Market Revenue Million Forecast, by End-User 2019 & 2032
- Table 28: Global Hong Kong Data Center Construction Market Revenue Million Forecast, by Country 2019 & 2032
- Table 29: United Kingdom Hong Kong Data Center Construction Market Revenue (Million) Forecast, by Application 2019 & 2032
- Table 30: Germany Hong Kong Data Center Construction Market Revenue (Million) Forecast, by Application 2019 & 2032
- Table 31: France Hong Kong Data Center Construction Market Revenue (Million) Forecast, by Application 2019 & 2032
- Table 32: Italy Hong Kong Data Center Construction Market Revenue (Million) Forecast, by Application 2019 & 2032
- Table 33: Spain Hong Kong Data Center Construction Market Revenue (Million) Forecast, by Application 2019 & 2032
- Table 34: Russia Hong Kong Data Center Construction Market Revenue (Million) Forecast, by Application 2019 & 2032
- Table 35: Benelux Hong Kong Data Center Construction Market Revenue (Million) Forecast, by Application 2019 & 2032
- Table 36: Nordics Hong Kong Data Center Construction Market Revenue (Million) Forecast, by Application 2019 & 2032
- Table 37: Rest of Europe Hong Kong Data Center Construction Market Revenue (Million) Forecast, by Application 2019 & 2032
- Table 38: Global Hong Kong Data Center Construction Market Revenue Million Forecast, by Tier Type 2019 & 2032
- Table 39: Global Hong Kong Data Center Construction Market Revenue Million Forecast, by Data Center Size 2019 & 2032
- Table 40: Global Hong Kong Data Center Construction Market Revenue Million Forecast, by Infrastructure 2019 & 2032
- Table 41: Global Hong Kong Data Center Construction Market Revenue Million Forecast, by End-User 2019 & 2032
- Table 42: Global Hong Kong Data Center Construction Market Revenue Million Forecast, by Country 2019 & 2032
- Table 43: Turkey Hong Kong Data Center Construction Market Revenue (Million) Forecast, by Application 2019 & 2032
- Table 44: Israel Hong Kong Data Center Construction Market Revenue (Million) Forecast, by Application 2019 & 2032
- Table 45: GCC Hong Kong Data Center Construction Market Revenue (Million) Forecast, by Application 2019 & 2032
- Table 46: North Africa Hong Kong Data Center Construction Market Revenue (Million) Forecast, by Application 2019 & 2032
- Table 47: South Africa Hong Kong Data Center Construction Market Revenue (Million) Forecast, by Application 2019 & 2032
- Table 48: Rest of Middle East & Africa Hong Kong Data Center Construction Market Revenue (Million) Forecast, by Application 2019 & 2032
- Table 49: Global Hong Kong Data Center Construction Market Revenue Million Forecast, by Tier Type 2019 & 2032
- Table 50: Global Hong Kong Data Center Construction Market Revenue Million Forecast, by Data Center Size 2019 & 2032
- Table 51: Global Hong Kong Data Center Construction Market Revenue Million Forecast, by Infrastructure 2019 & 2032
- Table 52: Global Hong Kong Data Center Construction Market Revenue Million Forecast, by End-User 2019 & 2032
- Table 53: Global Hong Kong Data Center Construction Market Revenue Million Forecast, by Country 2019 & 2032
- Table 54: China Hong Kong Data Center Construction Market Revenue (Million) Forecast, by Application 2019 & 2032
- Table 55: India Hong Kong Data Center Construction Market Revenue (Million) Forecast, by Application 2019 & 2032
- Table 56: Japan Hong Kong Data Center Construction Market Revenue (Million) Forecast, by Application 2019 & 2032
- Table 57: South Korea Hong Kong Data Center Construction Market Revenue (Million) Forecast, by Application 2019 & 2032
- Table 58: ASEAN Hong Kong Data Center Construction Market Revenue (Million) Forecast, by Application 2019 & 2032
- Table 59: Oceania Hong Kong Data Center Construction Market Revenue (Million) Forecast, by Application 2019 & 2032
- Table 60: Rest of Asia Pacific Hong Kong Data Center Construction Market Revenue (Million) Forecast, by Application 2019 & 2032
Frequently Asked Questions
1. What is the projected Compound Annual Growth Rate (CAGR) of the Hong Kong Data Center Construction Market ?
The projected CAGR is approximately 13.25%.
2. Which companies are prominent players in the Hong Kong Data Center Construction Market ?
Key companies in the market include Space DC Pte Ltd, Vertiv Grou, Project Planning Service, NTT Communications Corporation, XL Axiata Tbk PT (Princeton Digital Group), Telkomsigma, GTN Data Center, BYME Engineering, Arup Group, Lintasarta, Biznet Networks, JupiterDC, PT Faasri Utama Sakti, Aurecon, Schneider Electric, Gulf Energy Development Public Company Limited, Mitsubishi Electric, Indosat Tbk PT.
3. What are the main segments of the Hong Kong Data Center Construction Market ?
The market segments include Tier Type, Data Center Size, Infrastructure, End-User.
4. Can you provide details about the market size?
The market size is estimated to be USD XX Million as of 2022.
5. What are some drivers contributing to market growth?
Major Initiatives Undertaken by Governments to Promote Digital Economy and Connectivity Infrastructure; Rising Adoption of Hyperscale Data Centers.
6. What are the notable trends driving market growth?
IT and Telcom Segment is Expected to Gain Significant Market Share.
7. Are there any restraints impacting market growth?
Environmental. Cost. and Workforce-related Challenges.
8. Can you provide examples of recent developments in the market?
November 2022: The company announced the opening of its new regional office in Kowloon, Hong Kong. The office would help the company strengthen its expansion and would cater to business needs such as engineering, construction, and sales in the Asia-Pacific region.
9. What pricing options are available for accessing the report?
Pricing options include single-user, multi-user, and enterprise licenses priced at USD 3800, USD 4500, and USD 5800 respectively.
10. Is the market size provided in terms of value or volume?
The market size is provided in terms of value, measured in Million.
11. Are there any specific market keywords associated with the report?
Yes, the market keyword associated with the report is "Hong Kong Data Center Construction Market ," which aids in identifying and referencing the specific market segment covered.
12. How do I determine which pricing option suits my needs best?
The pricing options vary based on user requirements and access needs. Individual users may opt for single-user licenses, while businesses requiring broader access may choose multi-user or enterprise licenses for cost-effective access to the report.
13. Are there any additional resources or data provided in the Hong Kong Data Center Construction Market report?
While the report offers comprehensive insights, it's advisable to review the specific contents or supplementary materials provided to ascertain if additional resources or data are available.
14. How can I stay updated on further developments or reports in the Hong Kong Data Center Construction Market ?
To stay informed about further developments, trends, and reports in the Hong Kong Data Center Construction Market , consider subscribing to industry newsletters, following relevant companies and organizations, or regularly checking reputable industry news sources and publications.
Methodology
Step 1 - Identification of Relevant Samples Size from Population Database


Step 2 - Approaches for Defining Global Market Size (Value, Volume* & Price*)

Note*: In applicable scenarios
Step 3 - Data Sources
Primary Research
- Web Analytics
- Survey Reports
- Research Institute
- Latest Research Reports
- Opinion Leaders
Secondary Research
- Annual Reports
- White Paper
- Latest Press Release
- Industry Association
- Paid Database
- Investor Presentations

Step 4 - Data Triangulation
Involves using different sources of information in order to increase the validity of a study
These sources are likely to be stakeholders in a program - participants, other researchers, program staff, other community members, and so on.
Then we put all data in single framework & apply various statistical tools to find out the dynamic on the market.
During the analysis stage, feedback from the stakeholder groups would be compared to determine areas of agreement as well as areas of divergence


