
Key Insights
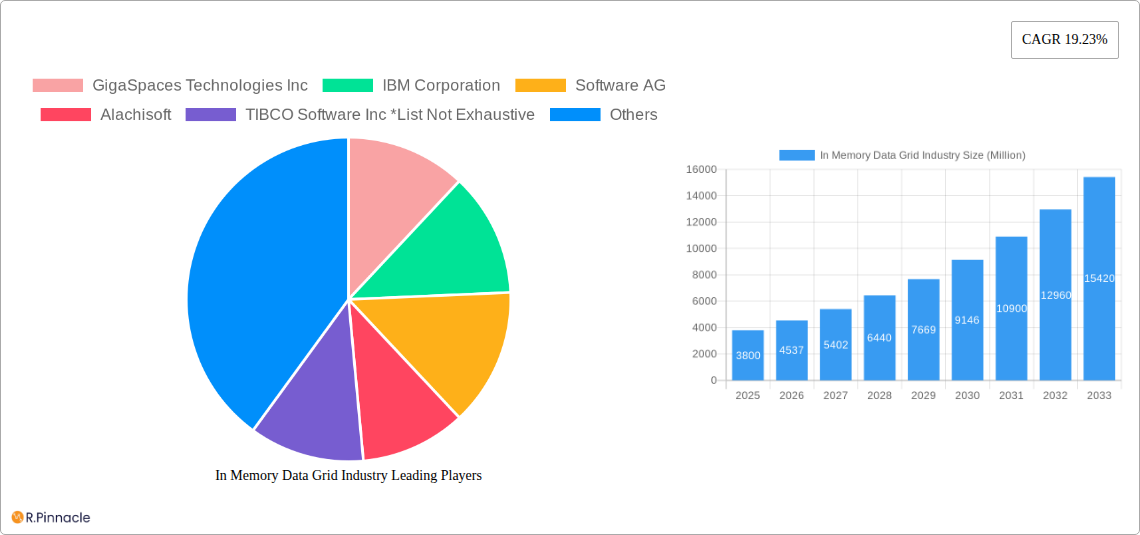
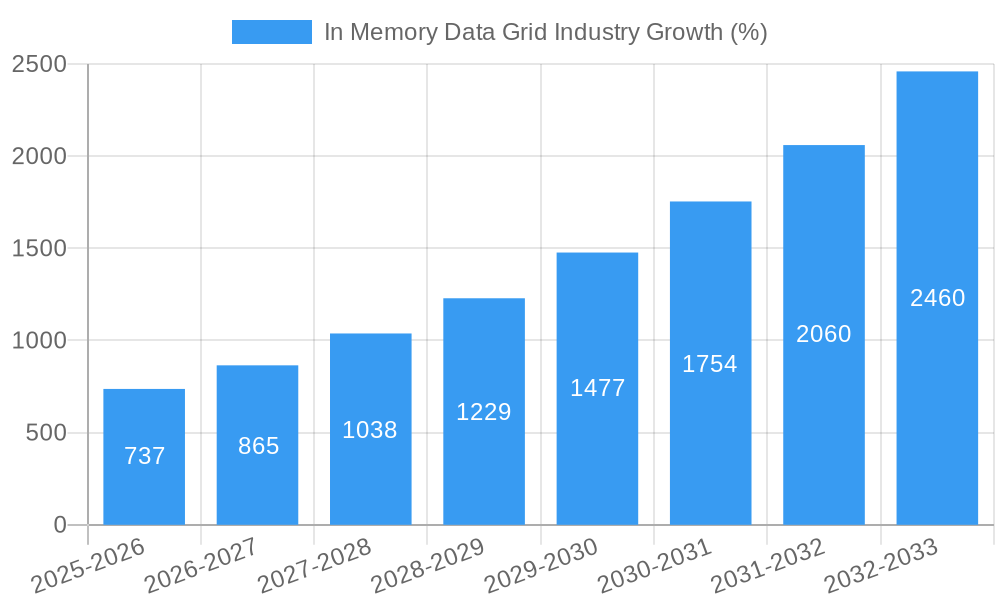
The In-Memory Data Grid (IMDG) market is experiencing robust growth, projected to reach a market size of $3.80 billion in 2025 and maintain a Compound Annual Growth Rate (CAGR) of 19.23% from 2025 to 2033. This expansion is fueled by the increasing need for real-time data processing and analytics across diverse industries. The demand for high-speed transaction processing, improved application performance, and enhanced data scalability is driving widespread adoption of IMDG solutions. Key drivers include the rise of big data analytics, the proliferation of cloud computing, and the growing adoption of microservices architectures. Furthermore, the increasing prevalence of IoT devices generating massive volumes of real-time data necessitates efficient and scalable data management solutions, further bolstering IMDG market growth. The market is segmented by component (solutions and services), deployment type (on-premise and cloud), and end-user industry (BFSI, IT & Telecommunications, Retail, Healthcare, Transportation & Logistics, and others). Cloud-based deployments are witnessing faster growth due to their inherent scalability, flexibility, and cost-effectiveness. The BFSI and IT & Telecommunication sectors represent significant market segments, driven by their reliance on real-time data processing for critical applications like fraud detection, risk management, and customer relationship management.
While the market exhibits strong growth potential, certain restraints exist. These include the complexity of implementing and managing IMDG systems, the need for skilled professionals, and concerns regarding data security and compliance. However, ongoing technological advancements and the increasing availability of user-friendly tools and managed services are mitigating these challenges, paving the way for broader adoption. Leading vendors like GigaSpaces Technologies, IBM, Software AG, and others are actively investing in innovation, offering comprehensive solutions, and expanding their global reach to cater to the evolving needs of diverse industries. The continued evolution of cloud technologies and the increasing focus on real-time data analytics are expected to drive further growth and innovation within the IMDG market throughout the forecast period.
In-Memory Data Grid Industry Report: 2019-2033 Forecast
This comprehensive report provides a detailed analysis of the In-Memory Data Grid (IMDG) industry, offering valuable insights for industry professionals, investors, and strategists. The report covers market size, segmentation, growth drivers, challenges, and future outlook, with a focus on key players and recent industry developments. The study period spans 2019-2033, with 2025 as the base and estimated year.
In Memory Data Grid Industry Market Structure & Innovation Trends
The In-Memory Data Grid market exhibits a moderately consolidated structure, with key players like GigaSpaces Technologies Inc, IBM Corporation, Software AG, Alachisoft, and TIBCO Software Inc holding significant market share. Other prominent players include Oracle Corporation, GridGain Systems Inc, Pivotal (VMware Inc), ScaleOut Software, and Hazelcast Inc. However, the market also accommodates numerous smaller niche players. Market share data for 2024 estimates that GigaSpaces holds approximately 15%, IBM 12%, Software AG 10%, with the remaining share distributed among other players. M&A activity has been relatively moderate in recent years, with total deal values exceeding $xx Million in the 2019-2024 period, primarily driven by acquisitions aimed at expanding technological capabilities and market reach. Innovation is driven by the increasing need for real-time data processing, advancements in hardware (like Optane DIMMs), and the rise of cloud computing. Regulatory frameworks surrounding data privacy and security significantly influence market dynamics. Product substitutes, such as traditional databases, face increasing pressure due to IMDGs' superior performance in high-velocity data environments. The end-user demographic is diverse, encompassing BFSI, IT & Telecommunication, Retail, Healthcare, Transportation & Logistics, and other sectors.
In Memory Data Grid Industry Market Dynamics & Trends
The In-Memory Data Grid market is experiencing robust growth, driven by the exponential increase in data volume and velocity across various industries. The compound annual growth rate (CAGR) is projected to be xx% during the forecast period (2025-2033), reaching a market value exceeding $xx Million by 2033. Technological disruptions, such as the adoption of advanced analytics and artificial intelligence (AI), are fueling demand for real-time data processing capabilities offered by IMDGs. Consumer preferences are shifting towards solutions that offer improved performance, scalability, and ease of integration. Competitive dynamics are intense, with players focusing on product innovation, strategic partnerships, and expansion into new markets. Market penetration within specific end-user industries like BFSI and IT & Telecommunication is high, while opportunities for growth remain in healthcare, retail, and other emerging sectors.
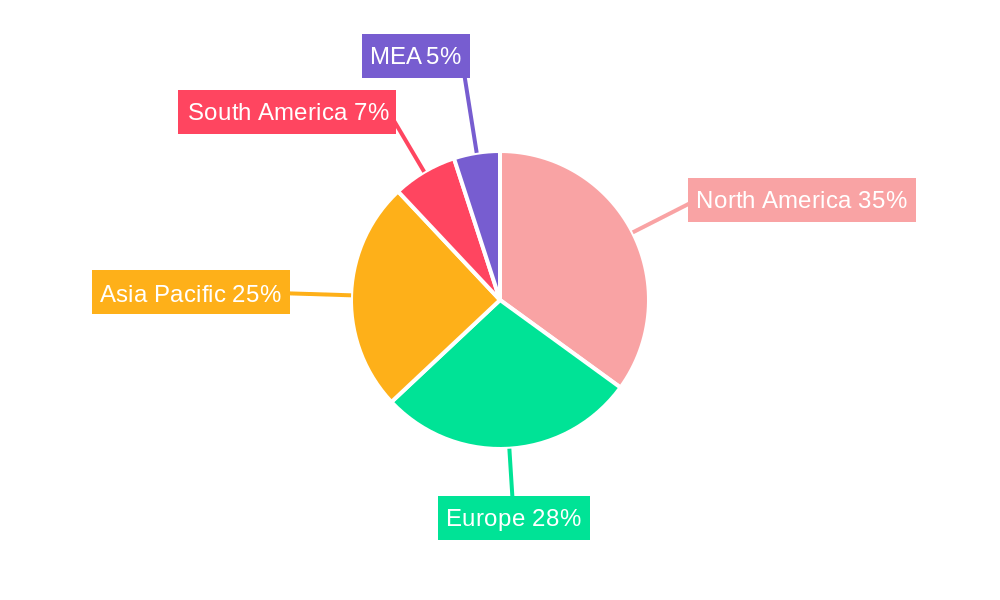
Dominant Regions & Segments in In Memory Data Grid Industry
North America currently holds the dominant position in the In-Memory Data Grid market, driven by strong technological advancements, early adoption of cloud computing, and a large base of technology-intensive industries.
- Key Drivers in North America: Robust IT infrastructure, high investment in R&D, and presence of major IMDG vendors.
- Europe: Significant growth potential due to increasing digital transformation initiatives across various sectors.
- Asia-Pacific: Rapid growth driven by increasing data volumes, expanding cloud adoption, and the presence of emerging economies.
By Component: The solution segment holds the largest market share, reflecting the growing demand for comprehensive IMDG platforms. The services segment exhibits promising growth potential, driven by increasing demand for customized implementation and support.
By Deployment Type: The cloud deployment type is experiencing faster growth than on-premise, driven by the advantages of scalability, cost-efficiency, and accessibility.
By End-user Industry: The BFSI sector is the leading adopter of IMDGs, driven by the need for real-time fraud detection, risk management, and personalized customer services. The IT and Telecommunication sector follows closely, owing to their dependence on high-velocity data processing.
In Memory Data Grid Industry Product Innovations
Recent product innovations focus on enhancing performance, scalability, and integration capabilities. Key trends include the integration of advanced analytics, AI, and machine learning capabilities within IMDG platforms, along with enhanced support for various data formats and improved security features. These advancements enhance market fit by catering to the evolving needs of businesses across various industries that require real-time insights and efficient data management.
Report Scope & Segmentation Analysis
This report provides a comprehensive segmentation analysis of the In-Memory Data Grid market across various parameters.
By Component: Solution and Services. The solution segment is expected to grow at a xx% CAGR, while the services segment is projected to witness xx% growth.
By Deployment Type: On-premise and Cloud. The cloud segment is projected to dominate, showing a CAGR of xx% due to increased cloud adoption.
By End-user Industry: BFSI, IT & Telecommunication, Retail, Healthcare, Transportation & Logistics, and Other End-User Industries. BFSI and IT & Telecommunication are expected to be the largest segments, with substantial growth projected in healthcare and retail.
Key Drivers of In Memory Data Grid Industry Growth
Several factors drive the growth of the In-Memory Data Grid industry. Technological advancements in hardware and software, especially in areas like memory technology and data processing algorithms, are paramount. The increasing demand for real-time data analytics across diverse sectors fuels market growth. Favorable government regulations and policies promoting digital transformation further support industry expansion. Furthermore, the growing adoption of cloud computing and the rise of big data applications provide significant growth opportunities.
Challenges in the In Memory Data Grid Industry Sector
The In-Memory Data Grid industry faces several challenges. High implementation costs and the complexity involved in integrating IMDGs with existing IT infrastructure can hinder adoption. Competition among established vendors and the emergence of new players create a challenging market landscape. Data security and privacy concerns require robust security measures and compliance with stringent regulations. Supply chain disruptions can impact the availability of crucial components, affecting product delivery and market dynamics.
Emerging Opportunities in In Memory Data Grid Industry
Emerging opportunities in the IMDG industry include the expanding adoption of edge computing, integration with IoT devices, and the development of specialized solutions for specific industry verticals. The growing focus on real-time data analytics and AI applications creates significant potential for growth. Moreover, expanding into untapped markets in developing economies offers substantial opportunities for market expansion.
Leading Players in the In Memory Data Grid Industry Market
- GigaSpaces Technologies Inc
- IBM Corporation
- Software AG
- Alachisoft
- TIBCO Software Inc
- Oracle Corporation
- GridGain Systems Inc
- Pivotal (VMware Inc)
- ScaleOut Software
- Hazelcast Inc
Key Developments in In Memory Data Grid Industry
- May 2022: Intesa Sanpaolo's adoption of Optane DIMMs and in-memory software showcases the performance benefits of IMDGs in the BFSI sector, accelerating database recovery times significantly.
- March 2022: Hazelcast's enhancements to its IMDG software, including improved SQL streaming and data tiering capabilities, demonstrate the ongoing innovation and expansion of features within the market.
Future Outlook for In Memory Data Grid Industry Market
The future outlook for the In-Memory Data Grid market is highly positive. Continued advancements in technology, increasing demand for real-time analytics, and expanding adoption across various sectors point towards substantial growth potential. Strategic partnerships, mergers and acquisitions, and product innovation will play a key role in shaping the future market landscape. The market is poised to witness significant expansion, driven by the continued evolution of data management requirements across various industries.
In Memory Data Grid Industry Segmentation
-
1. Component
- 1.1. Solution
- 1.2. Services
-
2. Deployment Type
- 2.1. On-premise
- 2.2. Cloud
-
3. End-user Industry
- 3.1. BFSI
- 3.2. IT and Telecommunication
- 3.3. Retail
- 3.4. Healthcare
- 3.5. Transportation and Logistics
- 3.6. Other End-User Industries
In Memory Data Grid Industry Segmentation By Geography
- 1. North America
- 2. Europe
- 3. Asia Pacific
- 4. Latin America
- 5. Middle East and Africa
In Memory Data Grid Industry REPORT HIGHLIGHTS
| Aspects | Details |
|---|---|
| Study Period | 2019-2033 |
| Base Year | 2024 |
| Estimated Year | 2025 |
| Forecast Period | 2025-2033 |
| Historical Period | 2019-2024 |
| Growth Rate | CAGR of 19.23% from 2019-2033 |
| Segmentation |
|
Table of Contents
- 1. Introduction
- 1.1. Research Scope
- 1.2. Market Segmentation
- 1.3. Research Methodology
- 1.4. Definitions and Assumptions
- 2. Executive Summary
- 2.1. Introduction
- 3. Market Dynamics
- 3.1. Introduction
- 3.2. Market Drivers
- 3.2.1. Increasing Need for Attaining Unprecedented Levels of Speed at Data Processing; Growth of Big Data
- 3.3. Market Restrains
- 3.3.1. High Costs and Operational Concerns; Concerns related to Geoprivacy and Confidential Data
- 3.4. Market Trends
- 3.4.1. Growing Need for Real Time Data Processing in BFSI Driving the Market Growth
- 4. Market Factor Analysis
- 4.1. Porters Five Forces
- 4.2. Supply/Value Chain
- 4.3. PESTEL analysis
- 4.4. Market Entropy
- 4.5. Patent/Trademark Analysis
- 5. Global In Memory Data Grid Industry Analysis, Insights and Forecast, 2019-2031
- 5.1. Market Analysis, Insights and Forecast - by Component
- 5.1.1. Solution
- 5.1.2. Services
- 5.2. Market Analysis, Insights and Forecast - by Deployment Type
- 5.2.1. On-premise
- 5.2.2. Cloud
- 5.3. Market Analysis, Insights and Forecast - by End-user Industry
- 5.3.1. BFSI
- 5.3.2. IT and Telecommunication
- 5.3.3. Retail
- 5.3.4. Healthcare
- 5.3.5. Transportation and Logistics
- 5.3.6. Other End-User Industries
- 5.4. Market Analysis, Insights and Forecast - by Region
- 5.4.1. North America
- 5.4.2. Europe
- 5.4.3. Asia Pacific
- 5.4.4. Latin America
- 5.4.5. Middle East and Africa
- 5.1. Market Analysis, Insights and Forecast - by Component
- 6. North America In Memory Data Grid Industry Analysis, Insights and Forecast, 2019-2031
- 6.1. Market Analysis, Insights and Forecast - by Component
- 6.1.1. Solution
- 6.1.2. Services
- 6.2. Market Analysis, Insights and Forecast - by Deployment Type
- 6.2.1. On-premise
- 6.2.2. Cloud
- 6.3. Market Analysis, Insights and Forecast - by End-user Industry
- 6.3.1. BFSI
- 6.3.2. IT and Telecommunication
- 6.3.3. Retail
- 6.3.4. Healthcare
- 6.3.5. Transportation and Logistics
- 6.3.6. Other End-User Industries
- 6.1. Market Analysis, Insights and Forecast - by Component
- 7. Europe In Memory Data Grid Industry Analysis, Insights and Forecast, 2019-2031
- 7.1. Market Analysis, Insights and Forecast - by Component
- 7.1.1. Solution
- 7.1.2. Services
- 7.2. Market Analysis, Insights and Forecast - by Deployment Type
- 7.2.1. On-premise
- 7.2.2. Cloud
- 7.3. Market Analysis, Insights and Forecast - by End-user Industry
- 7.3.1. BFSI
- 7.3.2. IT and Telecommunication
- 7.3.3. Retail
- 7.3.4. Healthcare
- 7.3.5. Transportation and Logistics
- 7.3.6. Other End-User Industries
- 7.1. Market Analysis, Insights and Forecast - by Component
- 8. Asia Pacific In Memory Data Grid Industry Analysis, Insights and Forecast, 2019-2031
- 8.1. Market Analysis, Insights and Forecast - by Component
- 8.1.1. Solution
- 8.1.2. Services
- 8.2. Market Analysis, Insights and Forecast - by Deployment Type
- 8.2.1. On-premise
- 8.2.2. Cloud
- 8.3. Market Analysis, Insights and Forecast - by End-user Industry
- 8.3.1. BFSI
- 8.3.2. IT and Telecommunication
- 8.3.3. Retail
- 8.3.4. Healthcare
- 8.3.5. Transportation and Logistics
- 8.3.6. Other End-User Industries
- 8.1. Market Analysis, Insights and Forecast - by Component
- 9. Latin America In Memory Data Grid Industry Analysis, Insights and Forecast, 2019-2031
- 9.1. Market Analysis, Insights and Forecast - by Component
- 9.1.1. Solution
- 9.1.2. Services
- 9.2. Market Analysis, Insights and Forecast - by Deployment Type
- 9.2.1. On-premise
- 9.2.2. Cloud
- 9.3. Market Analysis, Insights and Forecast - by End-user Industry
- 9.3.1. BFSI
- 9.3.2. IT and Telecommunication
- 9.3.3. Retail
- 9.3.4. Healthcare
- 9.3.5. Transportation and Logistics
- 9.3.6. Other End-User Industries
- 9.1. Market Analysis, Insights and Forecast - by Component
- 10. Middle East and Africa In Memory Data Grid Industry Analysis, Insights and Forecast, 2019-2031
- 10.1. Market Analysis, Insights and Forecast - by Component
- 10.1.1. Solution
- 10.1.2. Services
- 10.2. Market Analysis, Insights and Forecast - by Deployment Type
- 10.2.1. On-premise
- 10.2.2. Cloud
- 10.3. Market Analysis, Insights and Forecast - by End-user Industry
- 10.3.1. BFSI
- 10.3.2. IT and Telecommunication
- 10.3.3. Retail
- 10.3.4. Healthcare
- 10.3.5. Transportation and Logistics
- 10.3.6. Other End-User Industries
- 10.1. Market Analysis, Insights and Forecast - by Component
- 11. North America In Memory Data Grid Industry Analysis, Insights and Forecast, 2019-2031
- 11.1. Market Analysis, Insights and Forecast - By Country/Sub-region
- 11.1.1 United States
- 11.1.2 Canada
- 11.1.3 Mexico
- 12. Europe In Memory Data Grid Industry Analysis, Insights and Forecast, 2019-2031
- 12.1. Market Analysis, Insights and Forecast - By Country/Sub-region
- 12.1.1 Germany
- 12.1.2 United Kingdom
- 12.1.3 France
- 12.1.4 Spain
- 12.1.5 Italy
- 12.1.6 Spain
- 12.1.7 Belgium
- 12.1.8 Netherland
- 12.1.9 Nordics
- 12.1.10 Rest of Europe
- 13. Asia Pacific In Memory Data Grid Industry Analysis, Insights and Forecast, 2019-2031
- 13.1. Market Analysis, Insights and Forecast - By Country/Sub-region
- 13.1.1 China
- 13.1.2 Japan
- 13.1.3 India
- 13.1.4 South Korea
- 13.1.5 Southeast Asia
- 13.1.6 Australia
- 13.1.7 Indonesia
- 13.1.8 Phillipes
- 13.1.9 Singapore
- 13.1.10 Thailandc
- 13.1.11 Rest of Asia Pacific
- 14. South America In Memory Data Grid Industry Analysis, Insights and Forecast, 2019-2031
- 14.1. Market Analysis, Insights and Forecast - By Country/Sub-region
- 14.1.1 Brazil
- 14.1.2 Argentina
- 14.1.3 Peru
- 14.1.4 Chile
- 14.1.5 Colombia
- 14.1.6 Ecuador
- 14.1.7 Venezuela
- 14.1.8 Rest of South America
- 15. North America In Memory Data Grid Industry Analysis, Insights and Forecast, 2019-2031
- 15.1. Market Analysis, Insights and Forecast - By Country/Sub-region
- 15.1.1 United States
- 15.1.2 Canada
- 15.1.3 Mexico
- 16. MEA In Memory Data Grid Industry Analysis, Insights and Forecast, 2019-2031
- 16.1. Market Analysis, Insights and Forecast - By Country/Sub-region
- 16.1.1 United Arab Emirates
- 16.1.2 Saudi Arabia
- 16.1.3 South Africa
- 16.1.4 Rest of Middle East and Africa
- 17. Competitive Analysis
- 17.1. Global Market Share Analysis 2024
- 17.2. Company Profiles
- 17.2.1 GigaSpaces Technologies Inc
- 17.2.1.1. Overview
- 17.2.1.2. Products
- 17.2.1.3. SWOT Analysis
- 17.2.1.4. Recent Developments
- 17.2.1.5. Financials (Based on Availability)
- 17.2.2 IBM Corporation
- 17.2.2.1. Overview
- 17.2.2.2. Products
- 17.2.2.3. SWOT Analysis
- 17.2.2.4. Recent Developments
- 17.2.2.5. Financials (Based on Availability)
- 17.2.3 Software AG
- 17.2.3.1. Overview
- 17.2.3.2. Products
- 17.2.3.3. SWOT Analysis
- 17.2.3.4. Recent Developments
- 17.2.3.5. Financials (Based on Availability)
- 17.2.4 Alachisoft
- 17.2.4.1. Overview
- 17.2.4.2. Products
- 17.2.4.3. SWOT Analysis
- 17.2.4.4. Recent Developments
- 17.2.4.5. Financials (Based on Availability)
- 17.2.5 TIBCO Software Inc *List Not Exhaustive
- 17.2.5.1. Overview
- 17.2.5.2. Products
- 17.2.5.3. SWOT Analysis
- 17.2.5.4. Recent Developments
- 17.2.5.5. Financials (Based on Availability)
- 17.2.6 Oracle Corporation
- 17.2.6.1. Overview
- 17.2.6.2. Products
- 17.2.6.3. SWOT Analysis
- 17.2.6.4. Recent Developments
- 17.2.6.5. Financials (Based on Availability)
- 17.2.7 GridGain Systems Inc
- 17.2.7.1. Overview
- 17.2.7.2. Products
- 17.2.7.3. SWOT Analysis
- 17.2.7.4. Recent Developments
- 17.2.7.5. Financials (Based on Availability)
- 17.2.8 Pivotal (VMware Inc )
- 17.2.8.1. Overview
- 17.2.8.2. Products
- 17.2.8.3. SWOT Analysis
- 17.2.8.4. Recent Developments
- 17.2.8.5. Financials (Based on Availability)
- 17.2.9 ScaleOut Software
- 17.2.9.1. Overview
- 17.2.9.2. Products
- 17.2.9.3. SWOT Analysis
- 17.2.9.4. Recent Developments
- 17.2.9.5. Financials (Based on Availability)
- 17.2.10 Hazelcast Inc
- 17.2.10.1. Overview
- 17.2.10.2. Products
- 17.2.10.3. SWOT Analysis
- 17.2.10.4. Recent Developments
- 17.2.10.5. Financials (Based on Availability)
- 17.2.1 GigaSpaces Technologies Inc
List of Figures
- Figure 1: Global In Memory Data Grid Industry Revenue Breakdown (Million, %) by Region 2024 & 2032
- Figure 2: North America In Memory Data Grid Industry Revenue (Million), by Country 2024 & 2032
- Figure 3: North America In Memory Data Grid Industry Revenue Share (%), by Country 2024 & 2032
- Figure 4: Europe In Memory Data Grid Industry Revenue (Million), by Country 2024 & 2032
- Figure 5: Europe In Memory Data Grid Industry Revenue Share (%), by Country 2024 & 2032
- Figure 6: Asia Pacific In Memory Data Grid Industry Revenue (Million), by Country 2024 & 2032
- Figure 7: Asia Pacific In Memory Data Grid Industry Revenue Share (%), by Country 2024 & 2032
- Figure 8: South America In Memory Data Grid Industry Revenue (Million), by Country 2024 & 2032
- Figure 9: South America In Memory Data Grid Industry Revenue Share (%), by Country 2024 & 2032
- Figure 10: North America In Memory Data Grid Industry Revenue (Million), by Country 2024 & 2032
- Figure 11: North America In Memory Data Grid Industry Revenue Share (%), by Country 2024 & 2032
- Figure 12: MEA In Memory Data Grid Industry Revenue (Million), by Country 2024 & 2032
- Figure 13: MEA In Memory Data Grid Industry Revenue Share (%), by Country 2024 & 2032
- Figure 14: North America In Memory Data Grid Industry Revenue (Million), by Component 2024 & 2032
- Figure 15: North America In Memory Data Grid Industry Revenue Share (%), by Component 2024 & 2032
- Figure 16: North America In Memory Data Grid Industry Revenue (Million), by Deployment Type 2024 & 2032
- Figure 17: North America In Memory Data Grid Industry Revenue Share (%), by Deployment Type 2024 & 2032
- Figure 18: North America In Memory Data Grid Industry Revenue (Million), by End-user Industry 2024 & 2032
- Figure 19: North America In Memory Data Grid Industry Revenue Share (%), by End-user Industry 2024 & 2032
- Figure 20: North America In Memory Data Grid Industry Revenue (Million), by Country 2024 & 2032
- Figure 21: North America In Memory Data Grid Industry Revenue Share (%), by Country 2024 & 2032
- Figure 22: Europe In Memory Data Grid Industry Revenue (Million), by Component 2024 & 2032
- Figure 23: Europe In Memory Data Grid Industry Revenue Share (%), by Component 2024 & 2032
- Figure 24: Europe In Memory Data Grid Industry Revenue (Million), by Deployment Type 2024 & 2032
- Figure 25: Europe In Memory Data Grid Industry Revenue Share (%), by Deployment Type 2024 & 2032
- Figure 26: Europe In Memory Data Grid Industry Revenue (Million), by End-user Industry 2024 & 2032
- Figure 27: Europe In Memory Data Grid Industry Revenue Share (%), by End-user Industry 2024 & 2032
- Figure 28: Europe In Memory Data Grid Industry Revenue (Million), by Country 2024 & 2032
- Figure 29: Europe In Memory Data Grid Industry Revenue Share (%), by Country 2024 & 2032
- Figure 30: Asia Pacific In Memory Data Grid Industry Revenue (Million), by Component 2024 & 2032
- Figure 31: Asia Pacific In Memory Data Grid Industry Revenue Share (%), by Component 2024 & 2032
- Figure 32: Asia Pacific In Memory Data Grid Industry Revenue (Million), by Deployment Type 2024 & 2032
- Figure 33: Asia Pacific In Memory Data Grid Industry Revenue Share (%), by Deployment Type 2024 & 2032
- Figure 34: Asia Pacific In Memory Data Grid Industry Revenue (Million), by End-user Industry 2024 & 2032
- Figure 35: Asia Pacific In Memory Data Grid Industry Revenue Share (%), by End-user Industry 2024 & 2032
- Figure 36: Asia Pacific In Memory Data Grid Industry Revenue (Million), by Country 2024 & 2032
- Figure 37: Asia Pacific In Memory Data Grid Industry Revenue Share (%), by Country 2024 & 2032
- Figure 38: Latin America In Memory Data Grid Industry Revenue (Million), by Component 2024 & 2032
- Figure 39: Latin America In Memory Data Grid Industry Revenue Share (%), by Component 2024 & 2032
- Figure 40: Latin America In Memory Data Grid Industry Revenue (Million), by Deployment Type 2024 & 2032
- Figure 41: Latin America In Memory Data Grid Industry Revenue Share (%), by Deployment Type 2024 & 2032
- Figure 42: Latin America In Memory Data Grid Industry Revenue (Million), by End-user Industry 2024 & 2032
- Figure 43: Latin America In Memory Data Grid Industry Revenue Share (%), by End-user Industry 2024 & 2032
- Figure 44: Latin America In Memory Data Grid Industry Revenue (Million), by Country 2024 & 2032
- Figure 45: Latin America In Memory Data Grid Industry Revenue Share (%), by Country 2024 & 2032
- Figure 46: Middle East and Africa In Memory Data Grid Industry Revenue (Million), by Component 2024 & 2032
- Figure 47: Middle East and Africa In Memory Data Grid Industry Revenue Share (%), by Component 2024 & 2032
- Figure 48: Middle East and Africa In Memory Data Grid Industry Revenue (Million), by Deployment Type 2024 & 2032
- Figure 49: Middle East and Africa In Memory Data Grid Industry Revenue Share (%), by Deployment Type 2024 & 2032
- Figure 50: Middle East and Africa In Memory Data Grid Industry Revenue (Million), by End-user Industry 2024 & 2032
- Figure 51: Middle East and Africa In Memory Data Grid Industry Revenue Share (%), by End-user Industry 2024 & 2032
- Figure 52: Middle East and Africa In Memory Data Grid Industry Revenue (Million), by Country 2024 & 2032
- Figure 53: Middle East and Africa In Memory Data Grid Industry Revenue Share (%), by Country 2024 & 2032
List of Tables
- Table 1: Global In Memory Data Grid Industry Revenue Million Forecast, by Region 2019 & 2032
- Table 2: Global In Memory Data Grid Industry Revenue Million Forecast, by Component 2019 & 2032
- Table 3: Global In Memory Data Grid Industry Revenue Million Forecast, by Deployment Type 2019 & 2032
- Table 4: Global In Memory Data Grid Industry Revenue Million Forecast, by End-user Industry 2019 & 2032
- Table 5: Global In Memory Data Grid Industry Revenue Million Forecast, by Region 2019 & 2032
- Table 6: Global In Memory Data Grid Industry Revenue Million Forecast, by Country 2019 & 2032
- Table 7: United States In Memory Data Grid Industry Revenue (Million) Forecast, by Application 2019 & 2032
- Table 8: Canada In Memory Data Grid Industry Revenue (Million) Forecast, by Application 2019 & 2032
- Table 9: Mexico In Memory Data Grid Industry Revenue (Million) Forecast, by Application 2019 & 2032
- Table 10: Global In Memory Data Grid Industry Revenue Million Forecast, by Country 2019 & 2032
- Table 11: Germany In Memory Data Grid Industry Revenue (Million) Forecast, by Application 2019 & 2032
- Table 12: United Kingdom In Memory Data Grid Industry Revenue (Million) Forecast, by Application 2019 & 2032
- Table 13: France In Memory Data Grid Industry Revenue (Million) Forecast, by Application 2019 & 2032
- Table 14: Spain In Memory Data Grid Industry Revenue (Million) Forecast, by Application 2019 & 2032
- Table 15: Italy In Memory Data Grid Industry Revenue (Million) Forecast, by Application 2019 & 2032
- Table 16: Spain In Memory Data Grid Industry Revenue (Million) Forecast, by Application 2019 & 2032
- Table 17: Belgium In Memory Data Grid Industry Revenue (Million) Forecast, by Application 2019 & 2032
- Table 18: Netherland In Memory Data Grid Industry Revenue (Million) Forecast, by Application 2019 & 2032
- Table 19: Nordics In Memory Data Grid Industry Revenue (Million) Forecast, by Application 2019 & 2032
- Table 20: Rest of Europe In Memory Data Grid Industry Revenue (Million) Forecast, by Application 2019 & 2032
- Table 21: Global In Memory Data Grid Industry Revenue Million Forecast, by Country 2019 & 2032
- Table 22: China In Memory Data Grid Industry Revenue (Million) Forecast, by Application 2019 & 2032
- Table 23: Japan In Memory Data Grid Industry Revenue (Million) Forecast, by Application 2019 & 2032
- Table 24: India In Memory Data Grid Industry Revenue (Million) Forecast, by Application 2019 & 2032
- Table 25: South Korea In Memory Data Grid Industry Revenue (Million) Forecast, by Application 2019 & 2032
- Table 26: Southeast Asia In Memory Data Grid Industry Revenue (Million) Forecast, by Application 2019 & 2032
- Table 27: Australia In Memory Data Grid Industry Revenue (Million) Forecast, by Application 2019 & 2032
- Table 28: Indonesia In Memory Data Grid Industry Revenue (Million) Forecast, by Application 2019 & 2032
- Table 29: Phillipes In Memory Data Grid Industry Revenue (Million) Forecast, by Application 2019 & 2032
- Table 30: Singapore In Memory Data Grid Industry Revenue (Million) Forecast, by Application 2019 & 2032
- Table 31: Thailandc In Memory Data Grid Industry Revenue (Million) Forecast, by Application 2019 & 2032
- Table 32: Rest of Asia Pacific In Memory Data Grid Industry Revenue (Million) Forecast, by Application 2019 & 2032
- Table 33: Global In Memory Data Grid Industry Revenue Million Forecast, by Country 2019 & 2032
- Table 34: Brazil In Memory Data Grid Industry Revenue (Million) Forecast, by Application 2019 & 2032
- Table 35: Argentina In Memory Data Grid Industry Revenue (Million) Forecast, by Application 2019 & 2032
- Table 36: Peru In Memory Data Grid Industry Revenue (Million) Forecast, by Application 2019 & 2032
- Table 37: Chile In Memory Data Grid Industry Revenue (Million) Forecast, by Application 2019 & 2032
- Table 38: Colombia In Memory Data Grid Industry Revenue (Million) Forecast, by Application 2019 & 2032
- Table 39: Ecuador In Memory Data Grid Industry Revenue (Million) Forecast, by Application 2019 & 2032
- Table 40: Venezuela In Memory Data Grid Industry Revenue (Million) Forecast, by Application 2019 & 2032
- Table 41: Rest of South America In Memory Data Grid Industry Revenue (Million) Forecast, by Application 2019 & 2032
- Table 42: Global In Memory Data Grid Industry Revenue Million Forecast, by Country 2019 & 2032
- Table 43: United States In Memory Data Grid Industry Revenue (Million) Forecast, by Application 2019 & 2032
- Table 44: Canada In Memory Data Grid Industry Revenue (Million) Forecast, by Application 2019 & 2032
- Table 45: Mexico In Memory Data Grid Industry Revenue (Million) Forecast, by Application 2019 & 2032
- Table 46: Global In Memory Data Grid Industry Revenue Million Forecast, by Country 2019 & 2032
- Table 47: United Arab Emirates In Memory Data Grid Industry Revenue (Million) Forecast, by Application 2019 & 2032
- Table 48: Saudi Arabia In Memory Data Grid Industry Revenue (Million) Forecast, by Application 2019 & 2032
- Table 49: South Africa In Memory Data Grid Industry Revenue (Million) Forecast, by Application 2019 & 2032
- Table 50: Rest of Middle East and Africa In Memory Data Grid Industry Revenue (Million) Forecast, by Application 2019 & 2032
- Table 51: Global In Memory Data Grid Industry Revenue Million Forecast, by Component 2019 & 2032
- Table 52: Global In Memory Data Grid Industry Revenue Million Forecast, by Deployment Type 2019 & 2032
- Table 53: Global In Memory Data Grid Industry Revenue Million Forecast, by End-user Industry 2019 & 2032
- Table 54: Global In Memory Data Grid Industry Revenue Million Forecast, by Country 2019 & 2032
- Table 55: Global In Memory Data Grid Industry Revenue Million Forecast, by Component 2019 & 2032
- Table 56: Global In Memory Data Grid Industry Revenue Million Forecast, by Deployment Type 2019 & 2032
- Table 57: Global In Memory Data Grid Industry Revenue Million Forecast, by End-user Industry 2019 & 2032
- Table 58: Global In Memory Data Grid Industry Revenue Million Forecast, by Country 2019 & 2032
- Table 59: Global In Memory Data Grid Industry Revenue Million Forecast, by Component 2019 & 2032
- Table 60: Global In Memory Data Grid Industry Revenue Million Forecast, by Deployment Type 2019 & 2032
- Table 61: Global In Memory Data Grid Industry Revenue Million Forecast, by End-user Industry 2019 & 2032
- Table 62: Global In Memory Data Grid Industry Revenue Million Forecast, by Country 2019 & 2032
- Table 63: Global In Memory Data Grid Industry Revenue Million Forecast, by Component 2019 & 2032
- Table 64: Global In Memory Data Grid Industry Revenue Million Forecast, by Deployment Type 2019 & 2032
- Table 65: Global In Memory Data Grid Industry Revenue Million Forecast, by End-user Industry 2019 & 2032
- Table 66: Global In Memory Data Grid Industry Revenue Million Forecast, by Country 2019 & 2032
- Table 67: Global In Memory Data Grid Industry Revenue Million Forecast, by Component 2019 & 2032
- Table 68: Global In Memory Data Grid Industry Revenue Million Forecast, by Deployment Type 2019 & 2032
- Table 69: Global In Memory Data Grid Industry Revenue Million Forecast, by End-user Industry 2019 & 2032
- Table 70: Global In Memory Data Grid Industry Revenue Million Forecast, by Country 2019 & 2032
Frequently Asked Questions
1. What is the projected Compound Annual Growth Rate (CAGR) of the In Memory Data Grid Industry?
The projected CAGR is approximately 19.23%.
2. Which companies are prominent players in the In Memory Data Grid Industry?
Key companies in the market include GigaSpaces Technologies Inc, IBM Corporation, Software AG, Alachisoft, TIBCO Software Inc *List Not Exhaustive, Oracle Corporation, GridGain Systems Inc, Pivotal (VMware Inc ), ScaleOut Software, Hazelcast Inc.
3. What are the main segments of the In Memory Data Grid Industry?
The market segments include Component, Deployment Type, End-user Industry.
4. Can you provide details about the market size?
The market size is estimated to be USD 3.80 Million as of 2022.
5. What are some drivers contributing to market growth?
Increasing Need for Attaining Unprecedented Levels of Speed at Data Processing; Growth of Big Data.
6. What are the notable trends driving market growth?
Growing Need for Real Time Data Processing in BFSI Driving the Market Growth.
7. Are there any restraints impacting market growth?
High Costs and Operational Concerns; Concerns related to Geoprivacy and Confidential Data.
8. Can you provide examples of recent developments in the market?
May 2022: Intesa Sanpaolo, one of the biggest banks in Italy, uses Optane DIMMs and in-memory software for its servers and makes applications run faster. With this, the bank is able to recover a database instance from storage drives in approximately two seconds with software-defined memory-to-memory services.
9. What pricing options are available for accessing the report?
Pricing options include single-user, multi-user, and enterprise licenses priced at USD 4750, USD 5250, and USD 8750 respectively.
10. Is the market size provided in terms of value or volume?
The market size is provided in terms of value, measured in Million.
11. Are there any specific market keywords associated with the report?
Yes, the market keyword associated with the report is "In Memory Data Grid Industry," which aids in identifying and referencing the specific market segment covered.
12. How do I determine which pricing option suits my needs best?
The pricing options vary based on user requirements and access needs. Individual users may opt for single-user licenses, while businesses requiring broader access may choose multi-user or enterprise licenses for cost-effective access to the report.
13. Are there any additional resources or data provided in the In Memory Data Grid Industry report?
While the report offers comprehensive insights, it's advisable to review the specific contents or supplementary materials provided to ascertain if additional resources or data are available.
14. How can I stay updated on further developments or reports in the In Memory Data Grid Industry?
To stay informed about further developments, trends, and reports in the In Memory Data Grid Industry, consider subscribing to industry newsletters, following relevant companies and organizations, or regularly checking reputable industry news sources and publications.
Methodology
Step 1 - Identification of Relevant Samples Size from Population Database


Step 2 - Approaches for Defining Global Market Size (Value, Volume* & Price*)

Note*: In applicable scenarios
Step 3 - Data Sources
Primary Research
- Web Analytics
- Survey Reports
- Research Institute
- Latest Research Reports
- Opinion Leaders
Secondary Research
- Annual Reports
- White Paper
- Latest Press Release
- Industry Association
- Paid Database
- Investor Presentations

Step 4 - Data Triangulation
Involves using different sources of information in order to increase the validity of a study
These sources are likely to be stakeholders in a program - participants, other researchers, program staff, other community members, and so on.
Then we put all data in single framework & apply various statistical tools to find out the dynamic on the market.
During the analysis stage, feedback from the stakeholder groups would be compared to determine areas of agreement as well as areas of divergence


