
Key Insights
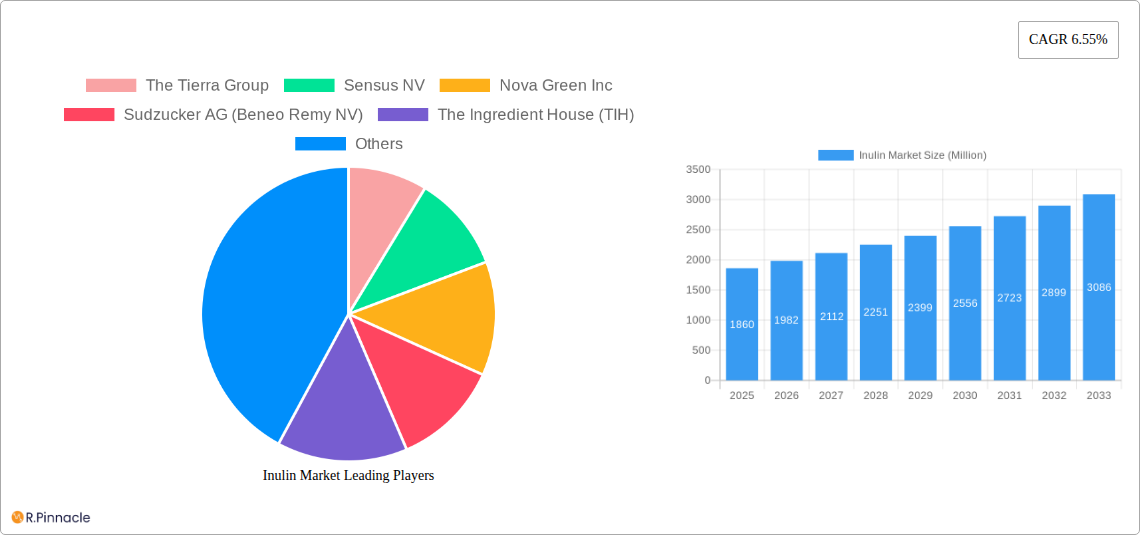
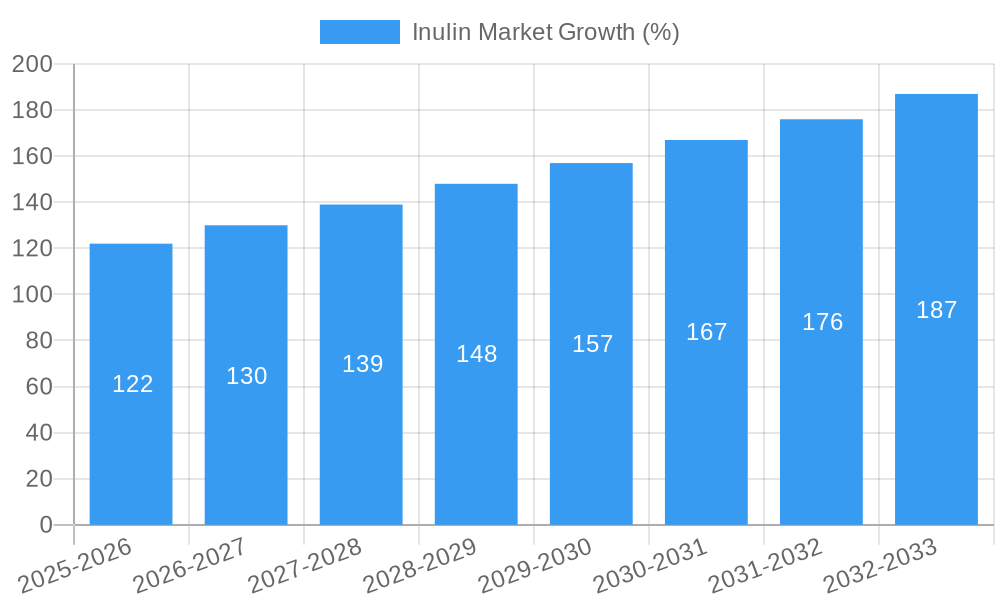
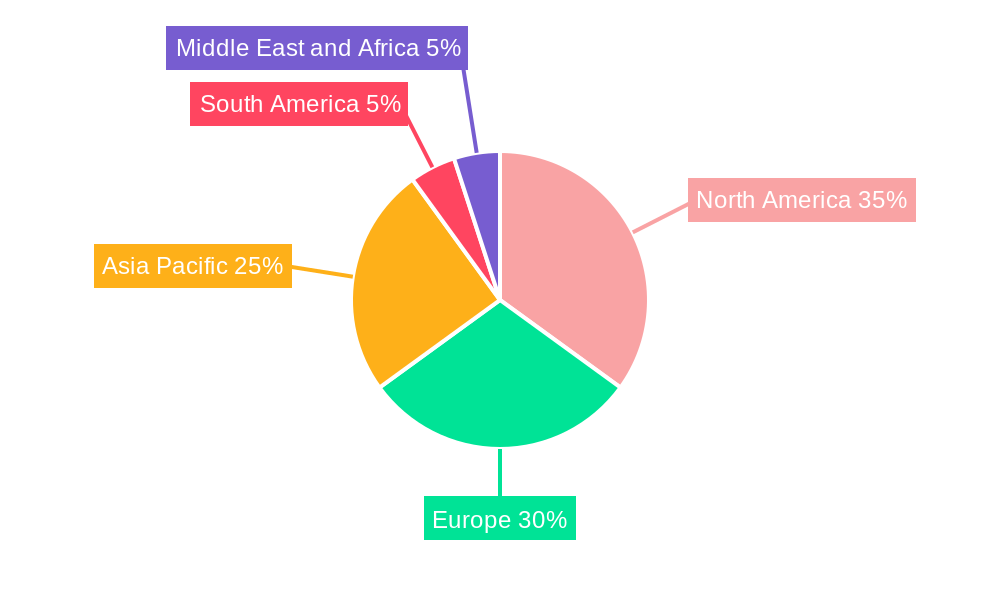
The global inulin market, valued at $1.86 billion in 2025, is projected to experience robust growth, driven by increasing consumer demand for functional foods and dietary supplements. A Compound Annual Growth Rate (CAGR) of 6.55% from 2025 to 2033 indicates a significant expansion, primarily fueled by the rising prevalence of health-conscious consumers seeking natural prebiotics and fiber sources. The food and beverage industry is a major driver, with inulin increasingly incorporated into products like yogurt, bakery items, and confectionery to enhance texture, improve digestive health, and cater to the growing demand for low-calorie, high-fiber options. The pharmaceutical and dietary supplement sectors also contribute significantly, utilizing inulin's prebiotic properties in various formulations for gut health improvement and overall wellness. Market segmentation shows a strong presence across regions, with North America and Europe holding substantial market share due to high consumer awareness and established product distribution channels. However, the Asia-Pacific region is poised for rapid expansion due to increasing disposable incomes and growing health consciousness in developing economies. While challenges exist, such as price fluctuations in raw materials and potential regulatory hurdles, the overall market outlook remains optimistic, promising consistent growth in the coming years. The competitive landscape features both established multinational corporations and specialized ingredient suppliers, highlighting the diverse and dynamic nature of this market.
The continued growth of the inulin market is further supported by ongoing research highlighting the significant health benefits associated with prebiotic consumption. This fuels innovation in product development, with companies focusing on incorporating inulin into novel food formats and specialized dietary supplements. The market's success is also tied to the increasing awareness of gut health's role in overall well-being, prompting consumers to actively seek out products that support gut microbiota balance. Furthermore, the growing popularity of plant-based and clean-label products presents opportunities for inulin as a natural and versatile ingredient. While pricing and competition remain key factors influencing market dynamics, the inherent advantages of inulin as a functional food ingredient are expected to continue driving its adoption across various applications, ultimately sustaining strong market growth through 2033.
Inulin Market Report: A Comprehensive Analysis (2019-2033)
This in-depth report provides a comprehensive analysis of the Inulin Market, offering invaluable insights for industry professionals, investors, and strategic decision-makers. Covering the period from 2019 to 2033, with a focus on 2025, this report meticulously examines market dynamics, competitive landscapes, and future growth potential. Benefit from actionable intelligence, detailed segmentation, and insightful forecasts to navigate the evolving inulin market effectively.
Inulin Market Structure & Innovation Trends
This section analyzes the competitive landscape of the inulin market, examining market concentration, innovation drivers, regulatory influences, and significant M&A activities. The analysis covers the period from 2019-2024, projecting trends through 2033.
Market Concentration: The inulin market exhibits a moderately concentrated structure, with key players holding significant market shares. Precise figures for market share are unavailable for this report, but analysis reveals a dynamic landscape with ongoing consolidation. The xx Million market value suggests a few major players controlling a significant portion.
Innovation Drivers: Growing demand for natural prebiotics in food and dietary supplements fuels innovation in inulin production and application. Research into new extraction methods, functional properties, and customized product formulations contributes to market expansion.
Regulatory Frameworks: Regulations concerning food additives and health claims influence the inulin market. Compliance and adherence to these regulations are essential for market players. Specific regulatory details vary geographically and require country-specific analysis.
Product Substitutes: While inulin enjoys a unique position as a prebiotic fiber, it faces competition from other dietary fibers. The specific substitutes and their market impact require in-depth competitive analysis.
End-User Demographics: The primary end-users are food and beverage manufacturers, dietary supplement producers, and pharmaceutical companies. Specific demographic trends within these segments require further research for this report.
M&A Activities: Significant mergers and acquisitions have shaped the inulin market, such as the 2020 acquisition of Marroquin Organic International Inc. by AgranaStarke GmbH. While precise M&A deal values are not included in this report due to data limitations, these activities indicate consolidation and growth strategies within the sector.
Inulin Market Dynamics & Trends
This section dives into the market's growth drivers, technological advancements, evolving consumer preferences, and the competitive dynamics influencing the inulin market's trajectory from 2019 to 2033.
The inulin market is experiencing significant growth, driven by increasing consumer awareness of gut health and the benefits of prebiotics. The rising demand for plant-based foods and functional foods is a key driver, propelling the market's expansion. Technological advancements in inulin extraction and processing are enhancing product quality and efficiency. The shift towards healthier lifestyles and increased consumption of dietary supplements further fuels market growth.
The Compound Annual Growth Rate (CAGR) for the inulin market is projected to be xx% during the forecast period (2025-2033), indicating strong growth potential. Market penetration remains high in developed countries, while emerging economies offer significant untapped opportunities. Competitive dynamics are characterized by both established players and new entrants, leading to product diversification and price competition.
Dominant Regions & Segments in Inulin Market
This section identifies the leading regions and market segments for inulin, based on application (Food and Beverage, Other Foods and Beverages, Dietary Supplements, Pharmaceuticals).
Leading Regions: (Specific regional dominance analysis requires further data. This section will be updated with specific information upon availability)
Leading Segments:
- Food and Beverage: This segment dominates the inulin market due to its widespread use as a functional ingredient in various food products.
- Dietary Supplements: The increasing popularity of prebiotic supplements is driving strong growth in this segment.
- Pharmaceuticals: Inulin finds niche applications in pharmaceuticals, with potential for future growth.
- Other Foods and Beverages: This includes smaller, yet growing niche applications in specific food products.
Key Drivers (Examples, detailed analysis requires further data):
- Economic policies supporting the food industry
- Infrastructure supporting efficient supply chains
Inulin Market Product Innovations
Recent innovations in the inulin market focus on enhancing functionalities, such as improved solubility, texture, and taste profiles. These advancements are driving wider adoption across various applications. The development of new extraction technologies is improving efficiency and reducing costs. Furthermore, customized inulin formulations tailored to specific applications are enhancing market competitiveness.
Report Scope & Segmentation Analysis
This report segments the inulin market based on application:
Food and Beverage: This segment is projected to grow at xx% CAGR during the forecast period, driven by rising demand for prebiotic-enriched foods. The market is highly competitive, with major players focusing on product differentiation.
Other Foods and Beverages: This segment offers specialized applications with xx Million market size in 2025, and significant growth potential in niche markets.
Dietary Supplements: This fast-growing segment is projected to achieve a xx% CAGR, driven by health-conscious consumers. Competitive intensity is moderate.
Pharmaceuticals: This segment shows moderate growth with a xx Million market size projected for 2025, driven by applications in targeted therapies.
Key Drivers of Inulin Market Growth
The inulin market is propelled by several key factors: the growing awareness of gut health and the benefits of prebiotics; the increasing demand for plant-based and functional foods; technological advancements in inulin extraction and processing; and favorable regulatory frameworks promoting the use of natural ingredients.
Challenges in the Inulin Market Sector
The inulin market faces challenges, including fluctuations in raw material prices, the complexity of supply chain management, and competitive pressures from other dietary fibers. Furthermore, regulatory hurdles in different regions can pose significant challenges. These factors impact market dynamics and need careful management.
Emerging Opportunities in Inulin Market
Emerging opportunities lie in expanding into new geographic markets, particularly in developing economies. Further innovation in inulin functionalities, the development of novel applications in personalized nutrition, and increased investment in research and development all present opportunities for market expansion.
Leading Players in the Inulin Market
- The Tierra Group
- Sensus NV
- Nova Green Inc
- Südzucker AG (Beneo Remy NV)
- The Ingredient House (TIH)
- Ciranda Inc
- Adept Impex Private Limited
- Cosucra Groupe Warcoing SA
- Cargill Inc
- The Green Labs LLC
- List Not Exhaustive
Key Developments in Inulin Market Industry
- March 2022: Sensus announced plans to expand inulin production to meet growing demand.
- December 2021: Beneo invested USD 33.9 Million to expand its inulin production capacity.
- March 2020: AgranaStarke GmbH acquired Marroquin Organic International Inc.
Future Outlook for Inulin Market
The inulin market is poised for continued growth, driven by evolving consumer preferences, technological advancements, and expanding applications. Strategic investments in research and development, along with targeted marketing campaigns highlighting the health benefits of inulin, will further drive market expansion. The market offers significant opportunities for established players and new entrants alike.
Inulin Market Segmentation
-
1. Application
-
1.1. Food and Beverage
- 1.1.1. Bakery and Confectionery
- 1.1.2. Dairy Products
- 1.1.3. Meat Products
- 1.1.4. Other Foods and Beverages
- 1.2. Dietary Supplements
- 1.3. Pharmaceuticals
-
1.1. Food and Beverage
Inulin Market Segmentation By Geography
-
1. North America
- 1.1. United States
- 1.2. Canada
- 1.3. Mexico
- 1.4. Rest of North America
-
2. Europe
- 2.1. United Kindgom
- 2.2. France
- 2.3. Germany
- 2.4. Spain
- 2.5. Rest of Europe
-
3. Asia Pacific
- 3.1. China
- 3.2. Japan
- 3.3. Australia
- 3.4. India
- 3.5. Rest of Asia Pacific
-
4. South America
- 4.1. Brazil
- 4.2. Argentina
- 4.3. Rest of South America
-
5. Middle East and Africa
- 5.1. South Africa
- 5.2. Saudi Arabia
- 5.3. Rest of Middle East and Africa
Inulin Market REPORT HIGHLIGHTS
| Aspects | Details |
|---|---|
| Study Period | 2019-2033 |
| Base Year | 2024 |
| Estimated Year | 2025 |
| Forecast Period | 2025-2033 |
| Historical Period | 2019-2024 |
| Growth Rate | CAGR of 6.55% from 2019-2033 |
| Segmentation |
|
Table of Contents
- 1. Introduction
- 1.1. Research Scope
- 1.2. Market Segmentation
- 1.3. Research Methodology
- 1.4. Definitions and Assumptions
- 2. Executive Summary
- 2.1. Introduction
- 3. Market Dynamics
- 3.1. Introduction
- 3.2. Market Drivers
- 3.2.1. Wide Applications and Functionality; Demand For Gluten-Free Products
- 3.3. Market Restrains
- 3.3.1. Easy Availability of Economically Feasible Alternatives
- 3.4. Market Trends
- 3.4.1. Growing Consumers’ Interest in Prebiotics
- 4. Market Factor Analysis
- 4.1. Porters Five Forces
- 4.2. Supply/Value Chain
- 4.3. PESTEL analysis
- 4.4. Market Entropy
- 4.5. Patent/Trademark Analysis
- 5. Global Inulin Market Analysis, Insights and Forecast, 2019-2031
- 5.1. Market Analysis, Insights and Forecast - by Application
- 5.1.1. Food and Beverage
- 5.1.1.1. Bakery and Confectionery
- 5.1.1.2. Dairy Products
- 5.1.1.3. Meat Products
- 5.1.1.4. Other Foods and Beverages
- 5.1.2. Dietary Supplements
- 5.1.3. Pharmaceuticals
- 5.1.1. Food and Beverage
- 5.2. Market Analysis, Insights and Forecast - by Region
- 5.2.1. North America
- 5.2.2. Europe
- 5.2.3. Asia Pacific
- 5.2.4. South America
- 5.2.5. Middle East and Africa
- 5.1. Market Analysis, Insights and Forecast - by Application
- 6. North America Inulin Market Analysis, Insights and Forecast, 2019-2031
- 6.1. Market Analysis, Insights and Forecast - by Application
- 6.1.1. Food and Beverage
- 6.1.1.1. Bakery and Confectionery
- 6.1.1.2. Dairy Products
- 6.1.1.3. Meat Products
- 6.1.1.4. Other Foods and Beverages
- 6.1.2. Dietary Supplements
- 6.1.3. Pharmaceuticals
- 6.1.1. Food and Beverage
- 6.1. Market Analysis, Insights and Forecast - by Application
- 7. Europe Inulin Market Analysis, Insights and Forecast, 2019-2031
- 7.1. Market Analysis, Insights and Forecast - by Application
- 7.1.1. Food and Beverage
- 7.1.1.1. Bakery and Confectionery
- 7.1.1.2. Dairy Products
- 7.1.1.3. Meat Products
- 7.1.1.4. Other Foods and Beverages
- 7.1.2. Dietary Supplements
- 7.1.3. Pharmaceuticals
- 7.1.1. Food and Beverage
- 7.1. Market Analysis, Insights and Forecast - by Application
- 8. Asia Pacific Inulin Market Analysis, Insights and Forecast, 2019-2031
- 8.1. Market Analysis, Insights and Forecast - by Application
- 8.1.1. Food and Beverage
- 8.1.1.1. Bakery and Confectionery
- 8.1.1.2. Dairy Products
- 8.1.1.3. Meat Products
- 8.1.1.4. Other Foods and Beverages
- 8.1.2. Dietary Supplements
- 8.1.3. Pharmaceuticals
- 8.1.1. Food and Beverage
- 8.1. Market Analysis, Insights and Forecast - by Application
- 9. South America Inulin Market Analysis, Insights and Forecast, 2019-2031
- 9.1. Market Analysis, Insights and Forecast - by Application
- 9.1.1. Food and Beverage
- 9.1.1.1. Bakery and Confectionery
- 9.1.1.2. Dairy Products
- 9.1.1.3. Meat Products
- 9.1.1.4. Other Foods and Beverages
- 9.1.2. Dietary Supplements
- 9.1.3. Pharmaceuticals
- 9.1.1. Food and Beverage
- 9.1. Market Analysis, Insights and Forecast - by Application
- 10. Middle East and Africa Inulin Market Analysis, Insights and Forecast, 2019-2031
- 10.1. Market Analysis, Insights and Forecast - by Application
- 10.1.1. Food and Beverage
- 10.1.1.1. Bakery and Confectionery
- 10.1.1.2. Dairy Products
- 10.1.1.3. Meat Products
- 10.1.1.4. Other Foods and Beverages
- 10.1.2. Dietary Supplements
- 10.1.3. Pharmaceuticals
- 10.1.1. Food and Beverage
- 10.1. Market Analysis, Insights and Forecast - by Application
- 11. North America Inulin Market Analysis, Insights and Forecast, 2019-2031
- 11.1. Market Analysis, Insights and Forecast - By Country/Sub-region
- 11.1.1 United States
- 11.1.2 Canada
- 11.1.3 Mexico
- 11.1.4 Rest of North America
- 12. Europe Inulin Market Analysis, Insights and Forecast, 2019-2031
- 12.1. Market Analysis, Insights and Forecast - By Country/Sub-region
- 12.1.1 United Kindgom
- 12.1.2 France
- 12.1.3 Germany
- 12.1.4 Spain
- 12.1.5 Rest of Europe
- 13. Asia Pacific Inulin Market Analysis, Insights and Forecast, 2019-2031
- 13.1. Market Analysis, Insights and Forecast - By Country/Sub-region
- 13.1.1 China
- 13.1.2 Japan
- 13.1.3 Australia
- 13.1.4 India
- 13.1.5 Rest of Asia Pacific
- 14. South America Inulin Market Analysis, Insights and Forecast, 2019-2031
- 14.1. Market Analysis, Insights and Forecast - By Country/Sub-region
- 14.1.1 Brazil
- 14.1.2 Argentina
- 14.1.3 Rest of South America
- 15. Middle East and Africa Inulin Market Analysis, Insights and Forecast, 2019-2031
- 15.1. Market Analysis, Insights and Forecast - By Country/Sub-region
- 15.1.1 South Africa
- 15.1.2 Saudi Arabia
- 15.1.3 Rest of Middle East and Africa
- 16. Competitive Analysis
- 16.1. Global Market Share Analysis 2024
- 16.2. Company Profiles
- 16.2.1 The Tierra Group
- 16.2.1.1. Overview
- 16.2.1.2. Products
- 16.2.1.3. SWOT Analysis
- 16.2.1.4. Recent Developments
- 16.2.1.5. Financials (Based on Availability)
- 16.2.2 Sensus NV
- 16.2.2.1. Overview
- 16.2.2.2. Products
- 16.2.2.3. SWOT Analysis
- 16.2.2.4. Recent Developments
- 16.2.2.5. Financials (Based on Availability)
- 16.2.3 Nova Green Inc
- 16.2.3.1. Overview
- 16.2.3.2. Products
- 16.2.3.3. SWOT Analysis
- 16.2.3.4. Recent Developments
- 16.2.3.5. Financials (Based on Availability)
- 16.2.4 Sudzucker AG (Beneo Remy NV)
- 16.2.4.1. Overview
- 16.2.4.2. Products
- 16.2.4.3. SWOT Analysis
- 16.2.4.4. Recent Developments
- 16.2.4.5. Financials (Based on Availability)
- 16.2.5 The Ingredient House (TIH)
- 16.2.5.1. Overview
- 16.2.5.2. Products
- 16.2.5.3. SWOT Analysis
- 16.2.5.4. Recent Developments
- 16.2.5.5. Financials (Based on Availability)
- 16.2.6 Ciranda Inc
- 16.2.6.1. Overview
- 16.2.6.2. Products
- 16.2.6.3. SWOT Analysis
- 16.2.6.4. Recent Developments
- 16.2.6.5. Financials (Based on Availability)
- 16.2.7 Adept Impex Private Limited
- 16.2.7.1. Overview
- 16.2.7.2. Products
- 16.2.7.3. SWOT Analysis
- 16.2.7.4. Recent Developments
- 16.2.7.5. Financials (Based on Availability)
- 16.2.8 Cosucra Groupe Warcoing SA
- 16.2.8.1. Overview
- 16.2.8.2. Products
- 16.2.8.3. SWOT Analysis
- 16.2.8.4. Recent Developments
- 16.2.8.5. Financials (Based on Availability)
- 16.2.9 Cargill Inc
- 16.2.9.1. Overview
- 16.2.9.2. Products
- 16.2.9.3. SWOT Analysis
- 16.2.9.4. Recent Developments
- 16.2.9.5. Financials (Based on Availability)
- 16.2.10 The Green Labs LLC*List Not Exhaustive
- 16.2.10.1. Overview
- 16.2.10.2. Products
- 16.2.10.3. SWOT Analysis
- 16.2.10.4. Recent Developments
- 16.2.10.5. Financials (Based on Availability)
- 16.2.1 The Tierra Group
List of Figures
- Figure 1: Global Inulin Market Revenue Breakdown (Million, %) by Region 2024 & 2032
- Figure 2: North America Inulin Market Revenue (Million), by Country 2024 & 2032
- Figure 3: North America Inulin Market Revenue Share (%), by Country 2024 & 2032
- Figure 4: Europe Inulin Market Revenue (Million), by Country 2024 & 2032
- Figure 5: Europe Inulin Market Revenue Share (%), by Country 2024 & 2032
- Figure 6: Asia Pacific Inulin Market Revenue (Million), by Country 2024 & 2032
- Figure 7: Asia Pacific Inulin Market Revenue Share (%), by Country 2024 & 2032
- Figure 8: South America Inulin Market Revenue (Million), by Country 2024 & 2032
- Figure 9: South America Inulin Market Revenue Share (%), by Country 2024 & 2032
- Figure 10: Middle East and Africa Inulin Market Revenue (Million), by Country 2024 & 2032
- Figure 11: Middle East and Africa Inulin Market Revenue Share (%), by Country 2024 & 2032
- Figure 12: North America Inulin Market Revenue (Million), by Application 2024 & 2032
- Figure 13: North America Inulin Market Revenue Share (%), by Application 2024 & 2032
- Figure 14: North America Inulin Market Revenue (Million), by Country 2024 & 2032
- Figure 15: North America Inulin Market Revenue Share (%), by Country 2024 & 2032
- Figure 16: Europe Inulin Market Revenue (Million), by Application 2024 & 2032
- Figure 17: Europe Inulin Market Revenue Share (%), by Application 2024 & 2032
- Figure 18: Europe Inulin Market Revenue (Million), by Country 2024 & 2032
- Figure 19: Europe Inulin Market Revenue Share (%), by Country 2024 & 2032
- Figure 20: Asia Pacific Inulin Market Revenue (Million), by Application 2024 & 2032
- Figure 21: Asia Pacific Inulin Market Revenue Share (%), by Application 2024 & 2032
- Figure 22: Asia Pacific Inulin Market Revenue (Million), by Country 2024 & 2032
- Figure 23: Asia Pacific Inulin Market Revenue Share (%), by Country 2024 & 2032
- Figure 24: South America Inulin Market Revenue (Million), by Application 2024 & 2032
- Figure 25: South America Inulin Market Revenue Share (%), by Application 2024 & 2032
- Figure 26: South America Inulin Market Revenue (Million), by Country 2024 & 2032
- Figure 27: South America Inulin Market Revenue Share (%), by Country 2024 & 2032
- Figure 28: Middle East and Africa Inulin Market Revenue (Million), by Application 2024 & 2032
- Figure 29: Middle East and Africa Inulin Market Revenue Share (%), by Application 2024 & 2032
- Figure 30: Middle East and Africa Inulin Market Revenue (Million), by Country 2024 & 2032
- Figure 31: Middle East and Africa Inulin Market Revenue Share (%), by Country 2024 & 2032
List of Tables
- Table 1: Global Inulin Market Revenue Million Forecast, by Region 2019 & 2032
- Table 2: Global Inulin Market Revenue Million Forecast, by Application 2019 & 2032
- Table 3: Global Inulin Market Revenue Million Forecast, by Region 2019 & 2032
- Table 4: Global Inulin Market Revenue Million Forecast, by Country 2019 & 2032
- Table 5: United States Inulin Market Revenue (Million) Forecast, by Application 2019 & 2032
- Table 6: Canada Inulin Market Revenue (Million) Forecast, by Application 2019 & 2032
- Table 7: Mexico Inulin Market Revenue (Million) Forecast, by Application 2019 & 2032
- Table 8: Rest of North America Inulin Market Revenue (Million) Forecast, by Application 2019 & 2032
- Table 9: Global Inulin Market Revenue Million Forecast, by Country 2019 & 2032
- Table 10: United Kindgom Inulin Market Revenue (Million) Forecast, by Application 2019 & 2032
- Table 11: France Inulin Market Revenue (Million) Forecast, by Application 2019 & 2032
- Table 12: Germany Inulin Market Revenue (Million) Forecast, by Application 2019 & 2032
- Table 13: Spain Inulin Market Revenue (Million) Forecast, by Application 2019 & 2032
- Table 14: Rest of Europe Inulin Market Revenue (Million) Forecast, by Application 2019 & 2032
- Table 15: Global Inulin Market Revenue Million Forecast, by Country 2019 & 2032
- Table 16: China Inulin Market Revenue (Million) Forecast, by Application 2019 & 2032
- Table 17: Japan Inulin Market Revenue (Million) Forecast, by Application 2019 & 2032
- Table 18: Australia Inulin Market Revenue (Million) Forecast, by Application 2019 & 2032
- Table 19: India Inulin Market Revenue (Million) Forecast, by Application 2019 & 2032
- Table 20: Rest of Asia Pacific Inulin Market Revenue (Million) Forecast, by Application 2019 & 2032
- Table 21: Global Inulin Market Revenue Million Forecast, by Country 2019 & 2032
- Table 22: Brazil Inulin Market Revenue (Million) Forecast, by Application 2019 & 2032
- Table 23: Argentina Inulin Market Revenue (Million) Forecast, by Application 2019 & 2032
- Table 24: Rest of South America Inulin Market Revenue (Million) Forecast, by Application 2019 & 2032
- Table 25: Global Inulin Market Revenue Million Forecast, by Country 2019 & 2032
- Table 26: South Africa Inulin Market Revenue (Million) Forecast, by Application 2019 & 2032
- Table 27: Saudi Arabia Inulin Market Revenue (Million) Forecast, by Application 2019 & 2032
- Table 28: Rest of Middle East and Africa Inulin Market Revenue (Million) Forecast, by Application 2019 & 2032
- Table 29: Global Inulin Market Revenue Million Forecast, by Application 2019 & 2032
- Table 30: Global Inulin Market Revenue Million Forecast, by Country 2019 & 2032
- Table 31: United States Inulin Market Revenue (Million) Forecast, by Application 2019 & 2032
- Table 32: Canada Inulin Market Revenue (Million) Forecast, by Application 2019 & 2032
- Table 33: Mexico Inulin Market Revenue (Million) Forecast, by Application 2019 & 2032
- Table 34: Rest of North America Inulin Market Revenue (Million) Forecast, by Application 2019 & 2032
- Table 35: Global Inulin Market Revenue Million Forecast, by Application 2019 & 2032
- Table 36: Global Inulin Market Revenue Million Forecast, by Country 2019 & 2032
- Table 37: United Kindgom Inulin Market Revenue (Million) Forecast, by Application 2019 & 2032
- Table 38: France Inulin Market Revenue (Million) Forecast, by Application 2019 & 2032
- Table 39: Germany Inulin Market Revenue (Million) Forecast, by Application 2019 & 2032
- Table 40: Spain Inulin Market Revenue (Million) Forecast, by Application 2019 & 2032
- Table 41: Rest of Europe Inulin Market Revenue (Million) Forecast, by Application 2019 & 2032
- Table 42: Global Inulin Market Revenue Million Forecast, by Application 2019 & 2032
- Table 43: Global Inulin Market Revenue Million Forecast, by Country 2019 & 2032
- Table 44: China Inulin Market Revenue (Million) Forecast, by Application 2019 & 2032
- Table 45: Japan Inulin Market Revenue (Million) Forecast, by Application 2019 & 2032
- Table 46: Australia Inulin Market Revenue (Million) Forecast, by Application 2019 & 2032
- Table 47: India Inulin Market Revenue (Million) Forecast, by Application 2019 & 2032
- Table 48: Rest of Asia Pacific Inulin Market Revenue (Million) Forecast, by Application 2019 & 2032
- Table 49: Global Inulin Market Revenue Million Forecast, by Application 2019 & 2032
- Table 50: Global Inulin Market Revenue Million Forecast, by Country 2019 & 2032
- Table 51: Brazil Inulin Market Revenue (Million) Forecast, by Application 2019 & 2032
- Table 52: Argentina Inulin Market Revenue (Million) Forecast, by Application 2019 & 2032
- Table 53: Rest of South America Inulin Market Revenue (Million) Forecast, by Application 2019 & 2032
- Table 54: Global Inulin Market Revenue Million Forecast, by Application 2019 & 2032
- Table 55: Global Inulin Market Revenue Million Forecast, by Country 2019 & 2032
- Table 56: South Africa Inulin Market Revenue (Million) Forecast, by Application 2019 & 2032
- Table 57: Saudi Arabia Inulin Market Revenue (Million) Forecast, by Application 2019 & 2032
- Table 58: Rest of Middle East and Africa Inulin Market Revenue (Million) Forecast, by Application 2019 & 2032
Frequently Asked Questions
1. What is the projected Compound Annual Growth Rate (CAGR) of the Inulin Market?
The projected CAGR is approximately 6.55%.
2. Which companies are prominent players in the Inulin Market?
Key companies in the market include The Tierra Group, Sensus NV, Nova Green Inc, Sudzucker AG (Beneo Remy NV), The Ingredient House (TIH), Ciranda Inc, Adept Impex Private Limited, Cosucra Groupe Warcoing SA, Cargill Inc, The Green Labs LLC*List Not Exhaustive.
3. What are the main segments of the Inulin Market?
The market segments include Application.
4. Can you provide details about the market size?
The market size is estimated to be USD 1.86 Million as of 2022.
5. What are some drivers contributing to market growth?
Wide Applications and Functionality; Demand For Gluten-Free Products.
6. What are the notable trends driving market growth?
Growing Consumers’ Interest in Prebiotics.
7. Are there any restraints impacting market growth?
Easy Availability of Economically Feasible Alternatives.
8. Can you provide examples of recent developments in the market?
March 2022: Sensus, a Dutch co-op member, announced its plans to expand the production of chicory root fiber (inulin) to meet the growing demand for natural prebiotics in plant-based foods and supplements.
9. What pricing options are available for accessing the report?
Pricing options include single-user, multi-user, and enterprise licenses priced at USD 4750, USD 5250, and USD 8750 respectively.
10. Is the market size provided in terms of value or volume?
The market size is provided in terms of value, measured in Million.
11. Are there any specific market keywords associated with the report?
Yes, the market keyword associated with the report is "Inulin Market," which aids in identifying and referencing the specific market segment covered.
12. How do I determine which pricing option suits my needs best?
The pricing options vary based on user requirements and access needs. Individual users may opt for single-user licenses, while businesses requiring broader access may choose multi-user or enterprise licenses for cost-effective access to the report.
13. Are there any additional resources or data provided in the Inulin Market report?
While the report offers comprehensive insights, it's advisable to review the specific contents or supplementary materials provided to ascertain if additional resources or data are available.
14. How can I stay updated on further developments or reports in the Inulin Market?
To stay informed about further developments, trends, and reports in the Inulin Market, consider subscribing to industry newsletters, following relevant companies and organizations, or regularly checking reputable industry news sources and publications.
Methodology
Step 1 - Identification of Relevant Samples Size from Population Database


Step 2 - Approaches for Defining Global Market Size (Value, Volume* & Price*)

Note*: In applicable scenarios
Step 3 - Data Sources
Primary Research
- Web Analytics
- Survey Reports
- Research Institute
- Latest Research Reports
- Opinion Leaders
Secondary Research
- Annual Reports
- White Paper
- Latest Press Release
- Industry Association
- Paid Database
- Investor Presentations

Step 4 - Data Triangulation
Involves using different sources of information in order to increase the validity of a study
These sources are likely to be stakeholders in a program - participants, other researchers, program staff, other community members, and so on.
Then we put all data in single framework & apply various statistical tools to find out the dynamic on the market.
During the analysis stage, feedback from the stakeholder groups would be compared to determine areas of agreement as well as areas of divergence


