
Key Insights
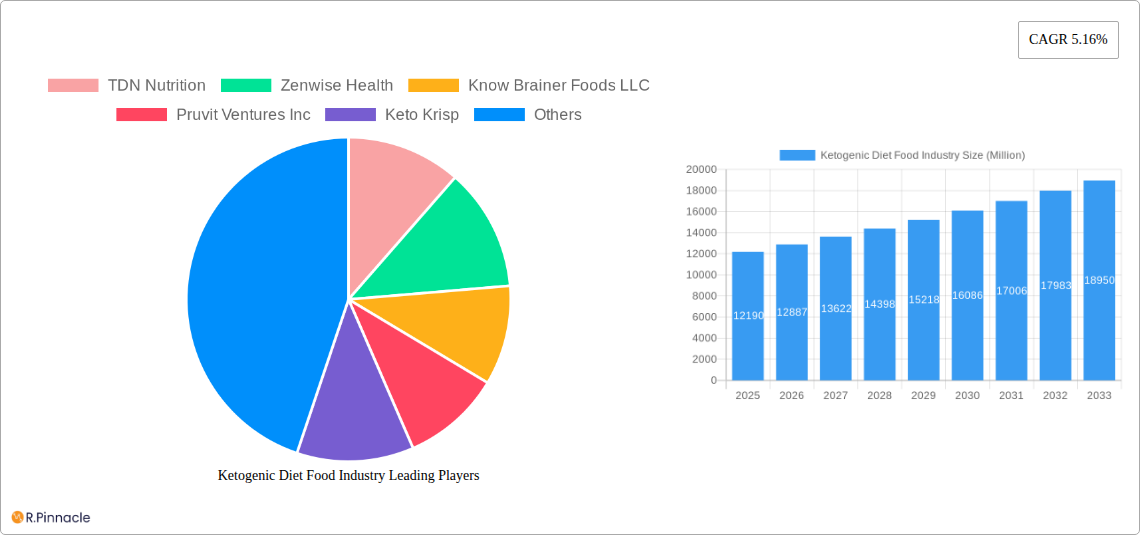
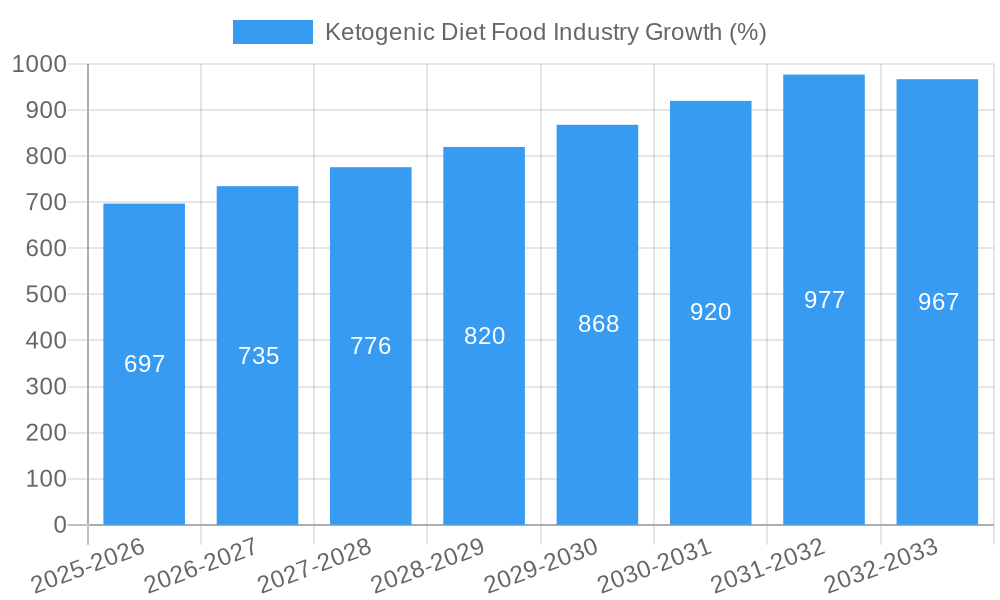
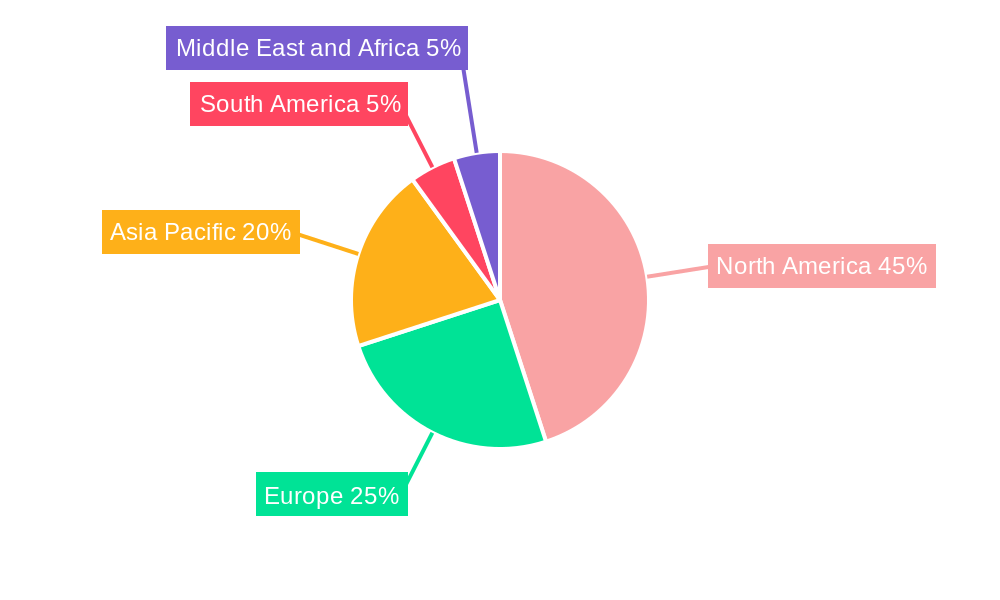
The ketogenic diet food industry, valued at $12.19 billion in 2025, is experiencing robust growth, projected to expand at a Compound Annual Growth Rate (CAGR) of 5.16% from 2025 to 2033. This growth is driven by increasing consumer awareness of the ketogenic diet's potential benefits for weight management, improved metabolic health, and enhanced cognitive function. Rising prevalence of obesity and related health issues, coupled with increased consumer interest in healthier lifestyle choices, fuels market expansion. Key product segments include supplements (e.g., exogenous ketones, MCT oil), beverages (keto-friendly protein shakes, electrolyte drinks), and snacks (keto-friendly bars, chips). The distribution channels are diverse, encompassing supermarkets/hypermarkets, pharmacies, specialty stores, and rapidly growing online retail platforms. Major players like Nestlé, Glanbia PLC, and Perfect Keto LLC are actively shaping market dynamics through product innovation and strategic partnerships. The North American market currently holds a significant share, benefiting from high consumer adoption rates and established distribution networks. However, increasing adoption in Asia-Pacific and Europe suggests promising avenues for future expansion. Challenges include managing consumer misconceptions about the ketogenic diet and ensuring product quality and safety.
The industry faces some restraints such as potential long-term health effects of restrictive diets requiring ongoing research and education. Maintaining the balance of nutritional value and appealing taste profiles is crucial for sustained market growth. Furthermore, addressing consumer concerns around potential side effects and ensuring ingredient sourcing transparency will be vital for the continued success of ketogenic diet food companies. The competitive landscape is dynamic, with established food companies and specialized keto-focused brands vying for market share. Successful players will be those that leverage innovative product development, effective marketing strategies targeting specific health goals, and efficient supply chain management to meet the growing demand. The forecast period of 2025-2033 indicates a significant market expansion fueled by a combination of health-conscious consumer behaviors, scientific advancements in understanding ketogenic diets, and strategic investments from major players.
Ketogenic Diet Food Industry Market Report: 2019-2033
This comprehensive report provides a detailed analysis of the Ketogenic Diet Food Industry, projecting a market value exceeding $XX Million by 2033. Designed for industry professionals, investors, and market researchers, this report offers actionable insights into market trends, competitive landscapes, and future growth opportunities. The study period covers 2019-2033, with 2025 as the base and estimated year.
Ketogenic Diet Food Industry Market Structure & Innovation Trends
The Ketogenic Diet Food Industry is characterized by a moderately fragmented market structure, with a handful of large players alongside numerous smaller, niche brands. Market share is constantly shifting due to innovation and mergers & acquisitions (M&A). Key innovation drivers include the increasing demand for convenient, healthy, and delicious keto-friendly products, coupled with ongoing research into ketogenic diets and their health benefits. Regulatory frameworks, while evolving, generally focus on food safety and labeling. Major product substitutes include traditional diets and other weight-loss products. End-user demographics primarily consist of health-conscious adults seeking weight management and improved metabolic health.
- M&A Activity: Significant M&A activity has shaped the industry landscape. For example, the January 2022 merger of Sun Basket and Pruvit Ventures created a major player in the keto meal kit sector, valued at $XX Million. Other notable deals, with values ranging from $XX Million to $XX Million, have resulted in increased market consolidation. The average deal size is estimated to be $XX Million.
- Market Concentration: The Herfindahl-Hirschman Index (HHI) for the industry is estimated at XX, suggesting a moderately concentrated market with opportunities for both expansion and disruption.
- Top 5 Players' Market Share: The top five companies collectively hold approximately XX% of the market share, with the largest single player holding approximately XX%.
Ketogenic Diet Food Industry Market Dynamics & Trends
The Ketogenic Diet Food Industry is experiencing robust growth, driven by rising consumer awareness of the ketogenic diet's potential health benefits, including weight loss, improved blood sugar control, and increased energy levels. The market is also influenced by technological advancements in food processing and formulation, leading to more convenient and palatable keto-friendly products. Consumer preferences are shifting towards healthier, natural, and ethically sourced ingredients, driving demand for organic and plant-based keto options. Competitive dynamics are intense, with companies focusing on product differentiation, brand building, and strategic partnerships to gain market share.
The Compound Annual Growth Rate (CAGR) for the period 2025-2033 is projected at XX%, significantly higher than the CAGR observed during the historical period (2019-2024) of XX%. Market penetration is estimated to reach XX% by 2033.
Dominant Regions & Segments in Ketogenic Diet Food Industry
The North American market currently dominates the Ketogenic Diet Food Industry, driven by high consumer adoption rates and strong regulatory support. Within North America, the United States holds the largest market share due to high disposable incomes and a large population following ketogenic diets.
- Key Drivers for North American Dominance:
- High consumer awareness of ketogenic diets.
- High disposable incomes allowing for premium product purchases.
- Strong presence of major food and beverage companies actively developing and marketing keto products.
- Developed retail infrastructure facilitating wide product distribution.
By Product Type: The Supplements segment is the largest, driven by the high demand for keto-friendly protein powders, electrolytes, and exogenous ketones. Snacks are the fastest-growing segment due to convenience and increasing product innovation.
By Distribution Channel: Online retail stores are experiencing the fastest growth due to increased e-commerce penetration and the convenience of online shopping. Supermarkets/Hypermarkets remain the largest distribution channel due to wide reach and established consumer habits.
Ketogenic Diet Food Industry Product Innovations
Recent product developments include the launch of innovative keto-friendly snack bars, tortilla chips, and meal kits. These products leverage technological advancements in food processing and ingredient sourcing to create healthier, more convenient, and more appealing options for consumers. Key competitive advantages include improved taste profiles, better texture, and the use of novel ingredients to enhance functionality and nutritional value. The focus is on products that are both effective and delicious.
Report Scope & Segmentation Analysis
This report segments the Ketogenic Diet Food Industry by product type (Supplements, Beverages, Snacks, Other Product Types) and by distribution channel (Supermarkets/Hypermarkets, Pharmacy/Drug Stores, Specialty Stores, Online Retail Stores, Other Distribution Channels). Each segment is analyzed for growth projections, market size, and competitive dynamics. The growth rate of each segment varies depending on evolving consumer preferences and the success of new product launches. Market size estimations show significant growth across all segments.
Key Drivers of Ketogenic Diet Food Industry Growth
The Ketogenic Diet Food Industry's growth is driven by several factors:
- Increased consumer awareness: Growing knowledge of the ketogenic diet's potential benefits for weight loss, metabolic health, and overall well-being.
- Technological advancements: Improved formulations and processing techniques create tastier and more convenient keto-friendly products.
- Favorable regulatory environment: Clearer labeling regulations and support for the industry encourage innovation and growth.
Challenges in the Ketogenic Diet Food Industry Sector
The Ketogenic Diet Food Industry faces several challenges:
- Maintaining product quality and consistency: Ensuring high-quality ingredients and maintaining consistent production are crucial for consumer trust.
- Managing supply chain complexities: Sourcing specific keto-friendly ingredients can be challenging, especially for niche products.
- Intense competition: Attracting and retaining customers in a highly competitive market requires strong branding and product innovation.
Emerging Opportunities in Ketogenic Diet Food Industry
Several promising opportunities exist for the Ketogenic Diet Food Industry:
- Expansion into new geographical markets: Untapped potential exists in developing economies with growing health consciousness.
- Product diversification: Innovating in new product formats like ready-to-eat meals and functional foods offers great growth potential.
- Development of sustainable and ethical products: Consumers increasingly demand products that align with their values.
Leading Players in the Ketogenic Diet Food Industry Market
- TDN Nutrition
- Zenwise Health
- Know Brainer Foods LLC
- Pruvit Ventures Inc
- Keto Krisp
- Glanbia PLC
- Perfect Keto LLC
- Atrium Innovations Inc (Garden Of Life)
- NOW Foods
- American Licorice LLC (Zing Bars)
- Keto and Co
- Nestlé S.A.
Key Developments in Ketogenic Diet Food Industry Industry
- August 2021: Zing Bars launched a new line of keto-friendly snack bars, expanding the snack segment and catering to health-conscious consumers seeking plant-based options.
- January 2022: The merger of Sun Basket and Pruvit Ventures created a significant player in the keto meal kit market, transforming consumer access to ready-to-eat keto options.
- September 2022: You Go! Foods launched Keto Tortilla Chips, fulfilling a significant consumer need for convenient and flavorful keto-friendly snacks. This launch also indicates an expanding private-label sector.
Future Outlook for Ketogenic Diet Food Industry Market
The Ketogenic Diet Food Industry is poised for continued strong growth, driven by increasing consumer adoption, product innovation, and expansion into new markets. Strategic partnerships, acquisitions, and investment in research and development will play a key role in shaping the industry's future. Opportunities exist for companies that can effectively cater to evolving consumer preferences for convenience, health, and sustainability.
Ketogenic Diet Food Industry Segmentation
-
1. Product Type
- 1.1. Supplements
- 1.2. Beverages
- 1.3. Snacks
- 1.4. Other Product Types
-
2. Distribution Channel
- 2.1. Supermarkets/Hypermarkets
- 2.2. Pharmacy/Drug Stores
- 2.3. Specialty Stores
- 2.4. Online Retail Stores
- 2.5. Other Distribution Channels
Ketogenic Diet Food Industry Segmentation By Geography
-
1. North America
- 1.1. United States
- 1.2. Canada
- 1.3. Mexico
- 1.4. Rest of North America
-
2. Europe
- 2.1. United Kingdom
- 2.2. Germany
- 2.3. Spain
- 2.4. France
- 2.5. Italy
- 2.6. Russia
- 2.7. Rest of Europe
-
3. Asia Pacific
- 3.1. China
- 3.2. Japan
- 3.3. India
- 3.4. Australia
- 3.5. Rest of Asia Pacific
-
4. South America
- 4.1. Brazil
- 4.2. Argentina
- 4.3. Rest of South America
-
5. Middle East and Africa
- 5.1. South Africa
- 5.2. United Arab Emirates
- 5.3. Rest of Middle East and Africa
Ketogenic Diet Food Industry REPORT HIGHLIGHTS
| Aspects | Details |
|---|---|
| Study Period | 2019-2033 |
| Base Year | 2024 |
| Estimated Year | 2025 |
| Forecast Period | 2025-2033 |
| Historical Period | 2019-2024 |
| Growth Rate | CAGR of 5.16% from 2019-2033 |
| Segmentation |
|
Table of Contents
- 1. Introduction
- 1.1. Research Scope
- 1.2. Market Segmentation
- 1.3. Research Methodology
- 1.4. Definitions and Assumptions
- 2. Executive Summary
- 2.1. Introduction
- 3. Market Dynamics
- 3.1. Introduction
- 3.2. Market Drivers
- 3.2.1 Increasing Demand for Specialty
- 3.2.2 Organic
- 3.2.3 and Green Coffee; Growing In-House Production of Coffee in the Country
- 3.3. Market Restrains
- 3.3.1. Change in Climatic Conditions Impacting Coffee Plantations
- 3.4. Market Trends
- 3.4.1. Increasing Obesity is Driving the Market Growth
- 4. Market Factor Analysis
- 4.1. Porters Five Forces
- 4.2. Supply/Value Chain
- 4.3. PESTEL analysis
- 4.4. Market Entropy
- 4.5. Patent/Trademark Analysis
- 5. Global Ketogenic Diet Food Industry Analysis, Insights and Forecast, 2019-2031
- 5.1. Market Analysis, Insights and Forecast - by Product Type
- 5.1.1. Supplements
- 5.1.2. Beverages
- 5.1.3. Snacks
- 5.1.4. Other Product Types
- 5.2. Market Analysis, Insights and Forecast - by Distribution Channel
- 5.2.1. Supermarkets/Hypermarkets
- 5.2.2. Pharmacy/Drug Stores
- 5.2.3. Specialty Stores
- 5.2.4. Online Retail Stores
- 5.2.5. Other Distribution Channels
- 5.3. Market Analysis, Insights and Forecast - by Region
- 5.3.1. North America
- 5.3.2. Europe
- 5.3.3. Asia Pacific
- 5.3.4. South America
- 5.3.5. Middle East and Africa
- 5.1. Market Analysis, Insights and Forecast - by Product Type
- 6. North America Ketogenic Diet Food Industry Analysis, Insights and Forecast, 2019-2031
- 6.1. Market Analysis, Insights and Forecast - by Product Type
- 6.1.1. Supplements
- 6.1.2. Beverages
- 6.1.3. Snacks
- 6.1.4. Other Product Types
- 6.2. Market Analysis, Insights and Forecast - by Distribution Channel
- 6.2.1. Supermarkets/Hypermarkets
- 6.2.2. Pharmacy/Drug Stores
- 6.2.3. Specialty Stores
- 6.2.4. Online Retail Stores
- 6.2.5. Other Distribution Channels
- 6.1. Market Analysis, Insights and Forecast - by Product Type
- 7. Europe Ketogenic Diet Food Industry Analysis, Insights and Forecast, 2019-2031
- 7.1. Market Analysis, Insights and Forecast - by Product Type
- 7.1.1. Supplements
- 7.1.2. Beverages
- 7.1.3. Snacks
- 7.1.4. Other Product Types
- 7.2. Market Analysis, Insights and Forecast - by Distribution Channel
- 7.2.1. Supermarkets/Hypermarkets
- 7.2.2. Pharmacy/Drug Stores
- 7.2.3. Specialty Stores
- 7.2.4. Online Retail Stores
- 7.2.5. Other Distribution Channels
- 7.1. Market Analysis, Insights and Forecast - by Product Type
- 8. Asia Pacific Ketogenic Diet Food Industry Analysis, Insights and Forecast, 2019-2031
- 8.1. Market Analysis, Insights and Forecast - by Product Type
- 8.1.1. Supplements
- 8.1.2. Beverages
- 8.1.3. Snacks
- 8.1.4. Other Product Types
- 8.2. Market Analysis, Insights and Forecast - by Distribution Channel
- 8.2.1. Supermarkets/Hypermarkets
- 8.2.2. Pharmacy/Drug Stores
- 8.2.3. Specialty Stores
- 8.2.4. Online Retail Stores
- 8.2.5. Other Distribution Channels
- 8.1. Market Analysis, Insights and Forecast - by Product Type
- 9. South America Ketogenic Diet Food Industry Analysis, Insights and Forecast, 2019-2031
- 9.1. Market Analysis, Insights and Forecast - by Product Type
- 9.1.1. Supplements
- 9.1.2. Beverages
- 9.1.3. Snacks
- 9.1.4. Other Product Types
- 9.2. Market Analysis, Insights and Forecast - by Distribution Channel
- 9.2.1. Supermarkets/Hypermarkets
- 9.2.2. Pharmacy/Drug Stores
- 9.2.3. Specialty Stores
- 9.2.4. Online Retail Stores
- 9.2.5. Other Distribution Channels
- 9.1. Market Analysis, Insights and Forecast - by Product Type
- 10. Middle East and Africa Ketogenic Diet Food Industry Analysis, Insights and Forecast, 2019-2031
- 10.1. Market Analysis, Insights and Forecast - by Product Type
- 10.1.1. Supplements
- 10.1.2. Beverages
- 10.1.3. Snacks
- 10.1.4. Other Product Types
- 10.2. Market Analysis, Insights and Forecast - by Distribution Channel
- 10.2.1. Supermarkets/Hypermarkets
- 10.2.2. Pharmacy/Drug Stores
- 10.2.3. Specialty Stores
- 10.2.4. Online Retail Stores
- 10.2.5. Other Distribution Channels
- 10.1. Market Analysis, Insights and Forecast - by Product Type
- 11. North America Ketogenic Diet Food Industry Analysis, Insights and Forecast, 2019-2031
- 11.1. Market Analysis, Insights and Forecast - By Country/Sub-region
- 11.1.1 United States
- 11.1.2 Canada
- 11.1.3 Mexico
- 11.1.4 Rest of North America
- 12. Europe Ketogenic Diet Food Industry Analysis, Insights and Forecast, 2019-2031
- 12.1. Market Analysis, Insights and Forecast - By Country/Sub-region
- 12.1.1 United Kingdom
- 12.1.2 Germany
- 12.1.3 Spain
- 12.1.4 France
- 12.1.5 Italy
- 12.1.6 Russia
- 12.1.7 Rest of Europe
- 13. Asia Pacific Ketogenic Diet Food Industry Analysis, Insights and Forecast, 2019-2031
- 13.1. Market Analysis, Insights and Forecast - By Country/Sub-region
- 13.1.1 China
- 13.1.2 Japan
- 13.1.3 India
- 13.1.4 Australia
- 13.1.5 Rest of Asia Pacific
- 14. South America Ketogenic Diet Food Industry Analysis, Insights and Forecast, 2019-2031
- 14.1. Market Analysis, Insights and Forecast - By Country/Sub-region
- 14.1.1 Brazil
- 14.1.2 Argentina
- 14.1.3 Rest of South America
- 15. Middle East and Africa Ketogenic Diet Food Industry Analysis, Insights and Forecast, 2019-2031
- 15.1. Market Analysis, Insights and Forecast - By Country/Sub-region
- 15.1.1 South Africa
- 15.1.2 United Arab Emirates
- 15.1.3 Rest of Middle East and Africa
- 16. Competitive Analysis
- 16.1. Global Market Share Analysis 2024
- 16.2. Company Profiles
- 16.2.1 TDN Nutrition
- 16.2.1.1. Overview
- 16.2.1.2. Products
- 16.2.1.3. SWOT Analysis
- 16.2.1.4. Recent Developments
- 16.2.1.5. Financials (Based on Availability)
- 16.2.2 Zenwise Health
- 16.2.2.1. Overview
- 16.2.2.2. Products
- 16.2.2.3. SWOT Analysis
- 16.2.2.4. Recent Developments
- 16.2.2.5. Financials (Based on Availability)
- 16.2.3 Know Brainer Foods LLC
- 16.2.3.1. Overview
- 16.2.3.2. Products
- 16.2.3.3. SWOT Analysis
- 16.2.3.4. Recent Developments
- 16.2.3.5. Financials (Based on Availability)
- 16.2.4 Pruvit Ventures Inc
- 16.2.4.1. Overview
- 16.2.4.2. Products
- 16.2.4.3. SWOT Analysis
- 16.2.4.4. Recent Developments
- 16.2.4.5. Financials (Based on Availability)
- 16.2.5 Keto Krisp
- 16.2.5.1. Overview
- 16.2.5.2. Products
- 16.2.5.3. SWOT Analysis
- 16.2.5.4. Recent Developments
- 16.2.5.5. Financials (Based on Availability)
- 16.2.6 Glanbia PLC
- 16.2.6.1. Overview
- 16.2.6.2. Products
- 16.2.6.3. SWOT Analysis
- 16.2.6.4. Recent Developments
- 16.2.6.5. Financials (Based on Availability)
- 16.2.7 Perfect Keto LLC
- 16.2.7.1. Overview
- 16.2.7.2. Products
- 16.2.7.3. SWOT Analysis
- 16.2.7.4. Recent Developments
- 16.2.7.5. Financials (Based on Availability)
- 16.2.8 Atrium Innovations Inc (Garden Of Life)
- 16.2.8.1. Overview
- 16.2.8.2. Products
- 16.2.8.3. SWOT Analysis
- 16.2.8.4. Recent Developments
- 16.2.8.5. Financials (Based on Availability)
- 16.2.9 NOW Foods
- 16.2.9.1. Overview
- 16.2.9.2. Products
- 16.2.9.3. SWOT Analysis
- 16.2.9.4. Recent Developments
- 16.2.9.5. Financials (Based on Availability)
- 16.2.10 American Licorice LLC (Zing Bars)*List Not Exhaustive
- 16.2.10.1. Overview
- 16.2.10.2. Products
- 16.2.10.3. SWOT Analysis
- 16.2.10.4. Recent Developments
- 16.2.10.5. Financials (Based on Availability)
- 16.2.11 Keto and Co
- 16.2.11.1. Overview
- 16.2.11.2. Products
- 16.2.11.3. SWOT Analysis
- 16.2.11.4. Recent Developments
- 16.2.11.5. Financials (Based on Availability)
- 16.2.12 Nestlé S A
- 16.2.12.1. Overview
- 16.2.12.2. Products
- 16.2.12.3. SWOT Analysis
- 16.2.12.4. Recent Developments
- 16.2.12.5. Financials (Based on Availability)
- 16.2.1 TDN Nutrition
List of Figures
- Figure 1: Global Ketogenic Diet Food Industry Revenue Breakdown (Million, %) by Region 2024 & 2032
- Figure 2: North America Ketogenic Diet Food Industry Revenue (Million), by Country 2024 & 2032
- Figure 3: North America Ketogenic Diet Food Industry Revenue Share (%), by Country 2024 & 2032
- Figure 4: Europe Ketogenic Diet Food Industry Revenue (Million), by Country 2024 & 2032
- Figure 5: Europe Ketogenic Diet Food Industry Revenue Share (%), by Country 2024 & 2032
- Figure 6: Asia Pacific Ketogenic Diet Food Industry Revenue (Million), by Country 2024 & 2032
- Figure 7: Asia Pacific Ketogenic Diet Food Industry Revenue Share (%), by Country 2024 & 2032
- Figure 8: South America Ketogenic Diet Food Industry Revenue (Million), by Country 2024 & 2032
- Figure 9: South America Ketogenic Diet Food Industry Revenue Share (%), by Country 2024 & 2032
- Figure 10: Middle East and Africa Ketogenic Diet Food Industry Revenue (Million), by Country 2024 & 2032
- Figure 11: Middle East and Africa Ketogenic Diet Food Industry Revenue Share (%), by Country 2024 & 2032
- Figure 12: North America Ketogenic Diet Food Industry Revenue (Million), by Product Type 2024 & 2032
- Figure 13: North America Ketogenic Diet Food Industry Revenue Share (%), by Product Type 2024 & 2032
- Figure 14: North America Ketogenic Diet Food Industry Revenue (Million), by Distribution Channel 2024 & 2032
- Figure 15: North America Ketogenic Diet Food Industry Revenue Share (%), by Distribution Channel 2024 & 2032
- Figure 16: North America Ketogenic Diet Food Industry Revenue (Million), by Country 2024 & 2032
- Figure 17: North America Ketogenic Diet Food Industry Revenue Share (%), by Country 2024 & 2032
- Figure 18: Europe Ketogenic Diet Food Industry Revenue (Million), by Product Type 2024 & 2032
- Figure 19: Europe Ketogenic Diet Food Industry Revenue Share (%), by Product Type 2024 & 2032
- Figure 20: Europe Ketogenic Diet Food Industry Revenue (Million), by Distribution Channel 2024 & 2032
- Figure 21: Europe Ketogenic Diet Food Industry Revenue Share (%), by Distribution Channel 2024 & 2032
- Figure 22: Europe Ketogenic Diet Food Industry Revenue (Million), by Country 2024 & 2032
- Figure 23: Europe Ketogenic Diet Food Industry Revenue Share (%), by Country 2024 & 2032
- Figure 24: Asia Pacific Ketogenic Diet Food Industry Revenue (Million), by Product Type 2024 & 2032
- Figure 25: Asia Pacific Ketogenic Diet Food Industry Revenue Share (%), by Product Type 2024 & 2032
- Figure 26: Asia Pacific Ketogenic Diet Food Industry Revenue (Million), by Distribution Channel 2024 & 2032
- Figure 27: Asia Pacific Ketogenic Diet Food Industry Revenue Share (%), by Distribution Channel 2024 & 2032
- Figure 28: Asia Pacific Ketogenic Diet Food Industry Revenue (Million), by Country 2024 & 2032
- Figure 29: Asia Pacific Ketogenic Diet Food Industry Revenue Share (%), by Country 2024 & 2032
- Figure 30: South America Ketogenic Diet Food Industry Revenue (Million), by Product Type 2024 & 2032
- Figure 31: South America Ketogenic Diet Food Industry Revenue Share (%), by Product Type 2024 & 2032
- Figure 32: South America Ketogenic Diet Food Industry Revenue (Million), by Distribution Channel 2024 & 2032
- Figure 33: South America Ketogenic Diet Food Industry Revenue Share (%), by Distribution Channel 2024 & 2032
- Figure 34: South America Ketogenic Diet Food Industry Revenue (Million), by Country 2024 & 2032
- Figure 35: South America Ketogenic Diet Food Industry Revenue Share (%), by Country 2024 & 2032
- Figure 36: Middle East and Africa Ketogenic Diet Food Industry Revenue (Million), by Product Type 2024 & 2032
- Figure 37: Middle East and Africa Ketogenic Diet Food Industry Revenue Share (%), by Product Type 2024 & 2032
- Figure 38: Middle East and Africa Ketogenic Diet Food Industry Revenue (Million), by Distribution Channel 2024 & 2032
- Figure 39: Middle East and Africa Ketogenic Diet Food Industry Revenue Share (%), by Distribution Channel 2024 & 2032
- Figure 40: Middle East and Africa Ketogenic Diet Food Industry Revenue (Million), by Country 2024 & 2032
- Figure 41: Middle East and Africa Ketogenic Diet Food Industry Revenue Share (%), by Country 2024 & 2032
List of Tables
- Table 1: Global Ketogenic Diet Food Industry Revenue Million Forecast, by Region 2019 & 2032
- Table 2: Global Ketogenic Diet Food Industry Revenue Million Forecast, by Product Type 2019 & 2032
- Table 3: Global Ketogenic Diet Food Industry Revenue Million Forecast, by Distribution Channel 2019 & 2032
- Table 4: Global Ketogenic Diet Food Industry Revenue Million Forecast, by Region 2019 & 2032
- Table 5: Global Ketogenic Diet Food Industry Revenue Million Forecast, by Country 2019 & 2032
- Table 6: United States Ketogenic Diet Food Industry Revenue (Million) Forecast, by Application 2019 & 2032
- Table 7: Canada Ketogenic Diet Food Industry Revenue (Million) Forecast, by Application 2019 & 2032
- Table 8: Mexico Ketogenic Diet Food Industry Revenue (Million) Forecast, by Application 2019 & 2032
- Table 9: Rest of North America Ketogenic Diet Food Industry Revenue (Million) Forecast, by Application 2019 & 2032
- Table 10: Global Ketogenic Diet Food Industry Revenue Million Forecast, by Country 2019 & 2032
- Table 11: United Kingdom Ketogenic Diet Food Industry Revenue (Million) Forecast, by Application 2019 & 2032
- Table 12: Germany Ketogenic Diet Food Industry Revenue (Million) Forecast, by Application 2019 & 2032
- Table 13: Spain Ketogenic Diet Food Industry Revenue (Million) Forecast, by Application 2019 & 2032
- Table 14: France Ketogenic Diet Food Industry Revenue (Million) Forecast, by Application 2019 & 2032
- Table 15: Italy Ketogenic Diet Food Industry Revenue (Million) Forecast, by Application 2019 & 2032
- Table 16: Russia Ketogenic Diet Food Industry Revenue (Million) Forecast, by Application 2019 & 2032
- Table 17: Rest of Europe Ketogenic Diet Food Industry Revenue (Million) Forecast, by Application 2019 & 2032
- Table 18: Global Ketogenic Diet Food Industry Revenue Million Forecast, by Country 2019 & 2032
- Table 19: China Ketogenic Diet Food Industry Revenue (Million) Forecast, by Application 2019 & 2032
- Table 20: Japan Ketogenic Diet Food Industry Revenue (Million) Forecast, by Application 2019 & 2032
- Table 21: India Ketogenic Diet Food Industry Revenue (Million) Forecast, by Application 2019 & 2032
- Table 22: Australia Ketogenic Diet Food Industry Revenue (Million) Forecast, by Application 2019 & 2032
- Table 23: Rest of Asia Pacific Ketogenic Diet Food Industry Revenue (Million) Forecast, by Application 2019 & 2032
- Table 24: Global Ketogenic Diet Food Industry Revenue Million Forecast, by Country 2019 & 2032
- Table 25: Brazil Ketogenic Diet Food Industry Revenue (Million) Forecast, by Application 2019 & 2032
- Table 26: Argentina Ketogenic Diet Food Industry Revenue (Million) Forecast, by Application 2019 & 2032
- Table 27: Rest of South America Ketogenic Diet Food Industry Revenue (Million) Forecast, by Application 2019 & 2032
- Table 28: Global Ketogenic Diet Food Industry Revenue Million Forecast, by Country 2019 & 2032
- Table 29: South Africa Ketogenic Diet Food Industry Revenue (Million) Forecast, by Application 2019 & 2032
- Table 30: United Arab Emirates Ketogenic Diet Food Industry Revenue (Million) Forecast, by Application 2019 & 2032
- Table 31: Rest of Middle East and Africa Ketogenic Diet Food Industry Revenue (Million) Forecast, by Application 2019 & 2032
- Table 32: Global Ketogenic Diet Food Industry Revenue Million Forecast, by Product Type 2019 & 2032
- Table 33: Global Ketogenic Diet Food Industry Revenue Million Forecast, by Distribution Channel 2019 & 2032
- Table 34: Global Ketogenic Diet Food Industry Revenue Million Forecast, by Country 2019 & 2032
- Table 35: United States Ketogenic Diet Food Industry Revenue (Million) Forecast, by Application 2019 & 2032
- Table 36: Canada Ketogenic Diet Food Industry Revenue (Million) Forecast, by Application 2019 & 2032
- Table 37: Mexico Ketogenic Diet Food Industry Revenue (Million) Forecast, by Application 2019 & 2032
- Table 38: Rest of North America Ketogenic Diet Food Industry Revenue (Million) Forecast, by Application 2019 & 2032
- Table 39: Global Ketogenic Diet Food Industry Revenue Million Forecast, by Product Type 2019 & 2032
- Table 40: Global Ketogenic Diet Food Industry Revenue Million Forecast, by Distribution Channel 2019 & 2032
- Table 41: Global Ketogenic Diet Food Industry Revenue Million Forecast, by Country 2019 & 2032
- Table 42: United Kingdom Ketogenic Diet Food Industry Revenue (Million) Forecast, by Application 2019 & 2032
- Table 43: Germany Ketogenic Diet Food Industry Revenue (Million) Forecast, by Application 2019 & 2032
- Table 44: Spain Ketogenic Diet Food Industry Revenue (Million) Forecast, by Application 2019 & 2032
- Table 45: France Ketogenic Diet Food Industry Revenue (Million) Forecast, by Application 2019 & 2032
- Table 46: Italy Ketogenic Diet Food Industry Revenue (Million) Forecast, by Application 2019 & 2032
- Table 47: Russia Ketogenic Diet Food Industry Revenue (Million) Forecast, by Application 2019 & 2032
- Table 48: Rest of Europe Ketogenic Diet Food Industry Revenue (Million) Forecast, by Application 2019 & 2032
- Table 49: Global Ketogenic Diet Food Industry Revenue Million Forecast, by Product Type 2019 & 2032
- Table 50: Global Ketogenic Diet Food Industry Revenue Million Forecast, by Distribution Channel 2019 & 2032
- Table 51: Global Ketogenic Diet Food Industry Revenue Million Forecast, by Country 2019 & 2032
- Table 52: China Ketogenic Diet Food Industry Revenue (Million) Forecast, by Application 2019 & 2032
- Table 53: Japan Ketogenic Diet Food Industry Revenue (Million) Forecast, by Application 2019 & 2032
- Table 54: India Ketogenic Diet Food Industry Revenue (Million) Forecast, by Application 2019 & 2032
- Table 55: Australia Ketogenic Diet Food Industry Revenue (Million) Forecast, by Application 2019 & 2032
- Table 56: Rest of Asia Pacific Ketogenic Diet Food Industry Revenue (Million) Forecast, by Application 2019 & 2032
- Table 57: Global Ketogenic Diet Food Industry Revenue Million Forecast, by Product Type 2019 & 2032
- Table 58: Global Ketogenic Diet Food Industry Revenue Million Forecast, by Distribution Channel 2019 & 2032
- Table 59: Global Ketogenic Diet Food Industry Revenue Million Forecast, by Country 2019 & 2032
- Table 60: Brazil Ketogenic Diet Food Industry Revenue (Million) Forecast, by Application 2019 & 2032
- Table 61: Argentina Ketogenic Diet Food Industry Revenue (Million) Forecast, by Application 2019 & 2032
- Table 62: Rest of South America Ketogenic Diet Food Industry Revenue (Million) Forecast, by Application 2019 & 2032
- Table 63: Global Ketogenic Diet Food Industry Revenue Million Forecast, by Product Type 2019 & 2032
- Table 64: Global Ketogenic Diet Food Industry Revenue Million Forecast, by Distribution Channel 2019 & 2032
- Table 65: Global Ketogenic Diet Food Industry Revenue Million Forecast, by Country 2019 & 2032
- Table 66: South Africa Ketogenic Diet Food Industry Revenue (Million) Forecast, by Application 2019 & 2032
- Table 67: United Arab Emirates Ketogenic Diet Food Industry Revenue (Million) Forecast, by Application 2019 & 2032
- Table 68: Rest of Middle East and Africa Ketogenic Diet Food Industry Revenue (Million) Forecast, by Application 2019 & 2032
Frequently Asked Questions
1. What is the projected Compound Annual Growth Rate (CAGR) of the Ketogenic Diet Food Industry?
The projected CAGR is approximately 5.16%.
2. Which companies are prominent players in the Ketogenic Diet Food Industry?
Key companies in the market include TDN Nutrition, Zenwise Health, Know Brainer Foods LLC, Pruvit Ventures Inc, Keto Krisp, Glanbia PLC, Perfect Keto LLC, Atrium Innovations Inc (Garden Of Life), NOW Foods, American Licorice LLC (Zing Bars)*List Not Exhaustive, Keto and Co, Nestlé S A.
3. What are the main segments of the Ketogenic Diet Food Industry?
The market segments include Product Type, Distribution Channel.
4. Can you provide details about the market size?
The market size is estimated to be USD 12.19 Million as of 2022.
5. What are some drivers contributing to market growth?
Increasing Demand for Specialty. Organic. and Green Coffee; Growing In-House Production of Coffee in the Country.
6. What are the notable trends driving market growth?
Increasing Obesity is Driving the Market Growth.
7. Are there any restraints impacting market growth?
Change in Climatic Conditions Impacting Coffee Plantations.
8. Can you provide examples of recent developments in the market?
September 2022: You Go! Foods launched its Keto Tortilla Chips throughout the United States to satisfy consumer demand for keto snack chips. You Go! Food tortilla chips are available through major retailers and You Go! Foods website, with early private-label sale commitments as well.
9. What pricing options are available for accessing the report?
Pricing options include single-user, multi-user, and enterprise licenses priced at USD 4750, USD 5250, and USD 8750 respectively.
10. Is the market size provided in terms of value or volume?
The market size is provided in terms of value, measured in Million.
11. Are there any specific market keywords associated with the report?
Yes, the market keyword associated with the report is "Ketogenic Diet Food Industry," which aids in identifying and referencing the specific market segment covered.
12. How do I determine which pricing option suits my needs best?
The pricing options vary based on user requirements and access needs. Individual users may opt for single-user licenses, while businesses requiring broader access may choose multi-user or enterprise licenses for cost-effective access to the report.
13. Are there any additional resources or data provided in the Ketogenic Diet Food Industry report?
While the report offers comprehensive insights, it's advisable to review the specific contents or supplementary materials provided to ascertain if additional resources or data are available.
14. How can I stay updated on further developments or reports in the Ketogenic Diet Food Industry?
To stay informed about further developments, trends, and reports in the Ketogenic Diet Food Industry, consider subscribing to industry newsletters, following relevant companies and organizations, or regularly checking reputable industry news sources and publications.
Methodology
Step 1 - Identification of Relevant Samples Size from Population Database


Step 2 - Approaches for Defining Global Market Size (Value, Volume* & Price*)

Note*: In applicable scenarios
Step 3 - Data Sources
Primary Research
- Web Analytics
- Survey Reports
- Research Institute
- Latest Research Reports
- Opinion Leaders
Secondary Research
- Annual Reports
- White Paper
- Latest Press Release
- Industry Association
- Paid Database
- Investor Presentations

Step 4 - Data Triangulation
Involves using different sources of information in order to increase the validity of a study
These sources are likely to be stakeholders in a program - participants, other researchers, program staff, other community members, and so on.
Then we put all data in single framework & apply various statistical tools to find out the dynamic on the market.
During the analysis stage, feedback from the stakeholder groups would be compared to determine areas of agreement as well as areas of divergence


