
Key Insights
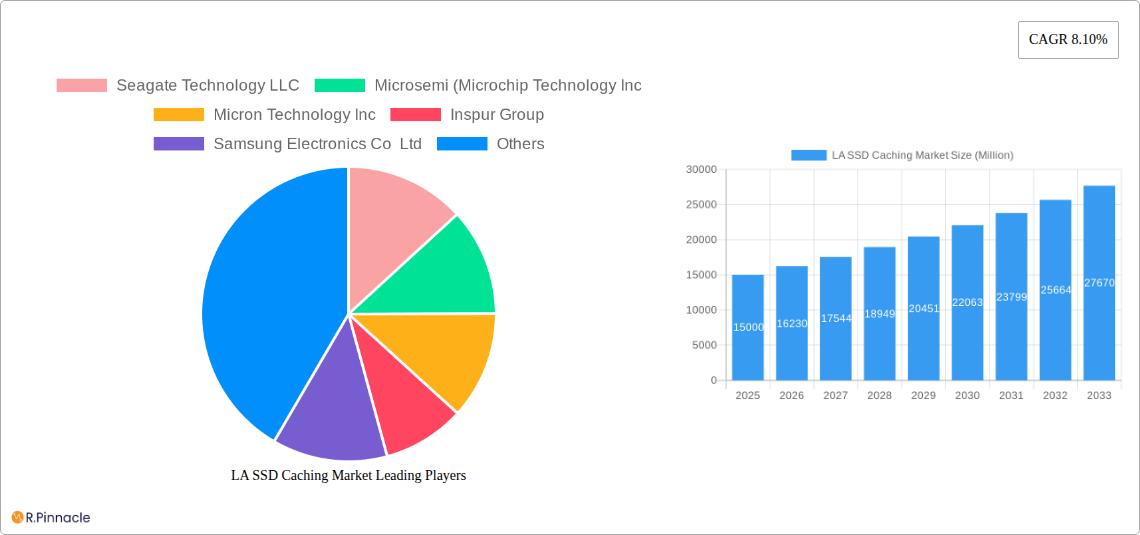
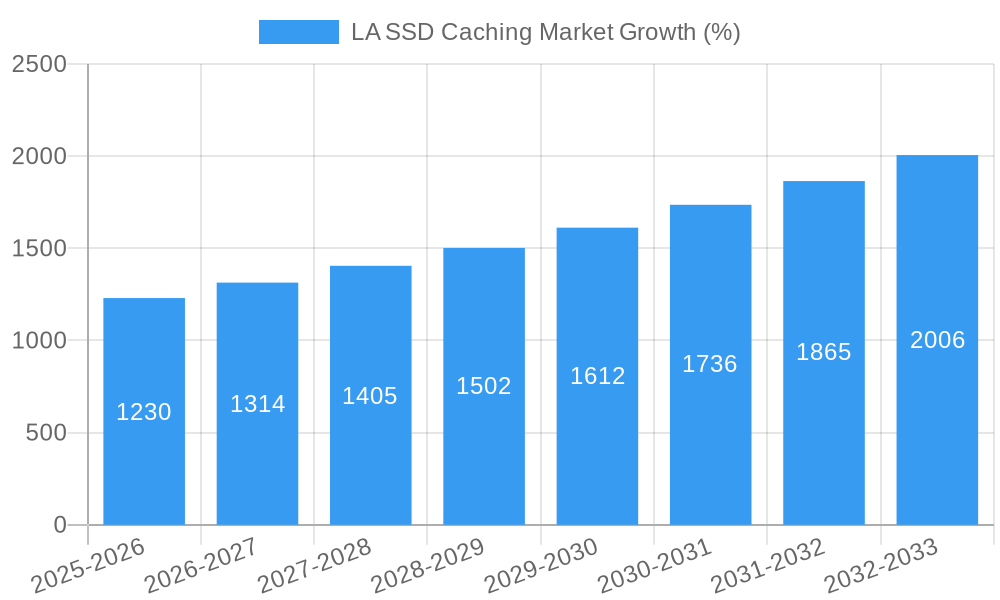
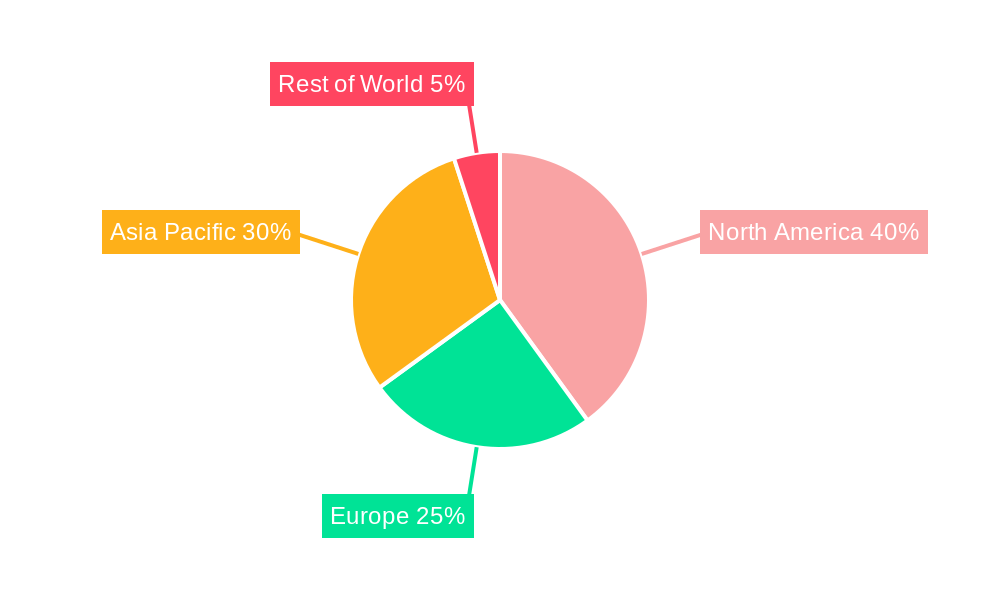
The Low-Latency (LA) SSD Caching market is experiencing robust growth, driven by the increasing demand for high-performance computing and data storage solutions across enterprise and personal applications. The market's Compound Annual Growth Rate (CAGR) of 8.10% from 2019 to 2024 suggests a significant expansion, projected to continue through 2033. Key drivers include the proliferation of big data analytics, cloud computing adoption, and the rising need for faster data access speeds in various sectors. The enterprise storage segment dominates the market due to the substantial investment in data center infrastructure upgrades and the need for improved application performance. However, the personal storage segment is also witnessing considerable growth fueled by the increasing use of high-resolution media and gaming applications requiring faster storage solutions. While the market faces certain restraints such as the relatively high cost of LA SSDs compared to traditional storage solutions and potential challenges in data management and security, ongoing technological advancements and decreasing costs are expected to mitigate these limitations. Geographic regions like North America and Asia-Pacific are currently leading the market, driven by strong technological adoption and infrastructure development. Leading players such as Seagate, Micron, Samsung, and Western Digital are investing heavily in R&D and strategic partnerships to maintain their market position and capitalize on emerging opportunities.
The forecast period (2025-2033) anticipates a continued expansion of the LA SSD caching market, fueled by innovations like NVMe (Non-Volatile Memory Express) technology and the growing adoption of AI and machine learning applications that require ultra-fast data access. The competition within the market is intense, prompting companies to focus on product differentiation through improved performance, enhanced reliability, and innovative data management features. Furthermore, the increasing demand for edge computing and the Internet of Things (IoT) is expected to propel market growth as these technologies require low-latency storage solutions for efficient data processing and transmission. Growth in specific regions will depend on factors such as economic growth, technological advancements, and government policies supporting digital transformation. The market is poised for substantial expansion, presenting opportunities for both established players and new entrants.
LA SSD Caching Market Report: 2019-2033
This comprehensive report provides a detailed analysis of the Los Angeles (LA) SSD caching market, offering invaluable insights for industry professionals, investors, and strategic decision-makers. With a focus on market structure, dynamics, leading players, and future trends, this report covers the period from 2019 to 2033, with a base year of 2025 and a forecast period spanning 2025-2033. The report leverages extensive data analysis to provide actionable intelligence for navigating the complexities of this rapidly evolving market. The total market size is projected to reach xx Million by 2033.
LA SSD Caching Market Structure & Innovation Trends
The LA SSD caching market exhibits a moderately concentrated structure, with key players such as Seagate Technology LLC, Micron Technology Inc, Samsung Electronics Co Ltd, Western Digital Corporation, and Intel Corporation holding significant market share. Precise market share figures for each company in LA are unavailable and require further dedicated research, projected at xx% collectively in 2025. Innovation is driven by advancements in NAND flash technology (like the 144-layer QLC technology showcased in Intel's SSD 670p), NVMe interfaces, and increasing demands for higher performance and lower latency storage solutions. Regulatory frameworks, while generally supportive of technological advancements, may introduce compliance costs. Product substitutes include traditional HDDs and other caching technologies, but SSD caching maintains a competitive advantage in performance. End-user demographics are diversified, encompassing enterprises, individual consumers, and various industry verticals. Mergers and acquisitions (M&A) activity has been moderate, with deal values totaling an estimated xx Million in the last five years. However, future M&A activity is anticipated to increase as larger players consolidate market positions.
- Market Concentration: Moderately concentrated, with top players holding approximately xx% of market share in 2025.
- Innovation Drivers: Advancements in NAND flash technology, NVMe interfaces, demand for higher performance.
- Regulatory Framework: Generally supportive, with potential for future compliance-related costs.
- Product Substitutes: Traditional HDDs and alternative caching technologies.
- End-User Demographics: Diverse, encompassing enterprises, consumers, and various industries.
- M&A Activity: Moderate, with estimated deal values of xx Million over the last five years.
LA SSD Caching Market Dynamics & Trends
The LA SSD caching market is experiencing robust growth, driven primarily by the increasing adoption of cloud computing, big data analytics, and the rise of high-performance computing applications. Technological disruptions, such as the shift from SATA to NVMe interfaces and the ongoing development of 3D NAND flash technology, are reshaping the competitive landscape. Consumer preferences are trending towards higher storage capacity, faster speeds, and improved energy efficiency. The market exhibits strong competitive dynamics, with key players engaging in intense price competition and product innovation. The Compound Annual Growth Rate (CAGR) is projected at xx% from 2025 to 2033. Market penetration in the LA area is estimated to reach xx% by 2033. Factors influencing growth include increasing data generation, the growing demand for faster data processing, and the transition to enterprise-class SSD caching solutions.
Dominant Regions & Segments in LA SSD Caching Market
While precise regional breakdowns for LA are not currently available, it’s anticipated that the Enterprise Storage segment will dominate the LA SSD caching market due to higher demand from businesses for increased data storage and processing capabilities, specifically from sectors such as finance and media. The Personal Storage segment is expected to exhibit strong growth, driven by increasing consumer adoption of high-performance computing devices.
Enterprise Storage Segment Key Drivers:
- Increasing adoption of cloud computing and big data analytics within enterprises.
- Growing need for high-performance computing (HPC) solutions for data-intensive applications.
- The expansion of data centers in and around LA requiring improved storage efficiency.
Dominance Analysis: The Enterprise Storage segment is projected to account for xx% of the LA SSD caching market in 2025, owing to its larger average transaction sizes and higher demand for high-capacity, high-performance solutions. This segment is expected to continue to drive market growth throughout the forecast period. Further research is required to quantify the precise market share.
LA SSD Caching Market Product Innovations
Recent product innovations have focused on increasing storage density, improving performance through advanced controllers and interfaces (like NVMe), and enhancing reliability. The introduction of Intel's SSD 670p in March 2021, featuring 144-layer QLC technology, exemplifies these trends. This new generation of SSDs offers significant performance improvements compared to its predecessors and addresses the growing need for high-capacity, fast storage solutions for both enterprise and consumer applications. The market fit for these innovations is strong, as they directly address the needs of increasingly data-intensive applications.
Report Scope & Segmentation Analysis
This report segments the LA SSD caching market by application:
Enterprise Storage: This segment includes SSD caching solutions deployed in data centers, servers, and enterprise storage systems. Growth projections for this segment are driven by the ongoing adoption of cloud computing and big data analytics, and the increasing need for high-performance storage solutions. Market size and competitive dynamics in this segment are closely tied to the overall performance and scalability demands of the enterprise sector.
Personal Storage: This segment encompasses SSD caching solutions used in personal computers, laptops, and gaming consoles. Growth in this segment is driven by the increasing demand for high-performance storage, particularly among gamers and content creators. Market size is expected to grow steadily throughout the forecast period, reflecting the increased affordability and accessibility of SSD technology.
Key Drivers of LA SSD Caching Market Growth
Several factors fuel the growth of the LA SSD caching market. The rise of cloud computing and big data analytics necessitate efficient storage and retrieval of vast amounts of data, driving demand for high-performance SSD caching solutions. Technological advancements, such as the development of NVMe technology and 3D NAND flash, are enhancing speed and storage density. Furthermore, favorable economic conditions and government initiatives promoting digital infrastructure development in the LA region provide a supportive backdrop for market expansion.
Challenges in the LA SSD Caching Market Sector
The LA SSD caching market faces challenges such as supply chain disruptions that can affect the availability and cost of components. Price competition amongst manufacturers can pressure profit margins. Additionally, the emergence of alternative storage technologies could pose a threat to the market's growth. The potential impact of these challenges on market growth is estimated at approximately xx% annually.
Emerging Opportunities in LA SSD Caching Market
Emerging opportunities include the increasing demand for edge computing, which necessitates efficient storage solutions at the network edge. The growth of artificial intelligence (AI) and machine learning (ML) applications requires substantial storage capacity and speed, presenting another significant opportunity. Finally, the continued development of innovative SSD technologies, such as next-generation NAND flash and new controller architectures, promises further expansion for this sector.
Leading Players in the LA SSD Caching Market Market
- Seagate Technology LLC
- Micron Technology Inc
- Samsung Electronics Co Ltd
- Inspur Group
- Transcend Information Inc
- Kioxia (Toshiba Memory Corporation)
- ADATA Technology Co Ltd
- Western Digital Corporation
- SK Hynix Inc
- NetApp Inc
- Intel Corporation
- QNAP Systems Inc
Key Developments in LA SSD Caching Market Industry
August 2020: Intel launched SSD D7-P550/5600 series, enhancing IT efficiency and data security with optimized performance and capacity for all-TLC arrays. This launch significantly impacted the enterprise storage segment.
March 2021: Intel released the SSD 670p, a 144-layer quad-level cell-based SSD with up to 2TB capacity. This product launch boosted performance and endurance, significantly impacting the consumer and gaming markets.
Future Outlook for LA SSD Caching Market Market
The future of the LA SSD caching market looks promising, driven by the continued expansion of cloud computing, big data, and AI/ML applications. Technological advancements in storage density, speed, and reliability will further fuel market growth. Strategic opportunities exist for companies to focus on developing innovative solutions tailored to specific market segments, such as edge computing and high-performance computing. The overall market is poised for sustained growth over the forecast period, with significant opportunities for both established players and new entrants.
LA SSD Caching Market Segmentation
-
1. Application
- 1.1. Enterprise Storage
- 1.2. Personal Storage
LA SSD Caching Market Segmentation By Geography
-
1. North America
- 1.1. United States
- 1.2. Canada
- 1.3. Mexico
-
2. South America
- 2.1. Brazil
- 2.2. Argentina
- 2.3. Rest of South America
-
3. Europe
- 3.1. United Kingdom
- 3.2. Germany
- 3.3. France
- 3.4. Italy
- 3.5. Spain
- 3.6. Russia
- 3.7. Benelux
- 3.8. Nordics
- 3.9. Rest of Europe
-
4. Middle East & Africa
- 4.1. Turkey
- 4.2. Israel
- 4.3. GCC
- 4.4. North Africa
- 4.5. South Africa
- 4.6. Rest of Middle East & Africa
-
5. Asia Pacific
- 5.1. China
- 5.2. India
- 5.3. Japan
- 5.4. South Korea
- 5.5. ASEAN
- 5.6. Oceania
- 5.7. Rest of Asia Pacific
LA SSD Caching Market REPORT HIGHLIGHTS
| Aspects | Details |
|---|---|
| Study Period | 2019-2033 |
| Base Year | 2024 |
| Estimated Year | 2025 |
| Forecast Period | 2025-2033 |
| Historical Period | 2019-2024 |
| Growth Rate | CAGR of 8.10% from 2019-2033 |
| Segmentation |
|
Table of Contents
- 1. Introduction
- 1.1. Research Scope
- 1.2. Market Segmentation
- 1.3. Research Methodology
- 1.4. Definitions and Assumptions
- 2. Executive Summary
- 2.1. Introduction
- 3. Market Dynamics
- 3.1. Introduction
- 3.2. Market Drivers
- 3.2.1. Improvements Offered by SSDs Over Conventional HDDs
- 3.3. Market Restrains
- 3.3.1. Slow Pace in Development of Applications Despite Heavy investments in R&D; Commplexities in Hardware Designing
- 3.4. Market Trends
- 3.4.1. Enterprise Storage Expected to Hold Major Share
- 4. Market Factor Analysis
- 4.1. Porters Five Forces
- 4.2. Supply/Value Chain
- 4.3. PESTEL analysis
- 4.4. Market Entropy
- 4.5. Patent/Trademark Analysis
- 5. Global LA SSD Caching Market Analysis, Insights and Forecast, 2019-2031
- 5.1. Market Analysis, Insights and Forecast - by Application
- 5.1.1. Enterprise Storage
- 5.1.2. Personal Storage
- 5.2. Market Analysis, Insights and Forecast - by Region
- 5.2.1. North America
- 5.2.2. South America
- 5.2.3. Europe
- 5.2.4. Middle East & Africa
- 5.2.5. Asia Pacific
- 5.1. Market Analysis, Insights and Forecast - by Application
- 6. North America LA SSD Caching Market Analysis, Insights and Forecast, 2019-2031
- 6.1. Market Analysis, Insights and Forecast - by Application
- 6.1.1. Enterprise Storage
- 6.1.2. Personal Storage
- 6.1. Market Analysis, Insights and Forecast - by Application
- 7. South America LA SSD Caching Market Analysis, Insights and Forecast, 2019-2031
- 7.1. Market Analysis, Insights and Forecast - by Application
- 7.1.1. Enterprise Storage
- 7.1.2. Personal Storage
- 7.1. Market Analysis, Insights and Forecast - by Application
- 8. Europe LA SSD Caching Market Analysis, Insights and Forecast, 2019-2031
- 8.1. Market Analysis, Insights and Forecast - by Application
- 8.1.1. Enterprise Storage
- 8.1.2. Personal Storage
- 8.1. Market Analysis, Insights and Forecast - by Application
- 9. Middle East & Africa LA SSD Caching Market Analysis, Insights and Forecast, 2019-2031
- 9.1. Market Analysis, Insights and Forecast - by Application
- 9.1.1. Enterprise Storage
- 9.1.2. Personal Storage
- 9.1. Market Analysis, Insights and Forecast - by Application
- 10. Asia Pacific LA SSD Caching Market Analysis, Insights and Forecast, 2019-2031
- 10.1. Market Analysis, Insights and Forecast - by Application
- 10.1.1. Enterprise Storage
- 10.1.2. Personal Storage
- 10.1. Market Analysis, Insights and Forecast - by Application
- 11. North America LA SSD Caching Market Analysis, Insights and Forecast, 2019-2031
- 11.1. Market Analysis, Insights and Forecast - By Country/Sub-region
- 11.1.1 United States
- 11.1.2 Canada
- 12. Europe LA SSD Caching Market Analysis, Insights and Forecast, 2019-2031
- 12.1. Market Analysis, Insights and Forecast - By Country/Sub-region
- 12.1.1 Germany
- 12.1.2 United Kingdom
- 12.1.3 France
- 12.1.4 Rest of Europe
- 13. Asia Pacific LA SSD Caching Market Analysis, Insights and Forecast, 2019-2031
- 13.1. Market Analysis, Insights and Forecast - By Country/Sub-region
- 13.1.1 China
- 13.1.2 Taiwan
- 13.1.3 South Korea
- 13.1.4 Rest of Asia Pacific
- 14. Rest of the World LA SSD Caching Market Analysis, Insights and Forecast, 2019-2031
- 14.1. Market Analysis, Insights and Forecast - By Country/Sub-region
- 14.1.1.
- 15. Competitive Analysis
- 15.1. Global Market Share Analysis 2024
- 15.2. Company Profiles
- 15.2.1 Seagate Technology LLC
- 15.2.1.1. Overview
- 15.2.1.2. Products
- 15.2.1.3. SWOT Analysis
- 15.2.1.4. Recent Developments
- 15.2.1.5. Financials (Based on Availability)
- 15.2.2 Microsemi (Microchip Technology Inc
- 15.2.2.1. Overview
- 15.2.2.2. Products
- 15.2.2.3. SWOT Analysis
- 15.2.2.4. Recent Developments
- 15.2.2.5. Financials (Based on Availability)
- 15.2.3 Micron Technology Inc
- 15.2.3.1. Overview
- 15.2.3.2. Products
- 15.2.3.3. SWOT Analysis
- 15.2.3.4. Recent Developments
- 15.2.3.5. Financials (Based on Availability)
- 15.2.4 Inspur Group
- 15.2.4.1. Overview
- 15.2.4.2. Products
- 15.2.4.3. SWOT Analysis
- 15.2.4.4. Recent Developments
- 15.2.4.5. Financials (Based on Availability)
- 15.2.5 Samsung Electronics Co Ltd
- 15.2.5.1. Overview
- 15.2.5.2. Products
- 15.2.5.3. SWOT Analysis
- 15.2.5.4. Recent Developments
- 15.2.5.5. Financials (Based on Availability)
- 15.2.6 Transcend Information Inc
- 15.2.6.1. Overview
- 15.2.6.2. Products
- 15.2.6.3. SWOT Analysis
- 15.2.6.4. Recent Developments
- 15.2.6.5. Financials (Based on Availability)
- 15.2.7 Kioxia (Toshiba Memory Corporation)
- 15.2.7.1. Overview
- 15.2.7.2. Products
- 15.2.7.3. SWOT Analysis
- 15.2.7.4. Recent Developments
- 15.2.7.5. Financials (Based on Availability)
- 15.2.8 ADATA Technology Co Ltd
- 15.2.8.1. Overview
- 15.2.8.2. Products
- 15.2.8.3. SWOT Analysis
- 15.2.8.4. Recent Developments
- 15.2.8.5. Financials (Based on Availability)
- 15.2.9 Western Digital Corporation
- 15.2.9.1. Overview
- 15.2.9.2. Products
- 15.2.9.3. SWOT Analysis
- 15.2.9.4. Recent Developments
- 15.2.9.5. Financials (Based on Availability)
- 15.2.10 SK Hynix Inc
- 15.2.10.1. Overview
- 15.2.10.2. Products
- 15.2.10.3. SWOT Analysis
- 15.2.10.4. Recent Developments
- 15.2.10.5. Financials (Based on Availability)
- 15.2.11 NetApp Inc
- 15.2.11.1. Overview
- 15.2.11.2. Products
- 15.2.11.3. SWOT Analysis
- 15.2.11.4. Recent Developments
- 15.2.11.5. Financials (Based on Availability)
- 15.2.12 Intel Corporation
- 15.2.12.1. Overview
- 15.2.12.2. Products
- 15.2.12.3. SWOT Analysis
- 15.2.12.4. Recent Developments
- 15.2.12.5. Financials (Based on Availability)
- 15.2.13 QNAP Systems Inc
- 15.2.13.1. Overview
- 15.2.13.2. Products
- 15.2.13.3. SWOT Analysis
- 15.2.13.4. Recent Developments
- 15.2.13.5. Financials (Based on Availability)
- 15.2.1 Seagate Technology LLC
List of Figures
- Figure 1: Global LA SSD Caching Market Revenue Breakdown (Million, %) by Region 2024 & 2032
- Figure 2: North America LA SSD Caching Market Revenue (Million), by Country 2024 & 2032
- Figure 3: North America LA SSD Caching Market Revenue Share (%), by Country 2024 & 2032
- Figure 4: Europe LA SSD Caching Market Revenue (Million), by Country 2024 & 2032
- Figure 5: Europe LA SSD Caching Market Revenue Share (%), by Country 2024 & 2032
- Figure 6: Asia Pacific LA SSD Caching Market Revenue (Million), by Country 2024 & 2032
- Figure 7: Asia Pacific LA SSD Caching Market Revenue Share (%), by Country 2024 & 2032
- Figure 8: Rest of the World LA SSD Caching Market Revenue (Million), by Country 2024 & 2032
- Figure 9: Rest of the World LA SSD Caching Market Revenue Share (%), by Country 2024 & 2032
- Figure 10: North America LA SSD Caching Market Revenue (Million), by Application 2024 & 2032
- Figure 11: North America LA SSD Caching Market Revenue Share (%), by Application 2024 & 2032
- Figure 12: North America LA SSD Caching Market Revenue (Million), by Country 2024 & 2032
- Figure 13: North America LA SSD Caching Market Revenue Share (%), by Country 2024 & 2032
- Figure 14: South America LA SSD Caching Market Revenue (Million), by Application 2024 & 2032
- Figure 15: South America LA SSD Caching Market Revenue Share (%), by Application 2024 & 2032
- Figure 16: South America LA SSD Caching Market Revenue (Million), by Country 2024 & 2032
- Figure 17: South America LA SSD Caching Market Revenue Share (%), by Country 2024 & 2032
- Figure 18: Europe LA SSD Caching Market Revenue (Million), by Application 2024 & 2032
- Figure 19: Europe LA SSD Caching Market Revenue Share (%), by Application 2024 & 2032
- Figure 20: Europe LA SSD Caching Market Revenue (Million), by Country 2024 & 2032
- Figure 21: Europe LA SSD Caching Market Revenue Share (%), by Country 2024 & 2032
- Figure 22: Middle East & Africa LA SSD Caching Market Revenue (Million), by Application 2024 & 2032
- Figure 23: Middle East & Africa LA SSD Caching Market Revenue Share (%), by Application 2024 & 2032
- Figure 24: Middle East & Africa LA SSD Caching Market Revenue (Million), by Country 2024 & 2032
- Figure 25: Middle East & Africa LA SSD Caching Market Revenue Share (%), by Country 2024 & 2032
- Figure 26: Asia Pacific LA SSD Caching Market Revenue (Million), by Application 2024 & 2032
- Figure 27: Asia Pacific LA SSD Caching Market Revenue Share (%), by Application 2024 & 2032
- Figure 28: Asia Pacific LA SSD Caching Market Revenue (Million), by Country 2024 & 2032
- Figure 29: Asia Pacific LA SSD Caching Market Revenue Share (%), by Country 2024 & 2032
List of Tables
- Table 1: Global LA SSD Caching Market Revenue Million Forecast, by Region 2019 & 2032
- Table 2: Global LA SSD Caching Market Revenue Million Forecast, by Application 2019 & 2032
- Table 3: Global LA SSD Caching Market Revenue Million Forecast, by Region 2019 & 2032
- Table 4: Global LA SSD Caching Market Revenue Million Forecast, by Country 2019 & 2032
- Table 5: United States LA SSD Caching Market Revenue (Million) Forecast, by Application 2019 & 2032
- Table 6: Canada LA SSD Caching Market Revenue (Million) Forecast, by Application 2019 & 2032
- Table 7: Global LA SSD Caching Market Revenue Million Forecast, by Country 2019 & 2032
- Table 8: Germany LA SSD Caching Market Revenue (Million) Forecast, by Application 2019 & 2032
- Table 9: United Kingdom LA SSD Caching Market Revenue (Million) Forecast, by Application 2019 & 2032
- Table 10: France LA SSD Caching Market Revenue (Million) Forecast, by Application 2019 & 2032
- Table 11: Rest of Europe LA SSD Caching Market Revenue (Million) Forecast, by Application 2019 & 2032
- Table 12: Global LA SSD Caching Market Revenue Million Forecast, by Country 2019 & 2032
- Table 13: China LA SSD Caching Market Revenue (Million) Forecast, by Application 2019 & 2032
- Table 14: Taiwan LA SSD Caching Market Revenue (Million) Forecast, by Application 2019 & 2032
- Table 15: South Korea LA SSD Caching Market Revenue (Million) Forecast, by Application 2019 & 2032
- Table 16: Rest of Asia Pacific LA SSD Caching Market Revenue (Million) Forecast, by Application 2019 & 2032
- Table 17: Global LA SSD Caching Market Revenue Million Forecast, by Country 2019 & 2032
- Table 18: LA SSD Caching Market Revenue (Million) Forecast, by Application 2019 & 2032
- Table 19: Global LA SSD Caching Market Revenue Million Forecast, by Application 2019 & 2032
- Table 20: Global LA SSD Caching Market Revenue Million Forecast, by Country 2019 & 2032
- Table 21: United States LA SSD Caching Market Revenue (Million) Forecast, by Application 2019 & 2032
- Table 22: Canada LA SSD Caching Market Revenue (Million) Forecast, by Application 2019 & 2032
- Table 23: Mexico LA SSD Caching Market Revenue (Million) Forecast, by Application 2019 & 2032
- Table 24: Global LA SSD Caching Market Revenue Million Forecast, by Application 2019 & 2032
- Table 25: Global LA SSD Caching Market Revenue Million Forecast, by Country 2019 & 2032
- Table 26: Brazil LA SSD Caching Market Revenue (Million) Forecast, by Application 2019 & 2032
- Table 27: Argentina LA SSD Caching Market Revenue (Million) Forecast, by Application 2019 & 2032
- Table 28: Rest of South America LA SSD Caching Market Revenue (Million) Forecast, by Application 2019 & 2032
- Table 29: Global LA SSD Caching Market Revenue Million Forecast, by Application 2019 & 2032
- Table 30: Global LA SSD Caching Market Revenue Million Forecast, by Country 2019 & 2032
- Table 31: United Kingdom LA SSD Caching Market Revenue (Million) Forecast, by Application 2019 & 2032
- Table 32: Germany LA SSD Caching Market Revenue (Million) Forecast, by Application 2019 & 2032
- Table 33: France LA SSD Caching Market Revenue (Million) Forecast, by Application 2019 & 2032
- Table 34: Italy LA SSD Caching Market Revenue (Million) Forecast, by Application 2019 & 2032
- Table 35: Spain LA SSD Caching Market Revenue (Million) Forecast, by Application 2019 & 2032
- Table 36: Russia LA SSD Caching Market Revenue (Million) Forecast, by Application 2019 & 2032
- Table 37: Benelux LA SSD Caching Market Revenue (Million) Forecast, by Application 2019 & 2032
- Table 38: Nordics LA SSD Caching Market Revenue (Million) Forecast, by Application 2019 & 2032
- Table 39: Rest of Europe LA SSD Caching Market Revenue (Million) Forecast, by Application 2019 & 2032
- Table 40: Global LA SSD Caching Market Revenue Million Forecast, by Application 2019 & 2032
- Table 41: Global LA SSD Caching Market Revenue Million Forecast, by Country 2019 & 2032
- Table 42: Turkey LA SSD Caching Market Revenue (Million) Forecast, by Application 2019 & 2032
- Table 43: Israel LA SSD Caching Market Revenue (Million) Forecast, by Application 2019 & 2032
- Table 44: GCC LA SSD Caching Market Revenue (Million) Forecast, by Application 2019 & 2032
- Table 45: North Africa LA SSD Caching Market Revenue (Million) Forecast, by Application 2019 & 2032
- Table 46: South Africa LA SSD Caching Market Revenue (Million) Forecast, by Application 2019 & 2032
- Table 47: Rest of Middle East & Africa LA SSD Caching Market Revenue (Million) Forecast, by Application 2019 & 2032
- Table 48: Global LA SSD Caching Market Revenue Million Forecast, by Application 2019 & 2032
- Table 49: Global LA SSD Caching Market Revenue Million Forecast, by Country 2019 & 2032
- Table 50: China LA SSD Caching Market Revenue (Million) Forecast, by Application 2019 & 2032
- Table 51: India LA SSD Caching Market Revenue (Million) Forecast, by Application 2019 & 2032
- Table 52: Japan LA SSD Caching Market Revenue (Million) Forecast, by Application 2019 & 2032
- Table 53: South Korea LA SSD Caching Market Revenue (Million) Forecast, by Application 2019 & 2032
- Table 54: ASEAN LA SSD Caching Market Revenue (Million) Forecast, by Application 2019 & 2032
- Table 55: Oceania LA SSD Caching Market Revenue (Million) Forecast, by Application 2019 & 2032
- Table 56: Rest of Asia Pacific LA SSD Caching Market Revenue (Million) Forecast, by Application 2019 & 2032
Frequently Asked Questions
1. What is the projected Compound Annual Growth Rate (CAGR) of the LA SSD Caching Market?
The projected CAGR is approximately 8.10%.
2. Which companies are prominent players in the LA SSD Caching Market?
Key companies in the market include Seagate Technology LLC, Microsemi (Microchip Technology Inc, Micron Technology Inc, Inspur Group, Samsung Electronics Co Ltd, Transcend Information Inc, Kioxia (Toshiba Memory Corporation), ADATA Technology Co Ltd, Western Digital Corporation, SK Hynix Inc, NetApp Inc, Intel Corporation, QNAP Systems Inc.
3. What are the main segments of the LA SSD Caching Market?
The market segments include Application.
4. Can you provide details about the market size?
The market size is estimated to be USD XX Million as of 2022.
5. What are some drivers contributing to market growth?
Improvements Offered by SSDs Over Conventional HDDs.
6. What are the notable trends driving market growth?
Enterprise Storage Expected to Hold Major Share.
7. Are there any restraints impacting market growth?
Slow Pace in Development of Applications Despite Heavy investments in R&D; Commplexities in Hardware Designing.
8. Can you provide examples of recent developments in the market?
March 2021 - A Solid State Drive (SSD) 670p has been released by Intel. The client SSD is a 144-layer quad-level cell-based device. The SSD can hold up to two terabytes of data in a single drive. According to Intel, SSDs can be used to supplement everyday computing needs as well as to assist extreme gaming. When compared to the previous generation Intel QLC 3D NAND SSD, the new SSD 670p is said to give improved performance, including a 2-times sequential read and a 20% endurance boost. To meet normal processing demands, the Intel SSD 670p has been optimized for low queue depth and mixed workloads.
9. What pricing options are available for accessing the report?
Pricing options include single-user, multi-user, and enterprise licenses priced at USD 3800, USD 4500, and USD 5800 respectively.
10. Is the market size provided in terms of value or volume?
The market size is provided in terms of value, measured in Million.
11. Are there any specific market keywords associated with the report?
Yes, the market keyword associated with the report is "LA SSD Caching Market," which aids in identifying and referencing the specific market segment covered.
12. How do I determine which pricing option suits my needs best?
The pricing options vary based on user requirements and access needs. Individual users may opt for single-user licenses, while businesses requiring broader access may choose multi-user or enterprise licenses for cost-effective access to the report.
13. Are there any additional resources or data provided in the LA SSD Caching Market report?
While the report offers comprehensive insights, it's advisable to review the specific contents or supplementary materials provided to ascertain if additional resources or data are available.
14. How can I stay updated on further developments or reports in the LA SSD Caching Market?
To stay informed about further developments, trends, and reports in the LA SSD Caching Market, consider subscribing to industry newsletters, following relevant companies and organizations, or regularly checking reputable industry news sources and publications.
Methodology
Step 1 - Identification of Relevant Samples Size from Population Database


Step 2 - Approaches for Defining Global Market Size (Value, Volume* & Price*)

Note*: In applicable scenarios
Step 3 - Data Sources
Primary Research
- Web Analytics
- Survey Reports
- Research Institute
- Latest Research Reports
- Opinion Leaders
Secondary Research
- Annual Reports
- White Paper
- Latest Press Release
- Industry Association
- Paid Database
- Investor Presentations

Step 4 - Data Triangulation
Involves using different sources of information in order to increase the validity of a study
These sources are likely to be stakeholders in a program - participants, other researchers, program staff, other community members, and so on.
Then we put all data in single framework & apply various statistical tools to find out the dynamic on the market.
During the analysis stage, feedback from the stakeholder groups would be compared to determine areas of agreement as well as areas of divergence


