
Key Insights
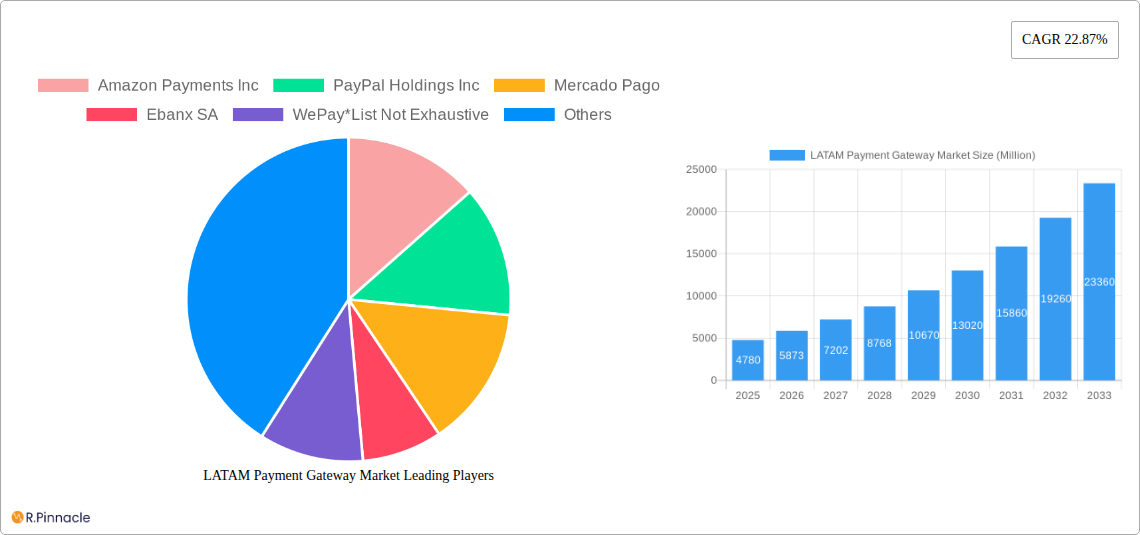
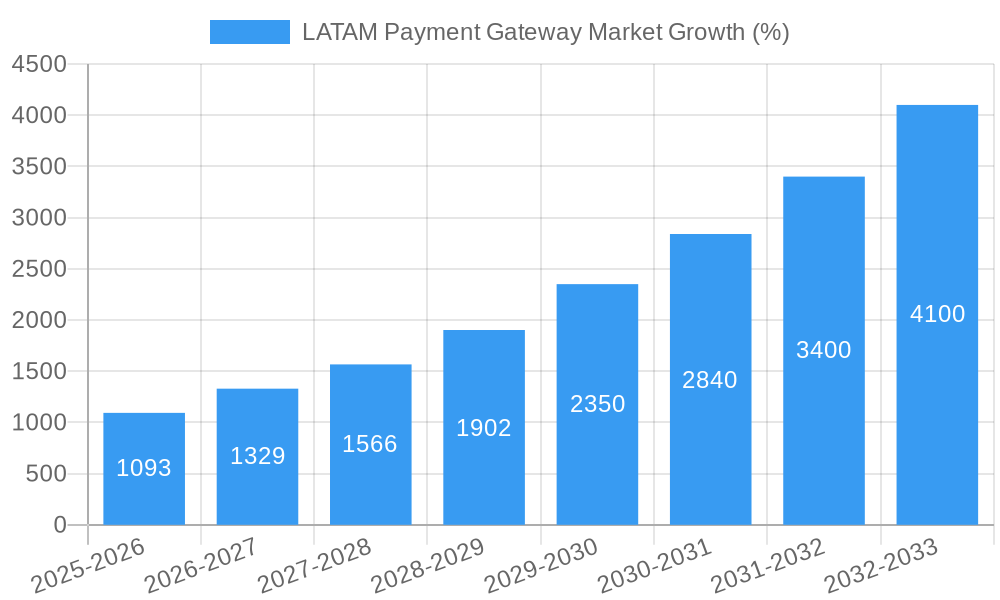
The LATAM Payment Gateway Market is experiencing robust growth, projected to reach $4.78 billion in 2025 and exhibiting a Compound Annual Growth Rate (CAGR) of 22.87% from 2025 to 2033. This expansion is fueled by several key factors. The rapid rise of e-commerce across Latin America, driven by increasing internet and smartphone penetration, is a primary driver. Consumers are increasingly adopting digital payment methods, shifting away from traditional cash-based transactions. Furthermore, the region is witnessing significant improvements in digital infrastructure, including faster internet speeds and enhanced mobile network coverage, further bolstering the adoption of online payment solutions. Government initiatives promoting financial inclusion and digital transformation are also contributing to market growth. The diverse range of payment preferences across different LATAM countries necessitates payment gateways that offer a variety of options, including local payment methods, credit/debit cards, and mobile wallets. Competition among established players like Amazon Payments, PayPal, Mercado Pago, and Ebanx, alongside emerging fintech companies, is driving innovation and fostering a dynamic market landscape.
The market's growth trajectory is expected to remain strong throughout the forecast period (2025-2033). However, challenges persist. High transaction fees, particularly for smaller businesses, can be a barrier to entry. Concerns surrounding data security and fraud remain crucial considerations for both consumers and businesses. The regulatory landscape in various LATAM countries also presents complexities, requiring payment gateways to navigate diverse compliance requirements. Despite these challenges, the long-term outlook for the LATAM payment gateway market remains positive, driven by continuous technological advancements, evolving consumer behavior, and increasing government support for digitalization. The market's segmentation likely includes variations based on payment type (e.g., credit/debit cards, mobile wallets, bank transfers), business size (SMEs vs. large enterprises), and country-specific variations in regulatory environments and consumer preferences. Understanding these nuances is crucial for success in this dynamic market.
LATAM Payment Gateway Market: A Comprehensive Report (2019-2033)
This in-depth report provides a comprehensive analysis of the LATAM Payment Gateway Market, offering invaluable insights for industry professionals, investors, and strategic decision-makers. With a study period spanning 2019-2033, a base year of 2025, and a forecast period of 2025-2033, this report leverages historical data (2019-2024) to project future market trends and opportunities. The market is estimated at xx Million in 2025 and is poised for significant growth. Discover actionable intelligence on market dynamics, key players, emerging technologies, and regulatory landscapes shaping this dynamic sector.
LATAM Payment Gateway Market Structure & Innovation Trends
This section analyzes the competitive landscape of the LATAM payment gateway market, encompassing market concentration, innovation drivers, regulatory frameworks, and M&A activities. We delve into the market share held by key players such as Amazon Payments Inc, PayPal Holdings Inc, Mercado Pago, Ebanx SA, and WePay, among others. The analysis includes:
- Market Concentration: A detailed breakdown of market share distribution among leading players, identifying dominant players and emerging competitors. We examine the Herfindahl-Hirschman Index (HHI) to quantify market concentration and assess potential competition levels. xx% of the market is controlled by the top 5 players in 2025.
- Innovation Drivers: Exploration of technological advancements (e.g., mobile payments, blockchain technology, AI-powered fraud detection) driving market innovation and shaping consumer preferences.
- Regulatory Frameworks: Analysis of the regulatory landscape across different LATAM countries, including compliance requirements, licensing procedures, and data privacy regulations. We highlight the impact of varying regulations on market entry barriers and competitive dynamics.
- Product Substitutes: Identification of alternative payment methods and their impact on the market share of traditional payment gateways. We will analyze the threat posed by these substitutes.
- End-User Demographics: Segmentation of the end-user base by demographics (age, location, income) to understand market penetration and growth potential in different user segments.
- M&A Activities: Review of recent mergers and acquisitions within the LATAM payment gateway market, including deal values and their implications for market consolidation and competitive landscapes. The total value of M&A deals in the historical period was xx Million.
LATAM Payment Gateway Market Dynamics & Trends
This section examines the key factors driving market growth, including technological disruptions, consumer behavior shifts, and competitive dynamics. The report will project a Compound Annual Growth Rate (CAGR) of xx% for the forecast period (2025-2033). Key market dynamics include:
- Market growth drivers (e.g., increasing e-commerce adoption, rising smartphone penetration, expansion of digital financial services).
- Technological disruptions (e.g., the rise of mobile wallets, the increasing use of buy now pay later schemes, implementation of open banking) and their impact on market structure and competition.
- Consumer preferences (e.g., demand for secure and convenient payment methods, preference for specific payment options) and their influence on market demand.
- Competitive dynamics (e.g., pricing strategies, product differentiation, marketing initiatives) among leading players.
- Market penetration rates in different LATAM countries and segments.
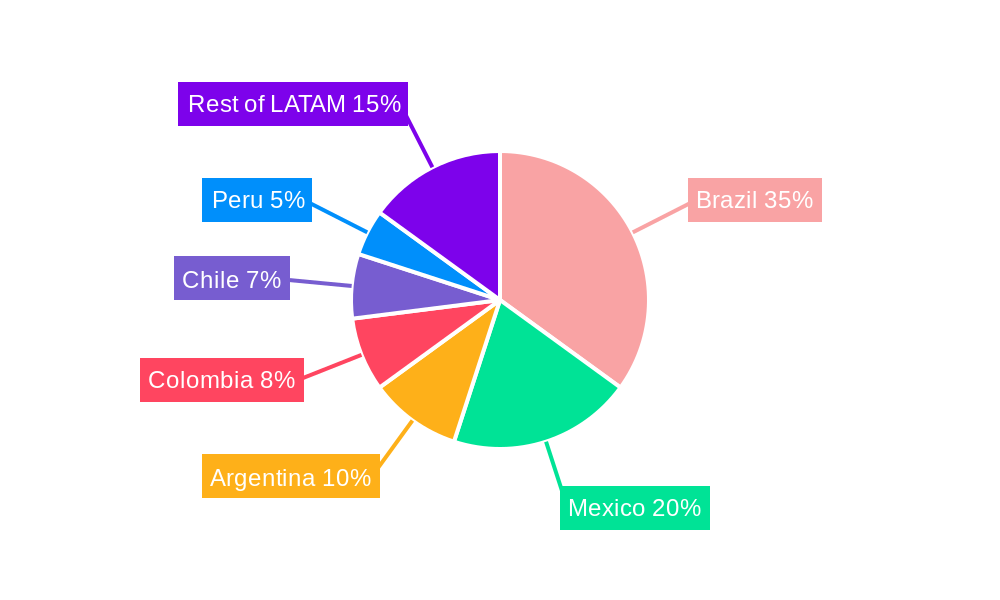
Dominant Regions & Segments in LATAM Payment Gateway Market
This section identifies the leading regions and segments within the LATAM Payment Gateway Market. A detailed analysis of Brazil, Mexico, and other key countries will be provided.
Brazil:
- Key Drivers: Strong e-commerce growth, expanding digital financial inclusion, supportive government policies.
- Dominance Analysis: Brazil's large population and robust digital economy make it a key market driver.
Mexico:
- Key Drivers: High smartphone penetration, growing adoption of online payments, burgeoning fintech sector.
- Dominance Analysis: Mexico exhibits significant growth potential due to its large, young population and increasing digital literacy.
Other Key Regions/Segments: Analysis will also include detailed explorations of other significant markets and segments within LATAM.
LATAM Payment Gateway Market Product Innovations
This section summarizes recent product developments and technological trends in the LATAM payment gateway market. Key areas of innovation include advancements in mobile payment technologies, the integration of AI for fraud prevention, and the adoption of biometric authentication methods. These innovations are enhancing the security, convenience, and efficiency of online transactions, leading to increased market adoption and competitive advantages for companies that proactively implement them.
Report Scope & Segmentation Analysis
This report segments the LATAM Payment Gateway Market based on several factors, including payment type (credit/debit cards, mobile wallets, bank transfers), transaction type (e-commerce, in-app purchases, peer-to-peer transfers), and business size (small, medium, large enterprises). Each segment's growth projections, market size, and competitive dynamics will be analyzed.
Key Drivers of LATAM Payment Gateway Market Growth
The growth of the LATAM payment gateway market is driven by several factors. The expansion of e-commerce, fueled by increasing internet and smartphone penetration, is a primary driver. Furthermore, the rise of fintech companies and innovative payment solutions, coupled with supportive government initiatives aimed at fostering digital financial inclusion, are significantly contributing to market expansion. The increasing preference for digital payment methods among consumers and businesses further accelerates market growth.
Challenges in the LATAM Payment Gateway Market Sector
The LATAM payment gateway market faces several challenges, including regulatory complexities across different countries, security concerns associated with online transactions, and infrastructure limitations in some regions. Furthermore, the high cost of acquiring and retaining merchants can hinder market expansion. Competition from established players and new entrants adds to the complexity of the market dynamics. These factors can collectively decrease overall market growth by an estimated xx% in the forecast period.
Emerging Opportunities in LATAM Payment Gateway Market
Despite the challenges, significant opportunities exist in the LATAM payment gateway market. The expanding adoption of mobile wallets, the growing interest in Buy Now Pay Later (BNPL) services, and the increasing use of open banking APIs present significant potential for growth. Targeting underserved populations through innovative financial solutions can further expand market reach. Furthermore, the increasing regulatory focus on promoting financial inclusion presents opportunities for businesses to cater to a broader customer base.
Leading Players in the LATAM Payment Gateway Market Market
- Amazon Payments Inc
- PayPal Holdings Inc
- Mercado Pago
- Ebanx SA
- WePay
- List Not Exhaustive
Key Developments in LATAM Payment Gateway Market Industry
- September 2024: Brazil's central bank unveiled 13 'development themes' for its central bank digital currency (CBDC), 'Drex,' signaling potential disruption and collaboration opportunities within the payments sector.
- July 2024: OCN, a Mexican fintech startup, secured USD 86 Million in Series A funding, indicating strong investor confidence in the LATAM fintech sector and its potential to expand financial services to gig workers.
Future Outlook for LATAM Payment Gateway Market Market
The LATAM Payment Gateway Market is poised for continued growth, driven by increasing digital adoption, technological innovation, and supportive government policies. Strategic partnerships, expansion into new markets, and the development of innovative payment solutions will be crucial for success. The market is expected to reach xx Million by 2033, offering significant opportunities for established players and new entrants alike.
LATAM Payment Gateway Market Segmentation
-
1. Type
- 1.1. Hosted
- 1.2. Non-Hosted
-
2. Enterprise
- 2.1. Small and Medium Enterprise (SME)
- 2.2. Large Enterprise
-
3. End-User
- 3.1. Travel
- 3.2. Retail
- 3.3. BFSI
- 3.4. Media and Entertainment
- 3.5. Other End-users
-
4. Geography
- 4.1. Brazil
- 4.2. Argentina
- 4.3. Mexico
- 4.4. Rest of Latin America
LATAM Payment Gateway Market Segmentation By Geography
- 1. Brazil
- 2. Argentina
- 3. Mexico
- 4. Rest of Latin America
LATAM Payment Gateway Market REPORT HIGHLIGHTS
| Aspects | Details |
|---|---|
| Study Period | 2019-2033 |
| Base Year | 2024 |
| Estimated Year | 2025 |
| Forecast Period | 2025-2033 |
| Historical Period | 2019-2024 |
| Growth Rate | CAGR of 22.87% from 2019-2033 |
| Segmentation |
|
Table of Contents
- 1. Introduction
- 1.1. Research Scope
- 1.2. Market Segmentation
- 1.3. Research Methodology
- 1.4. Definitions and Assumptions
- 2. Executive Summary
- 2.1. Introduction
- 3. Market Dynamics
- 3.1. Introduction
- 3.2. Market Drivers
- 3.2.1. Increased E-commerce Sales and High Internet Penetration Rate; Increased Demand for Mobile-based Payments; Growing Adoption of Payment Gateways in Retail
- 3.3. Market Restrains
- 3.3.1. Increased E-commerce Sales and High Internet Penetration Rate; Increased Demand for Mobile-based Payments; Growing Adoption of Payment Gateways in Retail
- 3.4. Market Trends
- 3.4.1. Increased E-commerce Sales and High Internet Penetration Rate
- 4. Market Factor Analysis
- 4.1. Porters Five Forces
- 4.2. Supply/Value Chain
- 4.3. PESTEL analysis
- 4.4. Market Entropy
- 4.5. Patent/Trademark Analysis
- 5. Global LATAM Payment Gateway Market Analysis, Insights and Forecast, 2019-2031
- 5.1. Market Analysis, Insights and Forecast - by Type
- 5.1.1. Hosted
- 5.1.2. Non-Hosted
- 5.2. Market Analysis, Insights and Forecast - by Enterprise
- 5.2.1. Small and Medium Enterprise (SME)
- 5.2.2. Large Enterprise
- 5.3. Market Analysis, Insights and Forecast - by End-User
- 5.3.1. Travel
- 5.3.2. Retail
- 5.3.3. BFSI
- 5.3.4. Media and Entertainment
- 5.3.5. Other End-users
- 5.4. Market Analysis, Insights and Forecast - by Geography
- 5.4.1. Brazil
- 5.4.2. Argentina
- 5.4.3. Mexico
- 5.4.4. Rest of Latin America
- 5.5. Market Analysis, Insights and Forecast - by Region
- 5.5.1. Brazil
- 5.5.2. Argentina
- 5.5.3. Mexico
- 5.5.4. Rest of Latin America
- 5.1. Market Analysis, Insights and Forecast - by Type
- 6. Brazil LATAM Payment Gateway Market Analysis, Insights and Forecast, 2019-2031
- 6.1. Market Analysis, Insights and Forecast - by Type
- 6.1.1. Hosted
- 6.1.2. Non-Hosted
- 6.2. Market Analysis, Insights and Forecast - by Enterprise
- 6.2.1. Small and Medium Enterprise (SME)
- 6.2.2. Large Enterprise
- 6.3. Market Analysis, Insights and Forecast - by End-User
- 6.3.1. Travel
- 6.3.2. Retail
- 6.3.3. BFSI
- 6.3.4. Media and Entertainment
- 6.3.5. Other End-users
- 6.4. Market Analysis, Insights and Forecast - by Geography
- 6.4.1. Brazil
- 6.4.2. Argentina
- 6.4.3. Mexico
- 6.4.4. Rest of Latin America
- 6.1. Market Analysis, Insights and Forecast - by Type
- 7. Argentina LATAM Payment Gateway Market Analysis, Insights and Forecast, 2019-2031
- 7.1. Market Analysis, Insights and Forecast - by Type
- 7.1.1. Hosted
- 7.1.2. Non-Hosted
- 7.2. Market Analysis, Insights and Forecast - by Enterprise
- 7.2.1. Small and Medium Enterprise (SME)
- 7.2.2. Large Enterprise
- 7.3. Market Analysis, Insights and Forecast - by End-User
- 7.3.1. Travel
- 7.3.2. Retail
- 7.3.3. BFSI
- 7.3.4. Media and Entertainment
- 7.3.5. Other End-users
- 7.4. Market Analysis, Insights and Forecast - by Geography
- 7.4.1. Brazil
- 7.4.2. Argentina
- 7.4.3. Mexico
- 7.4.4. Rest of Latin America
- 7.1. Market Analysis, Insights and Forecast - by Type
- 8. Mexico LATAM Payment Gateway Market Analysis, Insights and Forecast, 2019-2031
- 8.1. Market Analysis, Insights and Forecast - by Type
- 8.1.1. Hosted
- 8.1.2. Non-Hosted
- 8.2. Market Analysis, Insights and Forecast - by Enterprise
- 8.2.1. Small and Medium Enterprise (SME)
- 8.2.2. Large Enterprise
- 8.3. Market Analysis, Insights and Forecast - by End-User
- 8.3.1. Travel
- 8.3.2. Retail
- 8.3.3. BFSI
- 8.3.4. Media and Entertainment
- 8.3.5. Other End-users
- 8.4. Market Analysis, Insights and Forecast - by Geography
- 8.4.1. Brazil
- 8.4.2. Argentina
- 8.4.3. Mexico
- 8.4.4. Rest of Latin America
- 8.1. Market Analysis, Insights and Forecast - by Type
- 9. Rest of Latin America LATAM Payment Gateway Market Analysis, Insights and Forecast, 2019-2031
- 9.1. Market Analysis, Insights and Forecast - by Type
- 9.1.1. Hosted
- 9.1.2. Non-Hosted
- 9.2. Market Analysis, Insights and Forecast - by Enterprise
- 9.2.1. Small and Medium Enterprise (SME)
- 9.2.2. Large Enterprise
- 9.3. Market Analysis, Insights and Forecast - by End-User
- 9.3.1. Travel
- 9.3.2. Retail
- 9.3.3. BFSI
- 9.3.4. Media and Entertainment
- 9.3.5. Other End-users
- 9.4. Market Analysis, Insights and Forecast - by Geography
- 9.4.1. Brazil
- 9.4.2. Argentina
- 9.4.3. Mexico
- 9.4.4. Rest of Latin America
- 9.1. Market Analysis, Insights and Forecast - by Type
- 10. Competitive Analysis
- 10.1. Global Market Share Analysis 2024
- 10.2. Company Profiles
- 10.2.1 Amazon Payments Inc
- 10.2.1.1. Overview
- 10.2.1.2. Products
- 10.2.1.3. SWOT Analysis
- 10.2.1.4. Recent Developments
- 10.2.1.5. Financials (Based on Availability)
- 10.2.2 PayPal Holdings Inc
- 10.2.2.1. Overview
- 10.2.2.2. Products
- 10.2.2.3. SWOT Analysis
- 10.2.2.4. Recent Developments
- 10.2.2.5. Financials (Based on Availability)
- 10.2.3 Mercado Pago
- 10.2.3.1. Overview
- 10.2.3.2. Products
- 10.2.3.3. SWOT Analysis
- 10.2.3.4. Recent Developments
- 10.2.3.5. Financials (Based on Availability)
- 10.2.4 Ebanx SA
- 10.2.4.1. Overview
- 10.2.4.2. Products
- 10.2.4.3. SWOT Analysis
- 10.2.4.4. Recent Developments
- 10.2.4.5. Financials (Based on Availability)
- 10.2.5 WePay*List Not Exhaustive
- 10.2.5.1. Overview
- 10.2.5.2. Products
- 10.2.5.3. SWOT Analysis
- 10.2.5.4. Recent Developments
- 10.2.5.5. Financials (Based on Availability)
- 10.2.1 Amazon Payments Inc
List of Figures
- Figure 1: Global LATAM Payment Gateway Market Revenue Breakdown (Million, %) by Region 2024 & 2032
- Figure 2: Global LATAM Payment Gateway Market Volume Breakdown (Billion, %) by Region 2024 & 2032
- Figure 3: Brazil LATAM Payment Gateway Market Revenue (Million), by Type 2024 & 2032
- Figure 4: Brazil LATAM Payment Gateway Market Volume (Billion), by Type 2024 & 2032
- Figure 5: Brazil LATAM Payment Gateway Market Revenue Share (%), by Type 2024 & 2032
- Figure 6: Brazil LATAM Payment Gateway Market Volume Share (%), by Type 2024 & 2032
- Figure 7: Brazil LATAM Payment Gateway Market Revenue (Million), by Enterprise 2024 & 2032
- Figure 8: Brazil LATAM Payment Gateway Market Volume (Billion), by Enterprise 2024 & 2032
- Figure 9: Brazil LATAM Payment Gateway Market Revenue Share (%), by Enterprise 2024 & 2032
- Figure 10: Brazil LATAM Payment Gateway Market Volume Share (%), by Enterprise 2024 & 2032
- Figure 11: Brazil LATAM Payment Gateway Market Revenue (Million), by End-User 2024 & 2032
- Figure 12: Brazil LATAM Payment Gateway Market Volume (Billion), by End-User 2024 & 2032
- Figure 13: Brazil LATAM Payment Gateway Market Revenue Share (%), by End-User 2024 & 2032
- Figure 14: Brazil LATAM Payment Gateway Market Volume Share (%), by End-User 2024 & 2032
- Figure 15: Brazil LATAM Payment Gateway Market Revenue (Million), by Geography 2024 & 2032
- Figure 16: Brazil LATAM Payment Gateway Market Volume (Billion), by Geography 2024 & 2032
- Figure 17: Brazil LATAM Payment Gateway Market Revenue Share (%), by Geography 2024 & 2032
- Figure 18: Brazil LATAM Payment Gateway Market Volume Share (%), by Geography 2024 & 2032
- Figure 19: Brazil LATAM Payment Gateway Market Revenue (Million), by Country 2024 & 2032
- Figure 20: Brazil LATAM Payment Gateway Market Volume (Billion), by Country 2024 & 2032
- Figure 21: Brazil LATAM Payment Gateway Market Revenue Share (%), by Country 2024 & 2032
- Figure 22: Brazil LATAM Payment Gateway Market Volume Share (%), by Country 2024 & 2032
- Figure 23: Argentina LATAM Payment Gateway Market Revenue (Million), by Type 2024 & 2032
- Figure 24: Argentina LATAM Payment Gateway Market Volume (Billion), by Type 2024 & 2032
- Figure 25: Argentina LATAM Payment Gateway Market Revenue Share (%), by Type 2024 & 2032
- Figure 26: Argentina LATAM Payment Gateway Market Volume Share (%), by Type 2024 & 2032
- Figure 27: Argentina LATAM Payment Gateway Market Revenue (Million), by Enterprise 2024 & 2032
- Figure 28: Argentina LATAM Payment Gateway Market Volume (Billion), by Enterprise 2024 & 2032
- Figure 29: Argentina LATAM Payment Gateway Market Revenue Share (%), by Enterprise 2024 & 2032
- Figure 30: Argentina LATAM Payment Gateway Market Volume Share (%), by Enterprise 2024 & 2032
- Figure 31: Argentina LATAM Payment Gateway Market Revenue (Million), by End-User 2024 & 2032
- Figure 32: Argentina LATAM Payment Gateway Market Volume (Billion), by End-User 2024 & 2032
- Figure 33: Argentina LATAM Payment Gateway Market Revenue Share (%), by End-User 2024 & 2032
- Figure 34: Argentina LATAM Payment Gateway Market Volume Share (%), by End-User 2024 & 2032
- Figure 35: Argentina LATAM Payment Gateway Market Revenue (Million), by Geography 2024 & 2032
- Figure 36: Argentina LATAM Payment Gateway Market Volume (Billion), by Geography 2024 & 2032
- Figure 37: Argentina LATAM Payment Gateway Market Revenue Share (%), by Geography 2024 & 2032
- Figure 38: Argentina LATAM Payment Gateway Market Volume Share (%), by Geography 2024 & 2032
- Figure 39: Argentina LATAM Payment Gateway Market Revenue (Million), by Country 2024 & 2032
- Figure 40: Argentina LATAM Payment Gateway Market Volume (Billion), by Country 2024 & 2032
- Figure 41: Argentina LATAM Payment Gateway Market Revenue Share (%), by Country 2024 & 2032
- Figure 42: Argentina LATAM Payment Gateway Market Volume Share (%), by Country 2024 & 2032
- Figure 43: Mexico LATAM Payment Gateway Market Revenue (Million), by Type 2024 & 2032
- Figure 44: Mexico LATAM Payment Gateway Market Volume (Billion), by Type 2024 & 2032
- Figure 45: Mexico LATAM Payment Gateway Market Revenue Share (%), by Type 2024 & 2032
- Figure 46: Mexico LATAM Payment Gateway Market Volume Share (%), by Type 2024 & 2032
- Figure 47: Mexico LATAM Payment Gateway Market Revenue (Million), by Enterprise 2024 & 2032
- Figure 48: Mexico LATAM Payment Gateway Market Volume (Billion), by Enterprise 2024 & 2032
- Figure 49: Mexico LATAM Payment Gateway Market Revenue Share (%), by Enterprise 2024 & 2032
- Figure 50: Mexico LATAM Payment Gateway Market Volume Share (%), by Enterprise 2024 & 2032
- Figure 51: Mexico LATAM Payment Gateway Market Revenue (Million), by End-User 2024 & 2032
- Figure 52: Mexico LATAM Payment Gateway Market Volume (Billion), by End-User 2024 & 2032
- Figure 53: Mexico LATAM Payment Gateway Market Revenue Share (%), by End-User 2024 & 2032
- Figure 54: Mexico LATAM Payment Gateway Market Volume Share (%), by End-User 2024 & 2032
- Figure 55: Mexico LATAM Payment Gateway Market Revenue (Million), by Geography 2024 & 2032
- Figure 56: Mexico LATAM Payment Gateway Market Volume (Billion), by Geography 2024 & 2032
- Figure 57: Mexico LATAM Payment Gateway Market Revenue Share (%), by Geography 2024 & 2032
- Figure 58: Mexico LATAM Payment Gateway Market Volume Share (%), by Geography 2024 & 2032
- Figure 59: Mexico LATAM Payment Gateway Market Revenue (Million), by Country 2024 & 2032
- Figure 60: Mexico LATAM Payment Gateway Market Volume (Billion), by Country 2024 & 2032
- Figure 61: Mexico LATAM Payment Gateway Market Revenue Share (%), by Country 2024 & 2032
- Figure 62: Mexico LATAM Payment Gateway Market Volume Share (%), by Country 2024 & 2032
- Figure 63: Rest of Latin America LATAM Payment Gateway Market Revenue (Million), by Type 2024 & 2032
- Figure 64: Rest of Latin America LATAM Payment Gateway Market Volume (Billion), by Type 2024 & 2032
- Figure 65: Rest of Latin America LATAM Payment Gateway Market Revenue Share (%), by Type 2024 & 2032
- Figure 66: Rest of Latin America LATAM Payment Gateway Market Volume Share (%), by Type 2024 & 2032
- Figure 67: Rest of Latin America LATAM Payment Gateway Market Revenue (Million), by Enterprise 2024 & 2032
- Figure 68: Rest of Latin America LATAM Payment Gateway Market Volume (Billion), by Enterprise 2024 & 2032
- Figure 69: Rest of Latin America LATAM Payment Gateway Market Revenue Share (%), by Enterprise 2024 & 2032
- Figure 70: Rest of Latin America LATAM Payment Gateway Market Volume Share (%), by Enterprise 2024 & 2032
- Figure 71: Rest of Latin America LATAM Payment Gateway Market Revenue (Million), by End-User 2024 & 2032
- Figure 72: Rest of Latin America LATAM Payment Gateway Market Volume (Billion), by End-User 2024 & 2032
- Figure 73: Rest of Latin America LATAM Payment Gateway Market Revenue Share (%), by End-User 2024 & 2032
- Figure 74: Rest of Latin America LATAM Payment Gateway Market Volume Share (%), by End-User 2024 & 2032
- Figure 75: Rest of Latin America LATAM Payment Gateway Market Revenue (Million), by Geography 2024 & 2032
- Figure 76: Rest of Latin America LATAM Payment Gateway Market Volume (Billion), by Geography 2024 & 2032
- Figure 77: Rest of Latin America LATAM Payment Gateway Market Revenue Share (%), by Geography 2024 & 2032
- Figure 78: Rest of Latin America LATAM Payment Gateway Market Volume Share (%), by Geography 2024 & 2032
- Figure 79: Rest of Latin America LATAM Payment Gateway Market Revenue (Million), by Country 2024 & 2032
- Figure 80: Rest of Latin America LATAM Payment Gateway Market Volume (Billion), by Country 2024 & 2032
- Figure 81: Rest of Latin America LATAM Payment Gateway Market Revenue Share (%), by Country 2024 & 2032
- Figure 82: Rest of Latin America LATAM Payment Gateway Market Volume Share (%), by Country 2024 & 2032
List of Tables
- Table 1: Global LATAM Payment Gateway Market Revenue Million Forecast, by Region 2019 & 2032
- Table 2: Global LATAM Payment Gateway Market Volume Billion Forecast, by Region 2019 & 2032
- Table 3: Global LATAM Payment Gateway Market Revenue Million Forecast, by Type 2019 & 2032
- Table 4: Global LATAM Payment Gateway Market Volume Billion Forecast, by Type 2019 & 2032
- Table 5: Global LATAM Payment Gateway Market Revenue Million Forecast, by Enterprise 2019 & 2032
- Table 6: Global LATAM Payment Gateway Market Volume Billion Forecast, by Enterprise 2019 & 2032
- Table 7: Global LATAM Payment Gateway Market Revenue Million Forecast, by End-User 2019 & 2032
- Table 8: Global LATAM Payment Gateway Market Volume Billion Forecast, by End-User 2019 & 2032
- Table 9: Global LATAM Payment Gateway Market Revenue Million Forecast, by Geography 2019 & 2032
- Table 10: Global LATAM Payment Gateway Market Volume Billion Forecast, by Geography 2019 & 2032
- Table 11: Global LATAM Payment Gateway Market Revenue Million Forecast, by Region 2019 & 2032
- Table 12: Global LATAM Payment Gateway Market Volume Billion Forecast, by Region 2019 & 2032
- Table 13: Global LATAM Payment Gateway Market Revenue Million Forecast, by Type 2019 & 2032
- Table 14: Global LATAM Payment Gateway Market Volume Billion Forecast, by Type 2019 & 2032
- Table 15: Global LATAM Payment Gateway Market Revenue Million Forecast, by Enterprise 2019 & 2032
- Table 16: Global LATAM Payment Gateway Market Volume Billion Forecast, by Enterprise 2019 & 2032
- Table 17: Global LATAM Payment Gateway Market Revenue Million Forecast, by End-User 2019 & 2032
- Table 18: Global LATAM Payment Gateway Market Volume Billion Forecast, by End-User 2019 & 2032
- Table 19: Global LATAM Payment Gateway Market Revenue Million Forecast, by Geography 2019 & 2032
- Table 20: Global LATAM Payment Gateway Market Volume Billion Forecast, by Geography 2019 & 2032
- Table 21: Global LATAM Payment Gateway Market Revenue Million Forecast, by Country 2019 & 2032
- Table 22: Global LATAM Payment Gateway Market Volume Billion Forecast, by Country 2019 & 2032
- Table 23: Global LATAM Payment Gateway Market Revenue Million Forecast, by Type 2019 & 2032
- Table 24: Global LATAM Payment Gateway Market Volume Billion Forecast, by Type 2019 & 2032
- Table 25: Global LATAM Payment Gateway Market Revenue Million Forecast, by Enterprise 2019 & 2032
- Table 26: Global LATAM Payment Gateway Market Volume Billion Forecast, by Enterprise 2019 & 2032
- Table 27: Global LATAM Payment Gateway Market Revenue Million Forecast, by End-User 2019 & 2032
- Table 28: Global LATAM Payment Gateway Market Volume Billion Forecast, by End-User 2019 & 2032
- Table 29: Global LATAM Payment Gateway Market Revenue Million Forecast, by Geography 2019 & 2032
- Table 30: Global LATAM Payment Gateway Market Volume Billion Forecast, by Geography 2019 & 2032
- Table 31: Global LATAM Payment Gateway Market Revenue Million Forecast, by Country 2019 & 2032
- Table 32: Global LATAM Payment Gateway Market Volume Billion Forecast, by Country 2019 & 2032
- Table 33: Global LATAM Payment Gateway Market Revenue Million Forecast, by Type 2019 & 2032
- Table 34: Global LATAM Payment Gateway Market Volume Billion Forecast, by Type 2019 & 2032
- Table 35: Global LATAM Payment Gateway Market Revenue Million Forecast, by Enterprise 2019 & 2032
- Table 36: Global LATAM Payment Gateway Market Volume Billion Forecast, by Enterprise 2019 & 2032
- Table 37: Global LATAM Payment Gateway Market Revenue Million Forecast, by End-User 2019 & 2032
- Table 38: Global LATAM Payment Gateway Market Volume Billion Forecast, by End-User 2019 & 2032
- Table 39: Global LATAM Payment Gateway Market Revenue Million Forecast, by Geography 2019 & 2032
- Table 40: Global LATAM Payment Gateway Market Volume Billion Forecast, by Geography 2019 & 2032
- Table 41: Global LATAM Payment Gateway Market Revenue Million Forecast, by Country 2019 & 2032
- Table 42: Global LATAM Payment Gateway Market Volume Billion Forecast, by Country 2019 & 2032
- Table 43: Global LATAM Payment Gateway Market Revenue Million Forecast, by Type 2019 & 2032
- Table 44: Global LATAM Payment Gateway Market Volume Billion Forecast, by Type 2019 & 2032
- Table 45: Global LATAM Payment Gateway Market Revenue Million Forecast, by Enterprise 2019 & 2032
- Table 46: Global LATAM Payment Gateway Market Volume Billion Forecast, by Enterprise 2019 & 2032
- Table 47: Global LATAM Payment Gateway Market Revenue Million Forecast, by End-User 2019 & 2032
- Table 48: Global LATAM Payment Gateway Market Volume Billion Forecast, by End-User 2019 & 2032
- Table 49: Global LATAM Payment Gateway Market Revenue Million Forecast, by Geography 2019 & 2032
- Table 50: Global LATAM Payment Gateway Market Volume Billion Forecast, by Geography 2019 & 2032
- Table 51: Global LATAM Payment Gateway Market Revenue Million Forecast, by Country 2019 & 2032
- Table 52: Global LATAM Payment Gateway Market Volume Billion Forecast, by Country 2019 & 2032
Frequently Asked Questions
1. What is the projected Compound Annual Growth Rate (CAGR) of the LATAM Payment Gateway Market?
The projected CAGR is approximately 22.87%.
2. Which companies are prominent players in the LATAM Payment Gateway Market?
Key companies in the market include Amazon Payments Inc, PayPal Holdings Inc, Mercado Pago, Ebanx SA, WePay*List Not Exhaustive.
3. What are the main segments of the LATAM Payment Gateway Market?
The market segments include Type, Enterprise, End-User, Geography.
4. Can you provide details about the market size?
The market size is estimated to be USD 4.78 Million as of 2022.
5. What are some drivers contributing to market growth?
Increased E-commerce Sales and High Internet Penetration Rate; Increased Demand for Mobile-based Payments; Growing Adoption of Payment Gateways in Retail.
6. What are the notable trends driving market growth?
Increased E-commerce Sales and High Internet Penetration Rate.
7. Are there any restraints impacting market growth?
Increased E-commerce Sales and High Internet Penetration Rate; Increased Demand for Mobile-based Payments; Growing Adoption of Payment Gateways in Retail.
8. Can you provide examples of recent developments in the market?
September 2024: Brazil's central bank unveiled 13 'development themes' as part of the second major phase of its central bank digital currency (CBDC) experimentation. Echoing a global trend, Banco Central do Brasil (BCB) has been delving into the potential launch of its CBDC, dubbed 'Drex,' collaborating with prominent technology and payments firms.July 2024: OCN, a Mexican fintech start-up, formerly OneCarNow, raised USD 86 million in a Series A funding round, blending equity and debt. The company focuses on delivering financial services to gig workers throughout the Americas.
9. What pricing options are available for accessing the report?
Pricing options include single-user, multi-user, and enterprise licenses priced at USD 4750, USD 5250, and USD 8750 respectively.
10. Is the market size provided in terms of value or volume?
The market size is provided in terms of value, measured in Million and volume, measured in Billion.
11. Are there any specific market keywords associated with the report?
Yes, the market keyword associated with the report is "LATAM Payment Gateway Market," which aids in identifying and referencing the specific market segment covered.
12. How do I determine which pricing option suits my needs best?
The pricing options vary based on user requirements and access needs. Individual users may opt for single-user licenses, while businesses requiring broader access may choose multi-user or enterprise licenses for cost-effective access to the report.
13. Are there any additional resources or data provided in the LATAM Payment Gateway Market report?
While the report offers comprehensive insights, it's advisable to review the specific contents or supplementary materials provided to ascertain if additional resources or data are available.
14. How can I stay updated on further developments or reports in the LATAM Payment Gateway Market?
To stay informed about further developments, trends, and reports in the LATAM Payment Gateway Market, consider subscribing to industry newsletters, following relevant companies and organizations, or regularly checking reputable industry news sources and publications.
Methodology
Step 1 - Identification of Relevant Samples Size from Population Database


Step 2 - Approaches for Defining Global Market Size (Value, Volume* & Price*)

Note*: In applicable scenarios
Step 3 - Data Sources
Primary Research
- Web Analytics
- Survey Reports
- Research Institute
- Latest Research Reports
- Opinion Leaders
Secondary Research
- Annual Reports
- White Paper
- Latest Press Release
- Industry Association
- Paid Database
- Investor Presentations

Step 4 - Data Triangulation
Involves using different sources of information in order to increase the validity of a study
These sources are likely to be stakeholders in a program - participants, other researchers, program staff, other community members, and so on.
Then we put all data in single framework & apply various statistical tools to find out the dynamic on the market.
During the analysis stage, feedback from the stakeholder groups would be compared to determine areas of agreement as well as areas of divergence


