
Key Insights
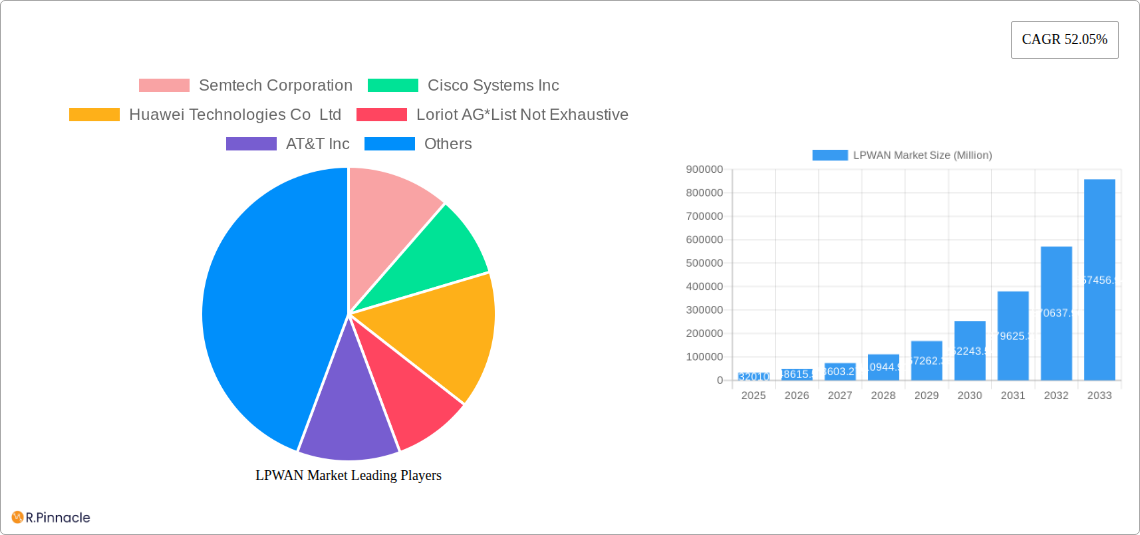
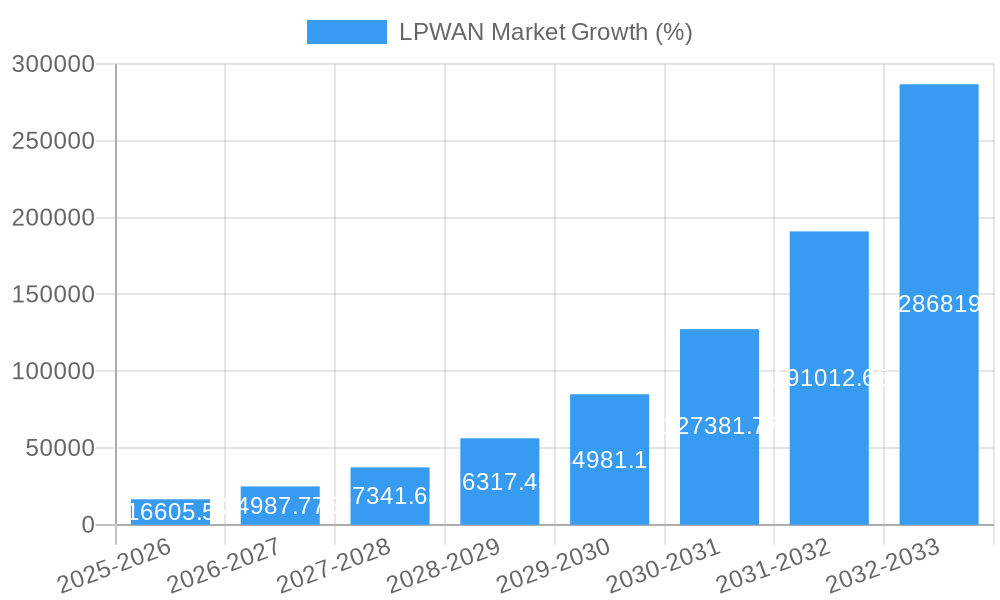
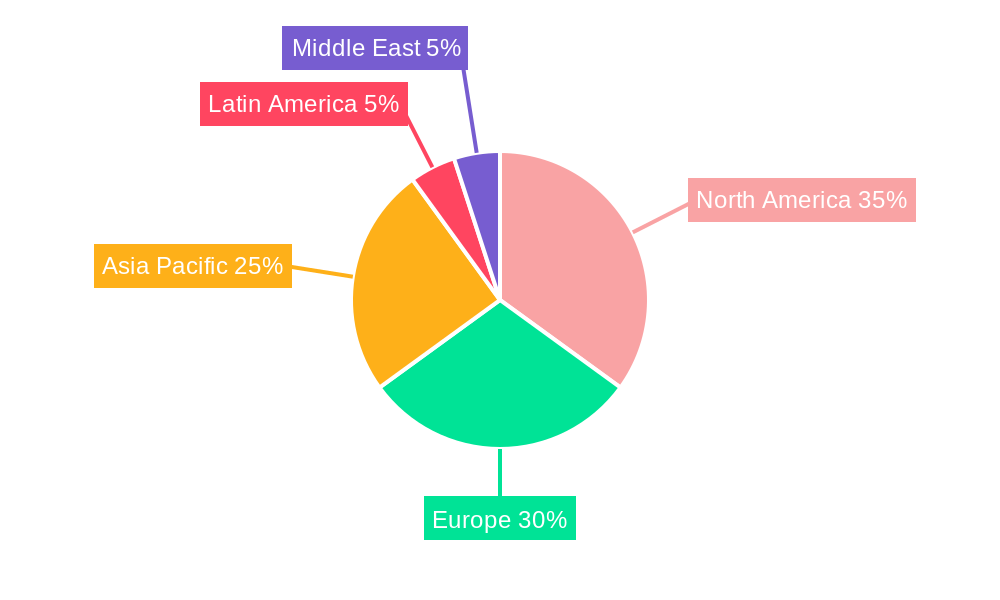
The Low-Power Wide-Area Network (LPWAN) market is experiencing explosive growth, projected to reach \$32.01 billion in 2025 and exhibiting a remarkable Compound Annual Growth Rate (CAGR) of 52.05%. This surge is driven by the increasing adoption of IoT devices across diverse sectors, demanding robust, long-range, and energy-efficient connectivity solutions. Key drivers include the escalating demand for smart city infrastructure, the proliferation of smart homes and buildings, the expanding scope of smart agriculture initiatives, and the need for efficient data transmission in industrial manufacturing and logistics. Technological advancements in LPWAN technologies like LoRaWAN, NB-IoT, and LTE-M are further fueling market expansion, offering improved network coverage, enhanced security, and greater scalability. While initial investment costs and regulatory hurdles might pose some restraints, the overall market trajectory remains exceptionally positive. The segmentation reveals a dynamic landscape, with LoRaWAN currently holding a significant market share due to its cost-effectiveness and wide availability. However, NB-IoT and LTE-M are gaining traction, particularly in applications requiring higher data rates and guaranteed quality of service. The service segment is witnessing strong growth in managed services, reflecting the increasing preference for outsourced network management and maintenance. Geographically, North America and Europe are currently leading the market, but the Asia-Pacific region is anticipated to demonstrate significant growth potential in the coming years due to its rapidly expanding IoT ecosystem and government support for digital transformation initiatives. Major players like Semtech, Cisco, Huawei, and others are aggressively investing in R&D and strategic partnerships to solidify their market positions and capitalize on emerging opportunities.
The forecast period (2025-2033) promises continued expansion, with the market likely exceeding \$100 billion by 2033 based on the provided CAGR. This projection considers ongoing technological innovation, increasing regulatory clarity in various regions, and the expanding adoption of LPWAN across new applications, such as in the healthcare sector for remote patient monitoring and in the oil and gas industry for asset tracking and pipeline monitoring. Competitive pressures will likely intensify, leading to further innovation and price reductions, further driving market penetration. However, ensuring robust cybersecurity measures and addressing potential interoperability challenges will be crucial for sustaining the market's healthy trajectory and fulfilling its immense potential in connecting the world through a multitude of IoT applications.
LPWAN Market Report: A Comprehensive Analysis (2019-2033)
This in-depth report provides a comprehensive analysis of the LPWAN market, offering invaluable insights for industry professionals, investors, and strategic decision-makers. Spanning the period from 2019 to 2033, with a focus on 2025, this report delivers a detailed examination of market dynamics, key players, technological advancements, and future growth prospects. The global LPWAN market is projected to reach xx Million by 2033, exhibiting a robust CAGR of xx% during the forecast period (2025-2033).
LPWAN Market Structure & Innovation Trends
The LPWAN market exhibits a moderately fragmented structure, with several key players vying for market share. Semtech Corporation, Cisco Systems Inc, Huawei Technologies Co Ltd, Loriot AG, AT&T Inc, Sigfox SA, Ingenu Inc, and Vodafone Group PLC are prominent players, although the market also includes numerous smaller, specialized firms. Market share data for 2024 indicates that these companies collectively hold approximately xx% of the global market. The remaining share is distributed among a large number of smaller players.
Innovation in the LPWAN market is driven by several factors:
- Technological Advancements: Continuous improvements in low-power wide-area network technologies, such as LoRaWAN, NB-IoT, and LTE-M, are driving innovation. New chipsets, improved protocols, and enhanced security features are constantly being developed.
- Regulatory Frameworks: Government regulations and initiatives promoting IoT adoption are indirectly fostering innovation within the LPWAN sector. This includes funding for smart city initiatives and the standardization of LPWAN technologies.
- Product Substitutes: The competitive landscape necessitates continuous innovation to differentiate products and services. This is partly driven by the emergence of alternative technologies, forcing existing players to enhance their offerings.
- End-User Demographics: The expanding adoption of LPWAN in diverse sectors, including smart agriculture, healthcare, and industrial manufacturing, fuels the demand for innovative solutions tailored to specific needs.
- M&A Activities: Mergers and acquisitions are reshaping the market landscape, often leading to technological integration and expansion into new market segments. While precise deal values vary greatly, several notable M&A deals exceeding xx Million have occurred in recent years, consolidating market share among key players.
LPWAN Market Dynamics & Trends
The LPWAN market is experiencing significant growth, propelled by a convergence of factors. The increasing adoption of IoT devices across various industries is a key driver, with smart city deployments and industrial applications significantly contributing to market expansion. The global market is expected to reach xx Million by 2025, driven by a CAGR of xx% from 2019-2024. Market penetration rates vary across regions and applications, with higher adoption rates observed in developed economies and sectors with established IoT infrastructure. Consumer preferences for connected devices are also shaping market trends. The demand for seamless connectivity, low power consumption, and robust security features has spurred continuous improvements in LPWAN technologies. Competitive dynamics are characterized by both cooperation and rivalry, with key players forming partnerships to expand market reach while simultaneously competing for market share. Technological disruptions, such as the introduction of new LPWAN standards and the integration of LPWAN with other communication technologies, are reshaping the competitive landscape.
Dominant Regions & Segments in LPWAN Market
The North American region currently holds the largest share of the LPWAN market, driven by extensive IoT infrastructure and significant investments in smart city initiatives. However, the Asia-Pacific region is expected to witness the fastest growth due to rapid industrialization and increasing adoption in emerging economies.
Key Drivers:
- North America: Robust IoT infrastructure, strong government support for smart city projects, and a high concentration of technology companies.
- Asia-Pacific: Rapid industrialization, expanding smart city initiatives, and cost-effective LPWAN solutions driving adoption in diverse sectors.
- Europe: Strong regulatory framework promoting IoT adoption, focused investment in smart agriculture, and a growing number of LPWAN deployments in various sectors.
Segment Dominance:
- By Type: LoRaWAN currently holds the largest market share due to its cost-effectiveness and scalability. However, NB-IoT and LTE-M are gaining traction due to their wider coverage and improved reliability.
- By Service: Managed services are gaining popularity among enterprises due to their reduced operational burden and simplified management.
- By End-user: The industrial manufacturing sector is a major adopter of LPWAN technologies due to its need for reliable connectivity in harsh environments.
- By Application: Smart city deployments are driving a significant portion of the LPWAN market growth.
LPWAN Market Product Innovations
Recent product innovations have focused on enhancing performance, security, and power efficiency. The introduction of new chipsets with improved range, lower power consumption, and advanced security features has been a key driver. Moreover, the integration of LPWAN with other technologies, such as GPS and cloud platforms, is expanding the capabilities of LPWAN-enabled devices. Companies are focusing on developing cost-effective and easily deployable solutions that cater to a broader range of applications. This includes pre-configured gateways and user-friendly management platforms. The market fit for these innovations is strong, given the increasing demand for robust and reliable LPWAN solutions across various industries.
Report Scope & Segmentation Analysis
This report segments the LPWAN market comprehensively across various parameters:
By Type: LoRaWAN, NB-IoT, LTE-M, Other Types (Sigfox, Weightless, etc.) – Each type offers unique features and caters to different application requirements. Growth projections vary significantly among these types, with LoRaWAN currently holding a significant lead.
By Service: Professional Service, Managed Service – The market size and growth rates for each service type reflect differing enterprise preferences in terms of operational responsibility and cost structure.
By End-user: Oil and Gas, Consumer Electronics, Healthcare, Industrial Manufacturing, Logistics and Travelling, Other End-users – The adoption of LPWAN across these diverse sectors significantly varies, reflecting the distinct needs and challenges within each.
By Application: Smart Cities, Smart Homes/Buildings, Smart Agriculture, Other Applications – Market sizes and growth projections for these applications are influenced by technological advancements, government policies, and consumer preferences.
Key Drivers of LPWAN Market Growth
Several key factors are driving the growth of the LPWAN market:
- Technological Advancements: Improvements in power efficiency, range, and security of LPWAN technologies.
- IoT Adoption: The surge in deployment of IoT devices across diverse industries creating a significant demand for connectivity.
- Government Initiatives: Support for smart city initiatives and regulatory frameworks promoting IoT adoption.
- Cost-Effectiveness: LPWAN technologies offer a relatively cost-effective solution compared to traditional cellular networks.
Challenges in the LPWAN Market Sector
Despite strong growth prospects, the LPWAN market faces several challenges:
- Interoperability: Lack of standardization across various LPWAN technologies can hinder seamless integration.
- Security Concerns: Ensuring the security of LPWAN networks is crucial, as data breaches could have significant consequences.
- Deployment Costs: The initial investment for deploying LPWAN infrastructure can be substantial for some organizations.
- Competition: The competitive landscape is intensifying, making it challenging for smaller players to survive.
Emerging Opportunities in LPWAN Market
Several emerging trends present exciting opportunities for growth in the LPWAN market:
- Integration with other technologies: The convergence of LPWAN with other technologies like AI and cloud computing is opening new possibilities.
- 5G Integration: The integration of LPWAN with 5G networks can enhance coverage and performance.
- New Applications: The expansion of LPWAN into new sectors like smart agriculture and environmental monitoring offers significant growth potential.
- Private Networks: The growing adoption of private LPWAN networks for enhanced security and control.
Leading Players in the LPWAN Market Market
- Semtech Corporation
- Cisco Systems Inc
- Huawei Technologies Co Ltd
- Loriot AG
- AT&T Inc
- Sigfox SA
- Ingenu Inc
- Vodafone Group PLC
Key Developments in LPWAN Market Industry
April 2023: Semtech Corporation announced the expansion of its PerSe product portfolio with a brand-new integrated circuit (IC) intended for 5G mobile devices. This innovation enhances RF control in end devices, optimizing performance and improving 5G SAR compliance.
April 2023: UnaBiz opened its proprietary Sigfox 0G technology device library code to the public, empowering a wider range of developers to integrate 0G technology into IoT devices and applications, thereby improving energy consumption and multi-connectivity capabilities.
Future Outlook for LPWAN Market Market
The LPWAN market is poised for continued robust growth, driven by accelerating IoT adoption, advancements in LPWAN technologies, and supportive government policies. The expansion into new applications and geographies presents significant opportunities for market players. Strategic partnerships and collaborations will play a key role in shaping the future landscape, fostering innovation and expanding market reach. The focus on enhanced security and interoperability will be crucial for ensuring sustained growth and widespread adoption.
LPWAN Market Segmentation
-
1. Type
- 1.1. LoRaWAN
- 1.2. NB-IoT
- 1.3. LTE-M
- 1.4. Other Types (Sigfox, Weightless, etc.)
-
2. Service
- 2.1. Professional Service
- 2.2. Managed Service
-
3. End User
- 3.1. Oil and Gas
- 3.2. Consumer Electronics
- 3.3. Healthcare
- 3.4. Industrial Manufacturing
- 3.5. Logistics and Travelling
- 3.6. Other End Users
-
4. Application
- 4.1. Smart Cities
- 4.2. Smart Homes/Buildings
- 4.3. Smart Agriculture
- 4.4. Other Applications
LPWAN Market Segmentation By Geography
- 1. North America
- 2. Europe
- 3. Asia
- 4. Australia and New Zealand
- 5. Latin America
- 6. Middle East and Africa
LPWAN Market REPORT HIGHLIGHTS
| Aspects | Details |
|---|---|
| Study Period | 2019-2033 |
| Base Year | 2024 |
| Estimated Year | 2025 |
| Forecast Period | 2025-2033 |
| Historical Period | 2019-2024 |
| Growth Rate | CAGR of 52.05% from 2019-2033 |
| Segmentation |
|
Table of Contents
- 1. Introduction
- 1.1. Research Scope
- 1.2. Market Segmentation
- 1.3. Research Methodology
- 1.4. Definitions and Assumptions
- 2. Executive Summary
- 2.1. Introduction
- 3. Market Dynamics
- 3.1. Introduction
- 3.2. Market Drivers
- 3.2.1. Rising Need of Long Range Connectivity Between Devices5.1.2 5G Technology to Drive the Market Growth
- 3.3. Market Restrains
- 3.3.1. Privacy and Security Concerns
- 3.4. Market Trends
- 3.4.1. 5G Technology to Drive the Market Growth
- 4. Market Factor Analysis
- 4.1. Porters Five Forces
- 4.2. Supply/Value Chain
- 4.3. PESTEL analysis
- 4.4. Market Entropy
- 4.5. Patent/Trademark Analysis
- 5. Global LPWAN Market Analysis, Insights and Forecast, 2019-2031
- 5.1. Market Analysis, Insights and Forecast - by Type
- 5.1.1. LoRaWAN
- 5.1.2. NB-IoT
- 5.1.3. LTE-M
- 5.1.4. Other Types (Sigfox, Weightless, etc.)
- 5.2. Market Analysis, Insights and Forecast - by Service
- 5.2.1. Professional Service
- 5.2.2. Managed Service
- 5.3. Market Analysis, Insights and Forecast - by End User
- 5.3.1. Oil and Gas
- 5.3.2. Consumer Electronics
- 5.3.3. Healthcare
- 5.3.4. Industrial Manufacturing
- 5.3.5. Logistics and Travelling
- 5.3.6. Other End Users
- 5.4. Market Analysis, Insights and Forecast - by Application
- 5.4.1. Smart Cities
- 5.4.2. Smart Homes/Buildings
- 5.4.3. Smart Agriculture
- 5.4.4. Other Applications
- 5.5. Market Analysis, Insights and Forecast - by Region
- 5.5.1. North America
- 5.5.2. Europe
- 5.5.3. Asia
- 5.5.4. Australia and New Zealand
- 5.5.5. Latin America
- 5.5.6. Middle East and Africa
- 5.1. Market Analysis, Insights and Forecast - by Type
- 6. North America LPWAN Market Analysis, Insights and Forecast, 2019-2031
- 6.1. Market Analysis, Insights and Forecast - by Type
- 6.1.1. LoRaWAN
- 6.1.2. NB-IoT
- 6.1.3. LTE-M
- 6.1.4. Other Types (Sigfox, Weightless, etc.)
- 6.2. Market Analysis, Insights and Forecast - by Service
- 6.2.1. Professional Service
- 6.2.2. Managed Service
- 6.3. Market Analysis, Insights and Forecast - by End User
- 6.3.1. Oil and Gas
- 6.3.2. Consumer Electronics
- 6.3.3. Healthcare
- 6.3.4. Industrial Manufacturing
- 6.3.5. Logistics and Travelling
- 6.3.6. Other End Users
- 6.4. Market Analysis, Insights and Forecast - by Application
- 6.4.1. Smart Cities
- 6.4.2. Smart Homes/Buildings
- 6.4.3. Smart Agriculture
- 6.4.4. Other Applications
- 6.1. Market Analysis, Insights and Forecast - by Type
- 7. Europe LPWAN Market Analysis, Insights and Forecast, 2019-2031
- 7.1. Market Analysis, Insights and Forecast - by Type
- 7.1.1. LoRaWAN
- 7.1.2. NB-IoT
- 7.1.3. LTE-M
- 7.1.4. Other Types (Sigfox, Weightless, etc.)
- 7.2. Market Analysis, Insights and Forecast - by Service
- 7.2.1. Professional Service
- 7.2.2. Managed Service
- 7.3. Market Analysis, Insights and Forecast - by End User
- 7.3.1. Oil and Gas
- 7.3.2. Consumer Electronics
- 7.3.3. Healthcare
- 7.3.4. Industrial Manufacturing
- 7.3.5. Logistics and Travelling
- 7.3.6. Other End Users
- 7.4. Market Analysis, Insights and Forecast - by Application
- 7.4.1. Smart Cities
- 7.4.2. Smart Homes/Buildings
- 7.4.3. Smart Agriculture
- 7.4.4. Other Applications
- 7.1. Market Analysis, Insights and Forecast - by Type
- 8. Asia LPWAN Market Analysis, Insights and Forecast, 2019-2031
- 8.1. Market Analysis, Insights and Forecast - by Type
- 8.1.1. LoRaWAN
- 8.1.2. NB-IoT
- 8.1.3. LTE-M
- 8.1.4. Other Types (Sigfox, Weightless, etc.)
- 8.2. Market Analysis, Insights and Forecast - by Service
- 8.2.1. Professional Service
- 8.2.2. Managed Service
- 8.3. Market Analysis, Insights and Forecast - by End User
- 8.3.1. Oil and Gas
- 8.3.2. Consumer Electronics
- 8.3.3. Healthcare
- 8.3.4. Industrial Manufacturing
- 8.3.5. Logistics and Travelling
- 8.3.6. Other End Users
- 8.4. Market Analysis, Insights and Forecast - by Application
- 8.4.1. Smart Cities
- 8.4.2. Smart Homes/Buildings
- 8.4.3. Smart Agriculture
- 8.4.4. Other Applications
- 8.1. Market Analysis, Insights and Forecast - by Type
- 9. Australia and New Zealand LPWAN Market Analysis, Insights and Forecast, 2019-2031
- 9.1. Market Analysis, Insights and Forecast - by Type
- 9.1.1. LoRaWAN
- 9.1.2. NB-IoT
- 9.1.3. LTE-M
- 9.1.4. Other Types (Sigfox, Weightless, etc.)
- 9.2. Market Analysis, Insights and Forecast - by Service
- 9.2.1. Professional Service
- 9.2.2. Managed Service
- 9.3. Market Analysis, Insights and Forecast - by End User
- 9.3.1. Oil and Gas
- 9.3.2. Consumer Electronics
- 9.3.3. Healthcare
- 9.3.4. Industrial Manufacturing
- 9.3.5. Logistics and Travelling
- 9.3.6. Other End Users
- 9.4. Market Analysis, Insights and Forecast - by Application
- 9.4.1. Smart Cities
- 9.4.2. Smart Homes/Buildings
- 9.4.3. Smart Agriculture
- 9.4.4. Other Applications
- 9.1. Market Analysis, Insights and Forecast - by Type
- 10. Latin America LPWAN Market Analysis, Insights and Forecast, 2019-2031
- 10.1. Market Analysis, Insights and Forecast - by Type
- 10.1.1. LoRaWAN
- 10.1.2. NB-IoT
- 10.1.3. LTE-M
- 10.1.4. Other Types (Sigfox, Weightless, etc.)
- 10.2. Market Analysis, Insights and Forecast - by Service
- 10.2.1. Professional Service
- 10.2.2. Managed Service
- 10.3. Market Analysis, Insights and Forecast - by End User
- 10.3.1. Oil and Gas
- 10.3.2. Consumer Electronics
- 10.3.3. Healthcare
- 10.3.4. Industrial Manufacturing
- 10.3.5. Logistics and Travelling
- 10.3.6. Other End Users
- 10.4. Market Analysis, Insights and Forecast - by Application
- 10.4.1. Smart Cities
- 10.4.2. Smart Homes/Buildings
- 10.4.3. Smart Agriculture
- 10.4.4. Other Applications
- 10.1. Market Analysis, Insights and Forecast - by Type
- 11. Middle East and Africa LPWAN Market Analysis, Insights and Forecast, 2019-2031
- 11.1. Market Analysis, Insights and Forecast - by Type
- 11.1.1. LoRaWAN
- 11.1.2. NB-IoT
- 11.1.3. LTE-M
- 11.1.4. Other Types (Sigfox, Weightless, etc.)
- 11.2. Market Analysis, Insights and Forecast - by Service
- 11.2.1. Professional Service
- 11.2.2. Managed Service
- 11.3. Market Analysis, Insights and Forecast - by End User
- 11.3.1. Oil and Gas
- 11.3.2. Consumer Electronics
- 11.3.3. Healthcare
- 11.3.4. Industrial Manufacturing
- 11.3.5. Logistics and Travelling
- 11.3.6. Other End Users
- 11.4. Market Analysis, Insights and Forecast - by Application
- 11.4.1. Smart Cities
- 11.4.2. Smart Homes/Buildings
- 11.4.3. Smart Agriculture
- 11.4.4. Other Applications
- 11.1. Market Analysis, Insights and Forecast - by Type
- 12. North America LPWAN Market Analysis, Insights and Forecast, 2019-2031
- 12.1. Market Analysis, Insights and Forecast - By Country/Sub-region
- 12.1.1.
- 13. Europe LPWAN Market Analysis, Insights and Forecast, 2019-2031
- 13.1. Market Analysis, Insights and Forecast - By Country/Sub-region
- 13.1.1.
- 14. Asia Pacific LPWAN Market Analysis, Insights and Forecast, 2019-2031
- 14.1. Market Analysis, Insights and Forecast - By Country/Sub-region
- 14.1.1.
- 15. Latin America LPWAN Market Analysis, Insights and Forecast, 2019-2031
- 15.1. Market Analysis, Insights and Forecast - By Country/Sub-region
- 15.1.1.
- 16. Middle East LPWAN Market Analysis, Insights and Forecast, 2019-2031
- 16.1. Market Analysis, Insights and Forecast - By Country/Sub-region
- 16.1.1.
- 17. Competitive Analysis
- 17.1. Global Market Share Analysis 2024
- 17.2. Company Profiles
- 17.2.1 Semtech Corporation
- 17.2.1.1. Overview
- 17.2.1.2. Products
- 17.2.1.3. SWOT Analysis
- 17.2.1.4. Recent Developments
- 17.2.1.5. Financials (Based on Availability)
- 17.2.2 Cisco Systems Inc
- 17.2.2.1. Overview
- 17.2.2.2. Products
- 17.2.2.3. SWOT Analysis
- 17.2.2.4. Recent Developments
- 17.2.2.5. Financials (Based on Availability)
- 17.2.3 Huawei Technologies Co Ltd
- 17.2.3.1. Overview
- 17.2.3.2. Products
- 17.2.3.3. SWOT Analysis
- 17.2.3.4. Recent Developments
- 17.2.3.5. Financials (Based on Availability)
- 17.2.4 Loriot AG*List Not Exhaustive
- 17.2.4.1. Overview
- 17.2.4.2. Products
- 17.2.4.3. SWOT Analysis
- 17.2.4.4. Recent Developments
- 17.2.4.5. Financials (Based on Availability)
- 17.2.5 AT&T Inc
- 17.2.5.1. Overview
- 17.2.5.2. Products
- 17.2.5.3. SWOT Analysis
- 17.2.5.4. Recent Developments
- 17.2.5.5. Financials (Based on Availability)
- 17.2.6 Sigfox SA
- 17.2.6.1. Overview
- 17.2.6.2. Products
- 17.2.6.3. SWOT Analysis
- 17.2.6.4. Recent Developments
- 17.2.6.5. Financials (Based on Availability)
- 17.2.7 Ingenu Inc
- 17.2.7.1. Overview
- 17.2.7.2. Products
- 17.2.7.3. SWOT Analysis
- 17.2.7.4. Recent Developments
- 17.2.7.5. Financials (Based on Availability)
- 17.2.8 Vodafone Group PLC
- 17.2.8.1. Overview
- 17.2.8.2. Products
- 17.2.8.3. SWOT Analysis
- 17.2.8.4. Recent Developments
- 17.2.8.5. Financials (Based on Availability)
- 17.2.1 Semtech Corporation
List of Figures
- Figure 1: Global LPWAN Market Revenue Breakdown (Million, %) by Region 2024 & 2032
- Figure 2: North America LPWAN Market Revenue (Million), by Country 2024 & 2032
- Figure 3: North America LPWAN Market Revenue Share (%), by Country 2024 & 2032
- Figure 4: Europe LPWAN Market Revenue (Million), by Country 2024 & 2032
- Figure 5: Europe LPWAN Market Revenue Share (%), by Country 2024 & 2032
- Figure 6: Asia Pacific LPWAN Market Revenue (Million), by Country 2024 & 2032
- Figure 7: Asia Pacific LPWAN Market Revenue Share (%), by Country 2024 & 2032
- Figure 8: Latin America LPWAN Market Revenue (Million), by Country 2024 & 2032
- Figure 9: Latin America LPWAN Market Revenue Share (%), by Country 2024 & 2032
- Figure 10: Middle East LPWAN Market Revenue (Million), by Country 2024 & 2032
- Figure 11: Middle East LPWAN Market Revenue Share (%), by Country 2024 & 2032
- Figure 12: North America LPWAN Market Revenue (Million), by Type 2024 & 2032
- Figure 13: North America LPWAN Market Revenue Share (%), by Type 2024 & 2032
- Figure 14: North America LPWAN Market Revenue (Million), by Service 2024 & 2032
- Figure 15: North America LPWAN Market Revenue Share (%), by Service 2024 & 2032
- Figure 16: North America LPWAN Market Revenue (Million), by End User 2024 & 2032
- Figure 17: North America LPWAN Market Revenue Share (%), by End User 2024 & 2032
- Figure 18: North America LPWAN Market Revenue (Million), by Application 2024 & 2032
- Figure 19: North America LPWAN Market Revenue Share (%), by Application 2024 & 2032
- Figure 20: North America LPWAN Market Revenue (Million), by Country 2024 & 2032
- Figure 21: North America LPWAN Market Revenue Share (%), by Country 2024 & 2032
- Figure 22: Europe LPWAN Market Revenue (Million), by Type 2024 & 2032
- Figure 23: Europe LPWAN Market Revenue Share (%), by Type 2024 & 2032
- Figure 24: Europe LPWAN Market Revenue (Million), by Service 2024 & 2032
- Figure 25: Europe LPWAN Market Revenue Share (%), by Service 2024 & 2032
- Figure 26: Europe LPWAN Market Revenue (Million), by End User 2024 & 2032
- Figure 27: Europe LPWAN Market Revenue Share (%), by End User 2024 & 2032
- Figure 28: Europe LPWAN Market Revenue (Million), by Application 2024 & 2032
- Figure 29: Europe LPWAN Market Revenue Share (%), by Application 2024 & 2032
- Figure 30: Europe LPWAN Market Revenue (Million), by Country 2024 & 2032
- Figure 31: Europe LPWAN Market Revenue Share (%), by Country 2024 & 2032
- Figure 32: Asia LPWAN Market Revenue (Million), by Type 2024 & 2032
- Figure 33: Asia LPWAN Market Revenue Share (%), by Type 2024 & 2032
- Figure 34: Asia LPWAN Market Revenue (Million), by Service 2024 & 2032
- Figure 35: Asia LPWAN Market Revenue Share (%), by Service 2024 & 2032
- Figure 36: Asia LPWAN Market Revenue (Million), by End User 2024 & 2032
- Figure 37: Asia LPWAN Market Revenue Share (%), by End User 2024 & 2032
- Figure 38: Asia LPWAN Market Revenue (Million), by Application 2024 & 2032
- Figure 39: Asia LPWAN Market Revenue Share (%), by Application 2024 & 2032
- Figure 40: Asia LPWAN Market Revenue (Million), by Country 2024 & 2032
- Figure 41: Asia LPWAN Market Revenue Share (%), by Country 2024 & 2032
- Figure 42: Australia and New Zealand LPWAN Market Revenue (Million), by Type 2024 & 2032
- Figure 43: Australia and New Zealand LPWAN Market Revenue Share (%), by Type 2024 & 2032
- Figure 44: Australia and New Zealand LPWAN Market Revenue (Million), by Service 2024 & 2032
- Figure 45: Australia and New Zealand LPWAN Market Revenue Share (%), by Service 2024 & 2032
- Figure 46: Australia and New Zealand LPWAN Market Revenue (Million), by End User 2024 & 2032
- Figure 47: Australia and New Zealand LPWAN Market Revenue Share (%), by End User 2024 & 2032
- Figure 48: Australia and New Zealand LPWAN Market Revenue (Million), by Application 2024 & 2032
- Figure 49: Australia and New Zealand LPWAN Market Revenue Share (%), by Application 2024 & 2032
- Figure 50: Australia and New Zealand LPWAN Market Revenue (Million), by Country 2024 & 2032
- Figure 51: Australia and New Zealand LPWAN Market Revenue Share (%), by Country 2024 & 2032
- Figure 52: Latin America LPWAN Market Revenue (Million), by Type 2024 & 2032
- Figure 53: Latin America LPWAN Market Revenue Share (%), by Type 2024 & 2032
- Figure 54: Latin America LPWAN Market Revenue (Million), by Service 2024 & 2032
- Figure 55: Latin America LPWAN Market Revenue Share (%), by Service 2024 & 2032
- Figure 56: Latin America LPWAN Market Revenue (Million), by End User 2024 & 2032
- Figure 57: Latin America LPWAN Market Revenue Share (%), by End User 2024 & 2032
- Figure 58: Latin America LPWAN Market Revenue (Million), by Application 2024 & 2032
- Figure 59: Latin America LPWAN Market Revenue Share (%), by Application 2024 & 2032
- Figure 60: Latin America LPWAN Market Revenue (Million), by Country 2024 & 2032
- Figure 61: Latin America LPWAN Market Revenue Share (%), by Country 2024 & 2032
- Figure 62: Middle East and Africa LPWAN Market Revenue (Million), by Type 2024 & 2032
- Figure 63: Middle East and Africa LPWAN Market Revenue Share (%), by Type 2024 & 2032
- Figure 64: Middle East and Africa LPWAN Market Revenue (Million), by Service 2024 & 2032
- Figure 65: Middle East and Africa LPWAN Market Revenue Share (%), by Service 2024 & 2032
- Figure 66: Middle East and Africa LPWAN Market Revenue (Million), by End User 2024 & 2032
- Figure 67: Middle East and Africa LPWAN Market Revenue Share (%), by End User 2024 & 2032
- Figure 68: Middle East and Africa LPWAN Market Revenue (Million), by Application 2024 & 2032
- Figure 69: Middle East and Africa LPWAN Market Revenue Share (%), by Application 2024 & 2032
- Figure 70: Middle East and Africa LPWAN Market Revenue (Million), by Country 2024 & 2032
- Figure 71: Middle East and Africa LPWAN Market Revenue Share (%), by Country 2024 & 2032
List of Tables
- Table 1: Global LPWAN Market Revenue Million Forecast, by Region 2019 & 2032
- Table 2: Global LPWAN Market Revenue Million Forecast, by Type 2019 & 2032
- Table 3: Global LPWAN Market Revenue Million Forecast, by Service 2019 & 2032
- Table 4: Global LPWAN Market Revenue Million Forecast, by End User 2019 & 2032
- Table 5: Global LPWAN Market Revenue Million Forecast, by Application 2019 & 2032
- Table 6: Global LPWAN Market Revenue Million Forecast, by Region 2019 & 2032
- Table 7: Global LPWAN Market Revenue Million Forecast, by Country 2019 & 2032
- Table 8: LPWAN Market Revenue (Million) Forecast, by Application 2019 & 2032
- Table 9: Global LPWAN Market Revenue Million Forecast, by Country 2019 & 2032
- Table 10: LPWAN Market Revenue (Million) Forecast, by Application 2019 & 2032
- Table 11: Global LPWAN Market Revenue Million Forecast, by Country 2019 & 2032
- Table 12: LPWAN Market Revenue (Million) Forecast, by Application 2019 & 2032
- Table 13: Global LPWAN Market Revenue Million Forecast, by Country 2019 & 2032
- Table 14: LPWAN Market Revenue (Million) Forecast, by Application 2019 & 2032
- Table 15: Global LPWAN Market Revenue Million Forecast, by Country 2019 & 2032
- Table 16: LPWAN Market Revenue (Million) Forecast, by Application 2019 & 2032
- Table 17: Global LPWAN Market Revenue Million Forecast, by Type 2019 & 2032
- Table 18: Global LPWAN Market Revenue Million Forecast, by Service 2019 & 2032
- Table 19: Global LPWAN Market Revenue Million Forecast, by End User 2019 & 2032
- Table 20: Global LPWAN Market Revenue Million Forecast, by Application 2019 & 2032
- Table 21: Global LPWAN Market Revenue Million Forecast, by Country 2019 & 2032
- Table 22: Global LPWAN Market Revenue Million Forecast, by Type 2019 & 2032
- Table 23: Global LPWAN Market Revenue Million Forecast, by Service 2019 & 2032
- Table 24: Global LPWAN Market Revenue Million Forecast, by End User 2019 & 2032
- Table 25: Global LPWAN Market Revenue Million Forecast, by Application 2019 & 2032
- Table 26: Global LPWAN Market Revenue Million Forecast, by Country 2019 & 2032
- Table 27: Global LPWAN Market Revenue Million Forecast, by Type 2019 & 2032
- Table 28: Global LPWAN Market Revenue Million Forecast, by Service 2019 & 2032
- Table 29: Global LPWAN Market Revenue Million Forecast, by End User 2019 & 2032
- Table 30: Global LPWAN Market Revenue Million Forecast, by Application 2019 & 2032
- Table 31: Global LPWAN Market Revenue Million Forecast, by Country 2019 & 2032
- Table 32: Global LPWAN Market Revenue Million Forecast, by Type 2019 & 2032
- Table 33: Global LPWAN Market Revenue Million Forecast, by Service 2019 & 2032
- Table 34: Global LPWAN Market Revenue Million Forecast, by End User 2019 & 2032
- Table 35: Global LPWAN Market Revenue Million Forecast, by Application 2019 & 2032
- Table 36: Global LPWAN Market Revenue Million Forecast, by Country 2019 & 2032
- Table 37: Global LPWAN Market Revenue Million Forecast, by Type 2019 & 2032
- Table 38: Global LPWAN Market Revenue Million Forecast, by Service 2019 & 2032
- Table 39: Global LPWAN Market Revenue Million Forecast, by End User 2019 & 2032
- Table 40: Global LPWAN Market Revenue Million Forecast, by Application 2019 & 2032
- Table 41: Global LPWAN Market Revenue Million Forecast, by Country 2019 & 2032
- Table 42: Global LPWAN Market Revenue Million Forecast, by Type 2019 & 2032
- Table 43: Global LPWAN Market Revenue Million Forecast, by Service 2019 & 2032
- Table 44: Global LPWAN Market Revenue Million Forecast, by End User 2019 & 2032
- Table 45: Global LPWAN Market Revenue Million Forecast, by Application 2019 & 2032
- Table 46: Global LPWAN Market Revenue Million Forecast, by Country 2019 & 2032
Frequently Asked Questions
1. What is the projected Compound Annual Growth Rate (CAGR) of the LPWAN Market?
The projected CAGR is approximately 52.05%.
2. Which companies are prominent players in the LPWAN Market?
Key companies in the market include Semtech Corporation, Cisco Systems Inc, Huawei Technologies Co Ltd, Loriot AG*List Not Exhaustive, AT&T Inc, Sigfox SA, Ingenu Inc, Vodafone Group PLC.
3. What are the main segments of the LPWAN Market?
The market segments include Type, Service, End User, Application.
4. Can you provide details about the market size?
The market size is estimated to be USD 32.01 Million as of 2022.
5. What are some drivers contributing to market growth?
Rising Need of Long Range Connectivity Between Devices5.1.2 5G Technology to Drive the Market Growth.
6. What are the notable trends driving market growth?
5G Technology to Drive the Market Growth.
7. Are there any restraints impacting market growth?
Privacy and Security Concerns.
8. Can you provide examples of recent developments in the market?
April 2023: Semtech Corporation announced the expansion of its PerSe product portfolio with a brand-new integrated circuit (IC) that is intended for 5G mobile devices is being released. With the aid of Semtech's PerSe technology, advanced radio frequency (RF) control may be implemented on end devices like smartphones. Designers may optimize RF performance, improve connectivity, and ensure higher compliance with worldwide specific absorption rate (SAR) criteria for 5G-enabled consumer products with the PerSe connects SX9376.
9. What pricing options are available for accessing the report?
Pricing options include single-user, multi-user, and enterprise licenses priced at USD 4750, USD 5250, and USD 8750 respectively.
10. Is the market size provided in terms of value or volume?
The market size is provided in terms of value, measured in Million.
11. Are there any specific market keywords associated with the report?
Yes, the market keyword associated with the report is "LPWAN Market," which aids in identifying and referencing the specific market segment covered.
12. How do I determine which pricing option suits my needs best?
The pricing options vary based on user requirements and access needs. Individual users may opt for single-user licenses, while businesses requiring broader access may choose multi-user or enterprise licenses for cost-effective access to the report.
13. Are there any additional resources or data provided in the LPWAN Market report?
While the report offers comprehensive insights, it's advisable to review the specific contents or supplementary materials provided to ascertain if additional resources or data are available.
14. How can I stay updated on further developments or reports in the LPWAN Market?
To stay informed about further developments, trends, and reports in the LPWAN Market, consider subscribing to industry newsletters, following relevant companies and organizations, or regularly checking reputable industry news sources and publications.
Methodology
Step 1 - Identification of Relevant Samples Size from Population Database


Step 2 - Approaches for Defining Global Market Size (Value, Volume* & Price*)

Note*: In applicable scenarios
Step 3 - Data Sources
Primary Research
- Web Analytics
- Survey Reports
- Research Institute
- Latest Research Reports
- Opinion Leaders
Secondary Research
- Annual Reports
- White Paper
- Latest Press Release
- Industry Association
- Paid Database
- Investor Presentations

Step 4 - Data Triangulation
Involves using different sources of information in order to increase the validity of a study
These sources are likely to be stakeholders in a program - participants, other researchers, program staff, other community members, and so on.
Then we put all data in single framework & apply various statistical tools to find out the dynamic on the market.
During the analysis stage, feedback from the stakeholder groups would be compared to determine areas of agreement as well as areas of divergence


