
Key Insights
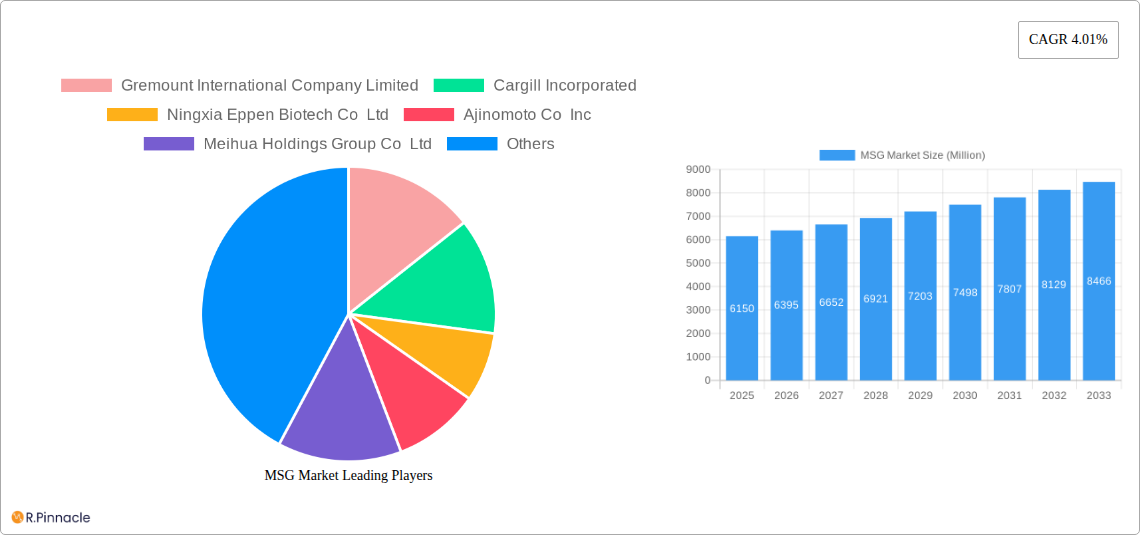
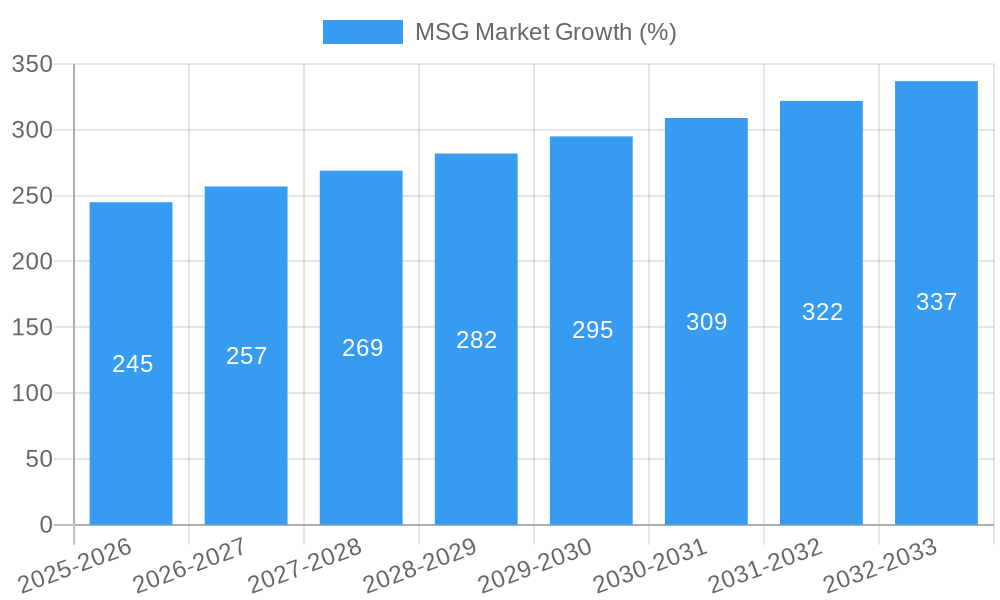
The global monosodium glutamate (MSG) market, valued at $6.15 billion in 2025, is projected to experience robust growth, driven by increasing demand from the food and beverage industry. The compound annual growth rate (CAGR) of 4.01% from 2025 to 2033 indicates a steady expansion, fueled by several key factors. Rising consumer preference for processed and convenience foods, particularly noodles, soups, and meat products, significantly contributes to the market's growth. The versatility of MSG as a flavor enhancer in various culinary applications, from seasonings and dressings to other food products, further expands its market reach. Expanding global populations in developing economies also represent a significant growth opportunity, as MSG offers an affordable way to enhance the taste of staple foods. However, the market faces challenges including concerns about MSG's potential health effects, despite scientific evidence refuting many of these concerns. The industry is actively addressing these concerns through improved transparency and education initiatives. Competitive dynamics within the market are intense, with both large multinational corporations and regional players vying for market share. Innovation in MSG production, focusing on sustainability and improved quality, is another key trend shaping the future of this market. Segment-wise, the noodles and soups segment is expected to dominate, owing to the high consumption of these products globally.
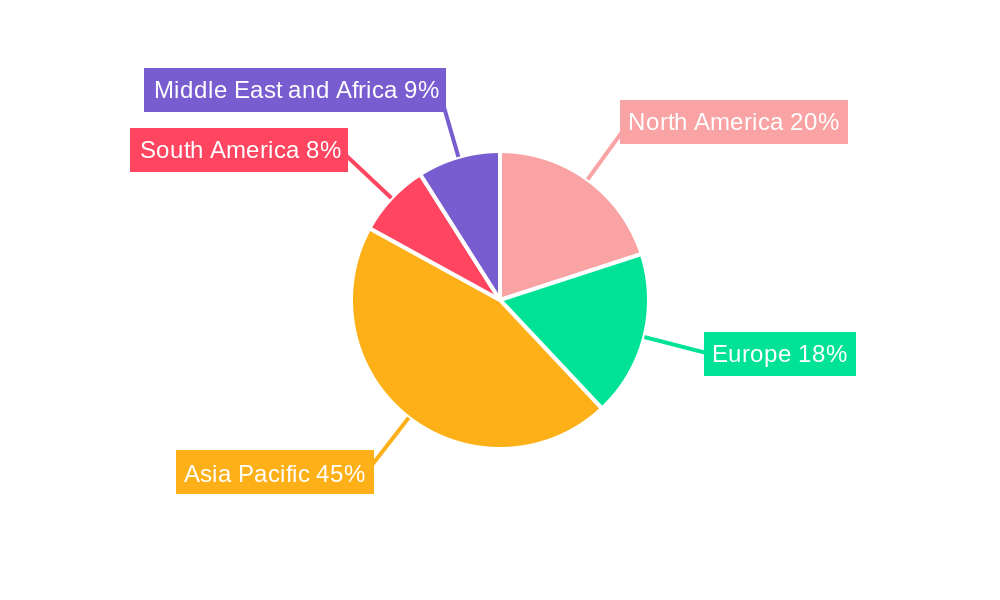
The geographical distribution of the MSG market reveals a significant share held by the Asia-Pacific region, driven by high consumption in countries like China and Japan. North America and Europe also represent substantial markets, with continuous growth potential. South America and the Middle East & Africa are showing promising growth trajectories, driven by rising disposable incomes and increasing urbanization. Further market segmentation reveals strong performance in the meat products segment, fueled by the need for enhanced flavor in processed meat items. The competitive landscape is shaped by established players like Ajinomoto Co Inc, Cargill Incorporated, and Meihua Holdings Group Co Ltd, along with emerging regional players. The forecast period of 2025-2033 presents significant growth opportunities for both existing players and new entrants, with strategic focus required on addressing consumer concerns, innovating product offerings and adapting to evolving market trends.
MSG Market: A Comprehensive Report (2019-2033)
This in-depth report provides a comprehensive analysis of the global MSG market, offering invaluable insights for industry professionals, investors, and strategic decision-makers. With a study period spanning 2019-2033, a base year of 2025, and a forecast period from 2025-2033, this report delivers actionable intelligence to navigate the evolving landscape of the MSG industry. The market reached a value of $XX Million in 2024 and is projected to reach $XX Million by 2033, exhibiting a CAGR of XX% during the forecast period.
MSG Market Market Structure & Innovation Trends
This section analyzes the competitive landscape of the MSG market, examining market concentration, key innovation drivers, regulatory frameworks, prevalent product substitutes, end-user demographics, and significant M&A activities. The report delves into the market share held by major players such as Ajinomoto Co Inc, Cargill Incorporated, and Meihua Holdings Group Co Ltd, quantifying their influence. Furthermore, it assesses the impact of recent M&A deals, with estimated values of transactions exceeding $XX Million impacting market dynamics and competitive positioning. The analysis includes an assessment of:
- Market Concentration: A detailed breakdown of market share distribution among key players, revealing the level of competition and dominance within the industry.
- Innovation Drivers: An exploration of factors driving innovation, including technological advancements, consumer demand for specific functionalities, and regulatory pressures.
- Regulatory Frameworks: A review of relevant regulations and their impact on market growth, including safety standards and labeling requirements.
- Product Substitutes: An evaluation of alternative seasoning options and their impact on MSG market demand.
- End-User Demographics: An analysis of consumer preferences, purchasing behaviors, and geographic distribution influencing market demand.
- M&A Activities: A review of key mergers and acquisitions, examining their impact on market structure and competitive dynamics.
MSG Market Market Dynamics & Trends
This section provides a comprehensive analysis of the factors influencing the dynamics of the MSG market. It explores market growth drivers, technological disruptions impacting production and consumption patterns, evolving consumer preferences, and the intricate competitive dynamics shaping the industry’s trajectory. The report utilizes a robust data-driven approach to illustrate market trends, such as the CAGR and market penetration rate across key segments. The section includes detailed analysis of:
- Market Growth Drivers: A comprehensive exploration of factors contributing to market expansion, including rising global population, changing dietary habits, and increasing demand in key application segments.
- Technological Disruptions: An in-depth analysis of technological advancements influencing production efficiency, product innovation, and supply chain management.
- Consumer Preferences: A detailed assessment of consumer preferences for MSG, including their concerns about health and safety aspects, and how these preferences impact product development and marketing strategies.
- Competitive Dynamics: A rigorous analysis of competitive dynamics, including competitive strategies employed by leading players, pricing strategies, and market positioning.
Dominant Regions & Segments in MSG Market
This section identifies and analyzes the leading regions and segments within the MSG market. Focusing on applications like Noodles, Soups and Broth, Meat Products, Seasonings and Dressings, and Other Applications, the report pinpoints the dominant regions and factors contributing to their leadership. It includes a detailed analysis for each segment and region, highlighting key drivers and constraints.
- Leading Region/Country: [Insert Name of Dominant Region/Country]
- Key Drivers for Dominant Region/Country:
- [Specific Economic Policies, e.g., government subsidies or tax incentives]
- [Infrastructure Development, e.g., improved transportation networks supporting efficient distribution]
- [Other relevant factors, e.g., consumer preferences, cultural factors].
- Dominant Application Segment: [Insert Name of Dominant Application Segment]
- Key Drivers for Dominant Segment:
- [Specific Factors contributing to the segment's dominance, explained in detail]
MSG Market Product Innovations
This section provides a concise overview of recent product developments, highlighting key innovations, application advancements, and the competitive advantages these innovations offer. It will emphasize the technological trends driving product innovation and their alignment with evolving market needs. The section highlights successful new products and innovations impacting market share and growth.
Report Scope & Segmentation Analysis
This report provides a detailed segmentation analysis of the MSG market by application.
- Noodles: [Growth projection, market size, competitive dynamics]
- Soups and Broth: [Growth projection, market size, competitive dynamics]
- Meat Products: [Growth projection, market size, competitive dynamics]
- Seasonings and Dressings: [Growth projection, market size, competitive dynamics]
- Other Applications: [Growth projection, market size, competitive dynamics]
Key Drivers of MSG Market Growth
The growth of the MSG market is driven by several key factors, including:
- Increasing global demand for convenient and flavorful food products.
- Technological advancements leading to improved production efficiency and product quality.
- Favorable economic conditions in key markets fostering increased consumer spending.
- Supportive regulatory frameworks promoting the safe and responsible use of MSG.
Challenges in the MSG Market Sector
The MSG market faces several challenges, including:
- Negative consumer perceptions about MSG's health effects.
- Fluctuations in raw material prices impacting production costs.
- Stringent regulatory requirements impacting production and market entry.
- Intense competition from substitute products.
Emerging Opportunities in MSG Market
The MSG market presents several promising opportunities, including:
- Expanding into new and emerging markets with growing food processing industries.
- Developing innovative MSG-based products catering to health-conscious consumers.
- Leveraging technological advancements to enhance product quality and sustainability.
- Exploring new applications for MSG in the food and beverage industry.
Leading Players in the MSG Market Market
- Ajinomoto Co Inc
- Cargill Incorporated
- Ningxia Eppen Biotech Co Ltd
- Gremount International Company Limited
- Meihua Holdings Group Co Ltd
- Shandong Xinle Monosodium Glutamate Limited Company
- COFCO
- Fufeng Group
- Shandong Qilu Biotechnology Group Co
- Henan Lotus Flower Gourmet Powder Co
Key Developments in MSG Market Industry
- [Insert Key Development 1: Year/Month, Description, Impact]
- [Insert Key Development 2: Year/Month, Description, Impact]
- [Insert Key Development 3: Year/Month, Description, Impact]
Future Outlook for MSG Market Market
The MSG market is poised for continued growth, driven by factors such as increasing global demand, technological advancements, and new product developments. Strategic opportunities exist for companies to expand into new markets, develop innovative products, and optimize their supply chains to enhance profitability and market share. The market is expected to experience significant expansion in the coming years, driven by these factors and the growing global food and beverage industry.
MSG Market Segmentation
-
1. Application
- 1.1. Noodles, Soups and Broth
- 1.2. Meat Products
- 1.3. Seasonings and Dressings
- 1.4. Other Applications
MSG Market Segmentation By Geography
-
1. North America
- 1.1. United States
- 1.2. Canada
- 1.3. Mexico
- 1.4. Rest of North America
-
2. Europe
- 2.1. Germany
- 2.2. United Kingdom
- 2.3. France
- 2.4. Russia
- 2.5. Rest of Europe
-
3. Asia Pacific
- 3.1. China
- 3.2. Japan
- 3.3. India
- 3.4. Australia
- 3.5. Rest of Asia Pacific
-
4. South America
- 4.1. Brazil
- 4.2. Argentina
- 4.3. Rest of South America
-
5. Middle East and Africa
- 5.1. South Africa
- 5.2. United Arab Emirates
- 5.3. Rest of Middle East and Africa
MSG Market REPORT HIGHLIGHTS
| Aspects | Details |
|---|---|
| Study Period | 2019-2033 |
| Base Year | 2024 |
| Estimated Year | 2025 |
| Forecast Period | 2025-2033 |
| Historical Period | 2019-2024 |
| Growth Rate | CAGR of 4.01% from 2019-2033 |
| Segmentation |
|
Table of Contents
- 1. Introduction
- 1.1. Research Scope
- 1.2. Market Segmentation
- 1.3. Research Methodology
- 1.4. Definitions and Assumptions
- 2. Executive Summary
- 2.1. Introduction
- 3. Market Dynamics
- 3.1. Introduction
- 3.2. Market Drivers
- 3.2.1. Consumer inclination toward functional food and beverages; Increasing Number of Applications and Growing Industrial Use
- 3.3. Market Restrains
- 3.3.1. Increasing Shift Toward Plant-Based Protein
- 3.4. Market Trends
- 3.4.1. Rising Demand for Ready -To-Eat and Processed Food
- 4. Market Factor Analysis
- 4.1. Porters Five Forces
- 4.2. Supply/Value Chain
- 4.3. PESTEL analysis
- 4.4. Market Entropy
- 4.5. Patent/Trademark Analysis
- 5. Global MSG Market Analysis, Insights and Forecast, 2019-2031
- 5.1. Market Analysis, Insights and Forecast - by Application
- 5.1.1. Noodles, Soups and Broth
- 5.1.2. Meat Products
- 5.1.3. Seasonings and Dressings
- 5.1.4. Other Applications
- 5.2. Market Analysis, Insights and Forecast - by Region
- 5.2.1. North America
- 5.2.2. Europe
- 5.2.3. Asia Pacific
- 5.2.4. South America
- 5.2.5. Middle East and Africa
- 5.1. Market Analysis, Insights and Forecast - by Application
- 6. North America MSG Market Analysis, Insights and Forecast, 2019-2031
- 6.1. Market Analysis, Insights and Forecast - by Application
- 6.1.1. Noodles, Soups and Broth
- 6.1.2. Meat Products
- 6.1.3. Seasonings and Dressings
- 6.1.4. Other Applications
- 6.1. Market Analysis, Insights and Forecast - by Application
- 7. Europe MSG Market Analysis, Insights and Forecast, 2019-2031
- 7.1. Market Analysis, Insights and Forecast - by Application
- 7.1.1. Noodles, Soups and Broth
- 7.1.2. Meat Products
- 7.1.3. Seasonings and Dressings
- 7.1.4. Other Applications
- 7.1. Market Analysis, Insights and Forecast - by Application
- 8. Asia Pacific MSG Market Analysis, Insights and Forecast, 2019-2031
- 8.1. Market Analysis, Insights and Forecast - by Application
- 8.1.1. Noodles, Soups and Broth
- 8.1.2. Meat Products
- 8.1.3. Seasonings and Dressings
- 8.1.4. Other Applications
- 8.1. Market Analysis, Insights and Forecast - by Application
- 9. South America MSG Market Analysis, Insights and Forecast, 2019-2031
- 9.1. Market Analysis, Insights and Forecast - by Application
- 9.1.1. Noodles, Soups and Broth
- 9.1.2. Meat Products
- 9.1.3. Seasonings and Dressings
- 9.1.4. Other Applications
- 9.1. Market Analysis, Insights and Forecast - by Application
- 10. Middle East and Africa MSG Market Analysis, Insights and Forecast, 2019-2031
- 10.1. Market Analysis, Insights and Forecast - by Application
- 10.1.1. Noodles, Soups and Broth
- 10.1.2. Meat Products
- 10.1.3. Seasonings and Dressings
- 10.1.4. Other Applications
- 10.1. Market Analysis, Insights and Forecast - by Application
- 11. North America MSG Market Analysis, Insights and Forecast, 2019-2031
- 11.1. Market Analysis, Insights and Forecast - By Country/Sub-region
- 11.1.1. undefined
- 12. Europe MSG Market Analysis, Insights and Forecast, 2019-2031
- 12.1. Market Analysis, Insights and Forecast - By Country/Sub-region
- 12.1.1. undefined
- 13. Asia Pacific MSG Market Analysis, Insights and Forecast, 2019-2031
- 13.1. Market Analysis, Insights and Forecast - By Country/Sub-region
- 13.1.1. undefined
- 14. South America MSG Market Analysis, Insights and Forecast, 2019-2031
- 14.1. Market Analysis, Insights and Forecast - By Country/Sub-region
- 14.1.1. undefined
- 15. Middle East and Africa MSG Market Analysis, Insights and Forecast, 2019-2031
- 15.1. Market Analysis, Insights and Forecast - By Country/Sub-region
- 15.1.1. undefined
- 16. Competitive Analysis
- 16.1. Global Market Share Analysis 2024
- 16.2. Company Profiles
- 16.2.1 Gremount International Company Limited
- 16.2.1.1. Overview
- 16.2.1.2. Products
- 16.2.1.3. SWOT Analysis
- 16.2.1.4. Recent Developments
- 16.2.1.5. Financials (Based on Availability)
- 16.2.2 Cargill Incorporated
- 16.2.2.1. Overview
- 16.2.2.2. Products
- 16.2.2.3. SWOT Analysis
- 16.2.2.4. Recent Developments
- 16.2.2.5. Financials (Based on Availability)
- 16.2.3 Ningxia Eppen Biotech Co Ltd
- 16.2.3.1. Overview
- 16.2.3.2. Products
- 16.2.3.3. SWOT Analysis
- 16.2.3.4. Recent Developments
- 16.2.3.5. Financials (Based on Availability)
- 16.2.4 Ajinomoto Co Inc
- 16.2.4.1. Overview
- 16.2.4.2. Products
- 16.2.4.3. SWOT Analysis
- 16.2.4.4. Recent Developments
- 16.2.4.5. Financials (Based on Availability)
- 16.2.5 Meihua Holdings Group Co Ltd
- 16.2.5.1. Overview
- 16.2.5.2. Products
- 16.2.5.3. SWOT Analysis
- 16.2.5.4. Recent Developments
- 16.2.5.5. Financials (Based on Availability)
- 16.2.6 Shandong Xinle Monosodium Glutamate Limited Company*List Not Exhaustive
- 16.2.6.1. Overview
- 16.2.6.2. Products
- 16.2.6.3. SWOT Analysis
- 16.2.6.4. Recent Developments
- 16.2.6.5. Financials (Based on Availability)
- 16.2.7 COFCO
- 16.2.7.1. Overview
- 16.2.7.2. Products
- 16.2.7.3. SWOT Analysis
- 16.2.7.4. Recent Developments
- 16.2.7.5. Financials (Based on Availability)
- 16.2.8 Fufeng Group
- 16.2.8.1. Overview
- 16.2.8.2. Products
- 16.2.8.3. SWOT Analysis
- 16.2.8.4. Recent Developments
- 16.2.8.5. Financials (Based on Availability)
- 16.2.9 Shandong Qilu Biotechnology Group Co
- 16.2.9.1. Overview
- 16.2.9.2. Products
- 16.2.9.3. SWOT Analysis
- 16.2.9.4. Recent Developments
- 16.2.9.5. Financials (Based on Availability)
- 16.2.10 Henan Lotus Flower Gourmet Powder Co
- 16.2.10.1. Overview
- 16.2.10.2. Products
- 16.2.10.3. SWOT Analysis
- 16.2.10.4. Recent Developments
- 16.2.10.5. Financials (Based on Availability)
- 16.2.1 Gremount International Company Limited
List of Figures
- Figure 1: Global MSG Market Revenue Breakdown (Million, %) by Region 2024 & 2032
- Figure 2: Global MSG Market Volume Breakdown (K Tons, %) by Region 2024 & 2032
- Figure 3: North America MSG Market Revenue (Million), by Country 2024 & 2032
- Figure 4: North America MSG Market Volume (K Tons), by Country 2024 & 2032
- Figure 5: North America MSG Market Revenue Share (%), by Country 2024 & 2032
- Figure 6: North America MSG Market Volume Share (%), by Country 2024 & 2032
- Figure 7: Europe MSG Market Revenue (Million), by Country 2024 & 2032
- Figure 8: Europe MSG Market Volume (K Tons), by Country 2024 & 2032
- Figure 9: Europe MSG Market Revenue Share (%), by Country 2024 & 2032
- Figure 10: Europe MSG Market Volume Share (%), by Country 2024 & 2032
- Figure 11: Asia Pacific MSG Market Revenue (Million), by Country 2024 & 2032
- Figure 12: Asia Pacific MSG Market Volume (K Tons), by Country 2024 & 2032
- Figure 13: Asia Pacific MSG Market Revenue Share (%), by Country 2024 & 2032
- Figure 14: Asia Pacific MSG Market Volume Share (%), by Country 2024 & 2032
- Figure 15: South America MSG Market Revenue (Million), by Country 2024 & 2032
- Figure 16: South America MSG Market Volume (K Tons), by Country 2024 & 2032
- Figure 17: South America MSG Market Revenue Share (%), by Country 2024 & 2032
- Figure 18: South America MSG Market Volume Share (%), by Country 2024 & 2032
- Figure 19: Middle East and Africa MSG Market Revenue (Million), by Country 2024 & 2032
- Figure 20: Middle East and Africa MSG Market Volume (K Tons), by Country 2024 & 2032
- Figure 21: Middle East and Africa MSG Market Revenue Share (%), by Country 2024 & 2032
- Figure 22: Middle East and Africa MSG Market Volume Share (%), by Country 2024 & 2032
- Figure 23: North America MSG Market Revenue (Million), by Application 2024 & 2032
- Figure 24: North America MSG Market Volume (K Tons), by Application 2024 & 2032
- Figure 25: North America MSG Market Revenue Share (%), by Application 2024 & 2032
- Figure 26: North America MSG Market Volume Share (%), by Application 2024 & 2032
- Figure 27: North America MSG Market Revenue (Million), by Country 2024 & 2032
- Figure 28: North America MSG Market Volume (K Tons), by Country 2024 & 2032
- Figure 29: North America MSG Market Revenue Share (%), by Country 2024 & 2032
- Figure 30: North America MSG Market Volume Share (%), by Country 2024 & 2032
- Figure 31: Europe MSG Market Revenue (Million), by Application 2024 & 2032
- Figure 32: Europe MSG Market Volume (K Tons), by Application 2024 & 2032
- Figure 33: Europe MSG Market Revenue Share (%), by Application 2024 & 2032
- Figure 34: Europe MSG Market Volume Share (%), by Application 2024 & 2032
- Figure 35: Europe MSG Market Revenue (Million), by Country 2024 & 2032
- Figure 36: Europe MSG Market Volume (K Tons), by Country 2024 & 2032
- Figure 37: Europe MSG Market Revenue Share (%), by Country 2024 & 2032
- Figure 38: Europe MSG Market Volume Share (%), by Country 2024 & 2032
- Figure 39: Asia Pacific MSG Market Revenue (Million), by Application 2024 & 2032
- Figure 40: Asia Pacific MSG Market Volume (K Tons), by Application 2024 & 2032
- Figure 41: Asia Pacific MSG Market Revenue Share (%), by Application 2024 & 2032
- Figure 42: Asia Pacific MSG Market Volume Share (%), by Application 2024 & 2032
- Figure 43: Asia Pacific MSG Market Revenue (Million), by Country 2024 & 2032
- Figure 44: Asia Pacific MSG Market Volume (K Tons), by Country 2024 & 2032
- Figure 45: Asia Pacific MSG Market Revenue Share (%), by Country 2024 & 2032
- Figure 46: Asia Pacific MSG Market Volume Share (%), by Country 2024 & 2032
- Figure 47: South America MSG Market Revenue (Million), by Application 2024 & 2032
- Figure 48: South America MSG Market Volume (K Tons), by Application 2024 & 2032
- Figure 49: South America MSG Market Revenue Share (%), by Application 2024 & 2032
- Figure 50: South America MSG Market Volume Share (%), by Application 2024 & 2032
- Figure 51: South America MSG Market Revenue (Million), by Country 2024 & 2032
- Figure 52: South America MSG Market Volume (K Tons), by Country 2024 & 2032
- Figure 53: South America MSG Market Revenue Share (%), by Country 2024 & 2032
- Figure 54: South America MSG Market Volume Share (%), by Country 2024 & 2032
- Figure 55: Middle East and Africa MSG Market Revenue (Million), by Application 2024 & 2032
- Figure 56: Middle East and Africa MSG Market Volume (K Tons), by Application 2024 & 2032
- Figure 57: Middle East and Africa MSG Market Revenue Share (%), by Application 2024 & 2032
- Figure 58: Middle East and Africa MSG Market Volume Share (%), by Application 2024 & 2032
- Figure 59: Middle East and Africa MSG Market Revenue (Million), by Country 2024 & 2032
- Figure 60: Middle East and Africa MSG Market Volume (K Tons), by Country 2024 & 2032
- Figure 61: Middle East and Africa MSG Market Revenue Share (%), by Country 2024 & 2032
- Figure 62: Middle East and Africa MSG Market Volume Share (%), by Country 2024 & 2032
List of Tables
- Table 1: Global MSG Market Revenue Million Forecast, by Region 2019 & 2032
- Table 2: Global MSG Market Volume K Tons Forecast, by Region 2019 & 2032
- Table 3: Global MSG Market Revenue Million Forecast, by Application 2019 & 2032
- Table 4: Global MSG Market Volume K Tons Forecast, by Application 2019 & 2032
- Table 5: Global MSG Market Revenue Million Forecast, by Region 2019 & 2032
- Table 6: Global MSG Market Volume K Tons Forecast, by Region 2019 & 2032
- Table 7: Global MSG Market Revenue Million Forecast, by Country 2019 & 2032
- Table 8: Global MSG Market Volume K Tons Forecast, by Country 2019 & 2032
- Table 9: Global MSG Market Revenue Million Forecast, by Country 2019 & 2032
- Table 10: Global MSG Market Volume K Tons Forecast, by Country 2019 & 2032
- Table 11: Global MSG Market Revenue Million Forecast, by Country 2019 & 2032
- Table 12: Global MSG Market Volume K Tons Forecast, by Country 2019 & 2032
- Table 13: Global MSG Market Revenue Million Forecast, by Country 2019 & 2032
- Table 14: Global MSG Market Volume K Tons Forecast, by Country 2019 & 2032
- Table 15: Global MSG Market Revenue Million Forecast, by Country 2019 & 2032
- Table 16: Global MSG Market Volume K Tons Forecast, by Country 2019 & 2032
- Table 17: Global MSG Market Revenue Million Forecast, by Application 2019 & 2032
- Table 18: Global MSG Market Volume K Tons Forecast, by Application 2019 & 2032
- Table 19: Global MSG Market Revenue Million Forecast, by Country 2019 & 2032
- Table 20: Global MSG Market Volume K Tons Forecast, by Country 2019 & 2032
- Table 21: United States MSG Market Revenue (Million) Forecast, by Application 2019 & 2032
- Table 22: United States MSG Market Volume (K Tons) Forecast, by Application 2019 & 2032
- Table 23: Canada MSG Market Revenue (Million) Forecast, by Application 2019 & 2032
- Table 24: Canada MSG Market Volume (K Tons) Forecast, by Application 2019 & 2032
- Table 25: Mexico MSG Market Revenue (Million) Forecast, by Application 2019 & 2032
- Table 26: Mexico MSG Market Volume (K Tons) Forecast, by Application 2019 & 2032
- Table 27: Rest of North America MSG Market Revenue (Million) Forecast, by Application 2019 & 2032
- Table 28: Rest of North America MSG Market Volume (K Tons) Forecast, by Application 2019 & 2032
- Table 29: Global MSG Market Revenue Million Forecast, by Application 2019 & 2032
- Table 30: Global MSG Market Volume K Tons Forecast, by Application 2019 & 2032
- Table 31: Global MSG Market Revenue Million Forecast, by Country 2019 & 2032
- Table 32: Global MSG Market Volume K Tons Forecast, by Country 2019 & 2032
- Table 33: Germany MSG Market Revenue (Million) Forecast, by Application 2019 & 2032
- Table 34: Germany MSG Market Volume (K Tons) Forecast, by Application 2019 & 2032
- Table 35: United Kingdom MSG Market Revenue (Million) Forecast, by Application 2019 & 2032
- Table 36: United Kingdom MSG Market Volume (K Tons) Forecast, by Application 2019 & 2032
- Table 37: France MSG Market Revenue (Million) Forecast, by Application 2019 & 2032
- Table 38: France MSG Market Volume (K Tons) Forecast, by Application 2019 & 2032
- Table 39: Russia MSG Market Revenue (Million) Forecast, by Application 2019 & 2032
- Table 40: Russia MSG Market Volume (K Tons) Forecast, by Application 2019 & 2032
- Table 41: Rest of Europe MSG Market Revenue (Million) Forecast, by Application 2019 & 2032
- Table 42: Rest of Europe MSG Market Volume (K Tons) Forecast, by Application 2019 & 2032
- Table 43: Global MSG Market Revenue Million Forecast, by Application 2019 & 2032
- Table 44: Global MSG Market Volume K Tons Forecast, by Application 2019 & 2032
- Table 45: Global MSG Market Revenue Million Forecast, by Country 2019 & 2032
- Table 46: Global MSG Market Volume K Tons Forecast, by Country 2019 & 2032
- Table 47: China MSG Market Revenue (Million) Forecast, by Application 2019 & 2032
- Table 48: China MSG Market Volume (K Tons) Forecast, by Application 2019 & 2032
- Table 49: Japan MSG Market Revenue (Million) Forecast, by Application 2019 & 2032
- Table 50: Japan MSG Market Volume (K Tons) Forecast, by Application 2019 & 2032
- Table 51: India MSG Market Revenue (Million) Forecast, by Application 2019 & 2032
- Table 52: India MSG Market Volume (K Tons) Forecast, by Application 2019 & 2032
- Table 53: Australia MSG Market Revenue (Million) Forecast, by Application 2019 & 2032
- Table 54: Australia MSG Market Volume (K Tons) Forecast, by Application 2019 & 2032
- Table 55: Rest of Asia Pacific MSG Market Revenue (Million) Forecast, by Application 2019 & 2032
- Table 56: Rest of Asia Pacific MSG Market Volume (K Tons) Forecast, by Application 2019 & 2032
- Table 57: Global MSG Market Revenue Million Forecast, by Application 2019 & 2032
- Table 58: Global MSG Market Volume K Tons Forecast, by Application 2019 & 2032
- Table 59: Global MSG Market Revenue Million Forecast, by Country 2019 & 2032
- Table 60: Global MSG Market Volume K Tons Forecast, by Country 2019 & 2032
- Table 61: Brazil MSG Market Revenue (Million) Forecast, by Application 2019 & 2032
- Table 62: Brazil MSG Market Volume (K Tons) Forecast, by Application 2019 & 2032
- Table 63: Argentina MSG Market Revenue (Million) Forecast, by Application 2019 & 2032
- Table 64: Argentina MSG Market Volume (K Tons) Forecast, by Application 2019 & 2032
- Table 65: Rest of South America MSG Market Revenue (Million) Forecast, by Application 2019 & 2032
- Table 66: Rest of South America MSG Market Volume (K Tons) Forecast, by Application 2019 & 2032
- Table 67: Global MSG Market Revenue Million Forecast, by Application 2019 & 2032
- Table 68: Global MSG Market Volume K Tons Forecast, by Application 2019 & 2032
- Table 69: Global MSG Market Revenue Million Forecast, by Country 2019 & 2032
- Table 70: Global MSG Market Volume K Tons Forecast, by Country 2019 & 2032
- Table 71: South Africa MSG Market Revenue (Million) Forecast, by Application 2019 & 2032
- Table 72: South Africa MSG Market Volume (K Tons) Forecast, by Application 2019 & 2032
- Table 73: United Arab Emirates MSG Market Revenue (Million) Forecast, by Application 2019 & 2032
- Table 74: United Arab Emirates MSG Market Volume (K Tons) Forecast, by Application 2019 & 2032
- Table 75: Rest of Middle East and Africa MSG Market Revenue (Million) Forecast, by Application 2019 & 2032
- Table 76: Rest of Middle East and Africa MSG Market Volume (K Tons) Forecast, by Application 2019 & 2032
Frequently Asked Questions
1. What is the projected Compound Annual Growth Rate (CAGR) of the MSG Market?
The projected CAGR is approximately 4.01%.
2. Which companies are prominent players in the MSG Market?
Key companies in the market include Gremount International Company Limited, Cargill Incorporated, Ningxia Eppen Biotech Co Ltd, Ajinomoto Co Inc, Meihua Holdings Group Co Ltd, Shandong Xinle Monosodium Glutamate Limited Company*List Not Exhaustive, COFCO, Fufeng Group, Shandong Qilu Biotechnology Group Co, Henan Lotus Flower Gourmet Powder Co.
3. What are the main segments of the MSG Market?
The market segments include Application.
4. Can you provide details about the market size?
The market size is estimated to be USD 6.15 Million as of 2022.
5. What are some drivers contributing to market growth?
Consumer inclination toward functional food and beverages; Increasing Number of Applications and Growing Industrial Use.
6. What are the notable trends driving market growth?
Rising Demand for Ready -To-Eat and Processed Food.
7. Are there any restraints impacting market growth?
Increasing Shift Toward Plant-Based Protein.
8. Can you provide examples of recent developments in the market?
N/A
9. What pricing options are available for accessing the report?
Pricing options include single-user, multi-user, and enterprise licenses priced at USD 4750, USD 5250, and USD 8750 respectively.
10. Is the market size provided in terms of value or volume?
The market size is provided in terms of value, measured in Million and volume, measured in K Tons.
11. Are there any specific market keywords associated with the report?
Yes, the market keyword associated with the report is "MSG Market," which aids in identifying and referencing the specific market segment covered.
12. How do I determine which pricing option suits my needs best?
The pricing options vary based on user requirements and access needs. Individual users may opt for single-user licenses, while businesses requiring broader access may choose multi-user or enterprise licenses for cost-effective access to the report.
13. Are there any additional resources or data provided in the MSG Market report?
While the report offers comprehensive insights, it's advisable to review the specific contents or supplementary materials provided to ascertain if additional resources or data are available.
14. How can I stay updated on further developments or reports in the MSG Market?
To stay informed about further developments, trends, and reports in the MSG Market, consider subscribing to industry newsletters, following relevant companies and organizations, or regularly checking reputable industry news sources and publications.
Methodology
Step 1 - Identification of Relevant Samples Size from Population Database


Step 2 - Approaches for Defining Global Market Size (Value, Volume* & Price*)

Note*: In applicable scenarios
Step 3 - Data Sources
Primary Research
- Web Analytics
- Survey Reports
- Research Institute
- Latest Research Reports
- Opinion Leaders
Secondary Research
- Annual Reports
- White Paper
- Latest Press Release
- Industry Association
- Paid Database
- Investor Presentations

Step 4 - Data Triangulation
Involves using different sources of information in order to increase the validity of a study
These sources are likely to be stakeholders in a program - participants, other researchers, program staff, other community members, and so on.
Then we put all data in single framework & apply various statistical tools to find out the dynamic on the market.
During the analysis stage, feedback from the stakeholder groups would be compared to determine areas of agreement as well as areas of divergence


