
Key Insights
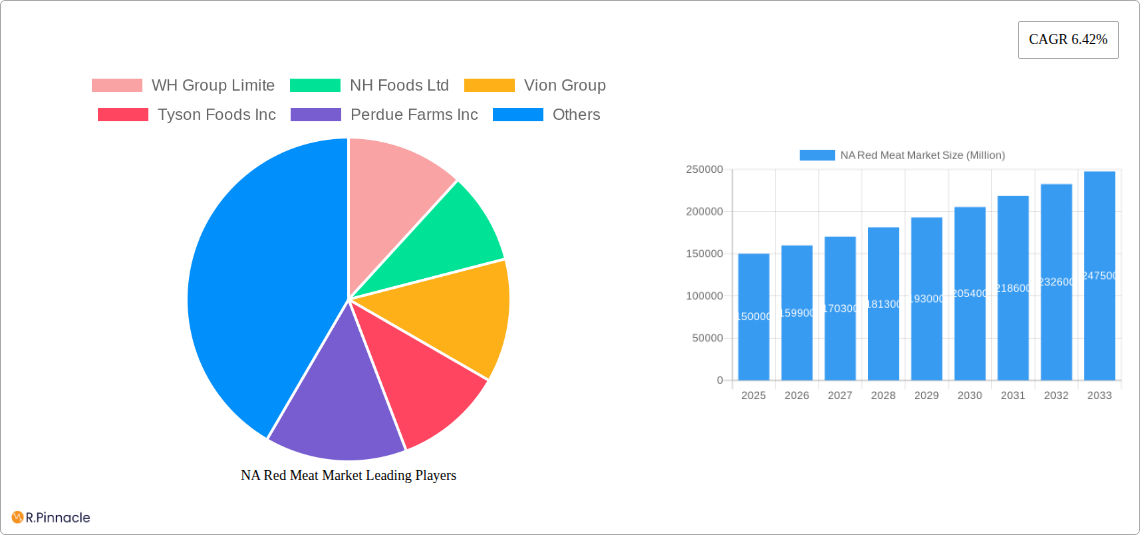
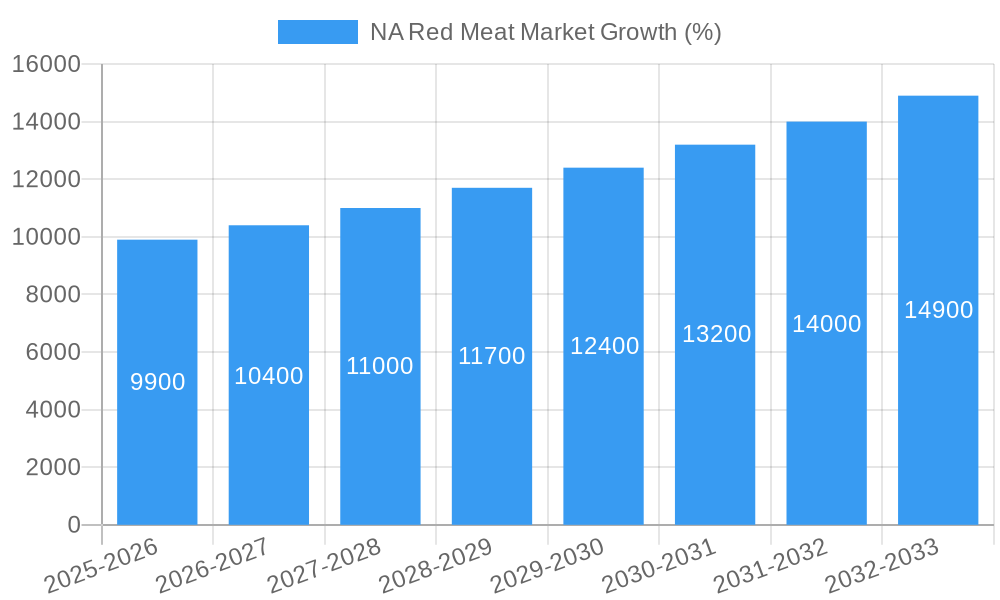
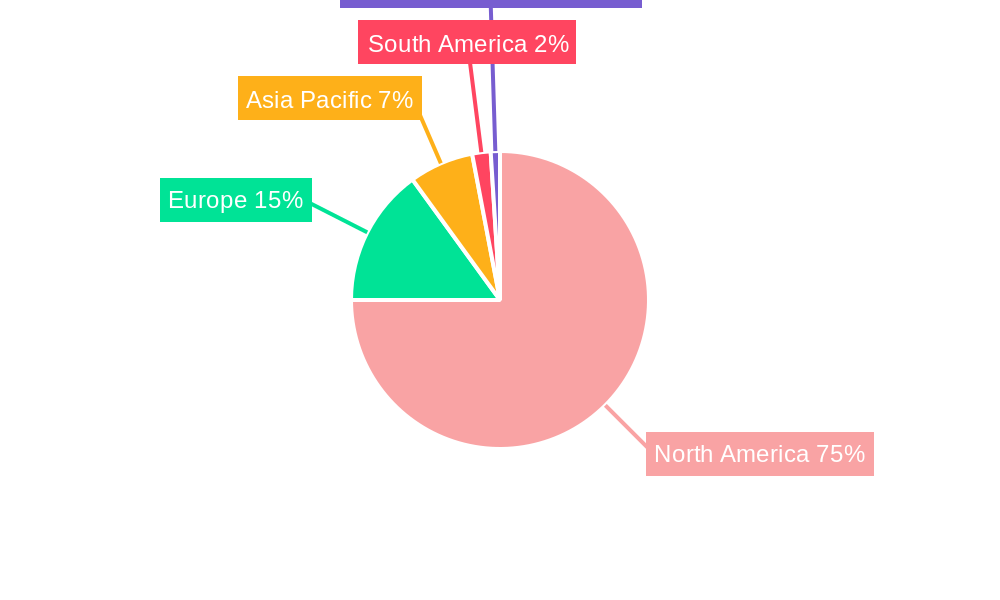
The North American red meat market, encompassing beef, pork, and mutton, presents a compelling investment landscape. Fueled by consistent consumer demand, particularly in the United States and Canada, the market exhibits a robust Compound Annual Growth Rate (CAGR) of 6.42% from 2019-2033. This growth is driven by several key factors. Increasing disposable incomes across the region are leading to higher spending on protein-rich diets, including red meat. The flourishing food service industry, encompassing both quick-service restaurants and upscale dining establishments, further stimulates demand. While consumer health consciousness and concerns about the environmental impact of meat production represent potential restraints, ongoing industry innovation in sustainable farming practices and leaner meat options are mitigating these concerns. The market is segmented by form (canned, fresh/chilled, frozen, processed), type (beef, mutton, pork, other), and distribution channel (off-trade, on-trade). The processed segment, encompassing products like sausages and bacon, shows particularly strong growth due to convenience and versatility. The dominance of beef within the type segment reflects established cultural preferences, while pork enjoys significant popularity, especially in processed forms. Major players like Tyson Foods, JBS SA, and Cargill Inc. leverage their extensive distribution networks and brand recognition to capture significant market share. Regional variations exist, with the United States accounting for the largest share due to its vast population and high per capita meat consumption. Canada and Mexico contribute significantly, albeit at a smaller scale, with diverse consumption patterns reflected in their respective market segments.
Looking ahead, the North American red meat market anticipates continued expansion, albeit with some nuances. The growing popularity of plant-based alternatives necessitates ongoing innovation from traditional red meat producers to maintain market share. This involves introducing healthier options, emphasizing sustainability, and enhancing the overall consumer experience. Strategic partnerships, mergers, and acquisitions are expected amongst major players to enhance their competitive edge and expand their reach. Furthermore, government policies related to food safety, animal welfare, and environmental regulations will influence the growth trajectory of the market. The robust demand coupled with innovative strategies suggests a healthy forecast for the North American red meat sector over the coming years.
North American Red Meat Market Report: 2019-2033
This comprehensive report provides a detailed analysis of the North American red meat market, offering invaluable insights for industry professionals, investors, and stakeholders. Covering the period from 2019 to 2033, with a focus on 2025, this report unveils the market's structure, dynamics, and future outlook. The report leverages extensive data and analysis to forecast market growth and identify key opportunities. The market is valued at xx Million in 2025 and is projected to reach xx Million by 2033, exhibiting a CAGR of xx%.
NA Red Meat Market Market Structure & Innovation Trends
This section analyzes the competitive landscape of the North American red meat market, encompassing market concentration, innovation drivers, regulatory frameworks, product substitutes, end-user demographics, and mergers and acquisitions (M&A) activities. The market is characterized by a relatively high level of concentration, with key players such as JBS SA, Tyson Foods Inc, and Cargill Inc holding significant market share. The estimated combined market share of the top 5 players in 2025 is xx%.
- Market Concentration: High, with top players controlling a significant portion of the market.
- Innovation Drivers: Growing demand for convenient, value-added red meat products, technological advancements in processing and packaging, and increasing consumer awareness of health and sustainability.
- Regulatory Frameworks: Stringent food safety regulations and labeling requirements impacting operational costs and market access.
- Product Substitutes: Plant-based meat alternatives posing a competitive challenge, albeit with a comparatively lower market share currently.
- End-User Demographics: Shifting consumer preferences towards healthier and more sustainably produced red meat are driving innovation.
- M&A Activities: Significant M&A activity observed in recent years, with deal values exceeding xx Million in the past five years, reflecting consolidation and expansion strategies. Examples include JBS's acquisition of TriOak Foods assets.
NA Red Meat Market Market Dynamics & Trends
This section delves into the market's growth drivers, technological disruptions, consumer preferences, and competitive dynamics. The market is experiencing dynamic shifts driven by factors such as evolving consumer preferences, technological advancements, and regulatory changes. Key growth drivers include increasing per capita consumption in certain segments, rising disposable incomes, and the growing popularity of convenient, ready-to-eat red meat products.
The market has experienced a significant shift towards healthier and more sustainable options, with a growing preference for grass-fed beef and ethically sourced products. This is driving innovation in processing techniques and packaging solutions. Technological advancements in automation and precision farming are improving efficiency and sustainability. Competitive dynamics are marked by fierce rivalry among large multinational corporations, coupled with increasing pressure from emerging smaller players specializing in niche markets (e.g., organic and grass-fed). The market penetration rate for value-added red meat products is currently at xx% and projected to grow to xx% by 2033.
Dominant Regions & Segments in NA Red Meat Market
This section identifies the leading regions, countries, and segments within the North American red meat market. Based on our analysis, the United States represents the dominant market, driven by factors such as high per capita consumption and a robust food processing industry. Within segments:
- Form: Fresh/Chilled remains the largest segment, followed by Processed and Frozen, with Canned holding the smallest market share. The growth of the processed segment is mainly fueled by the increasing demand for convenience food products.
- Type: Beef dominates the market, followed by Pork and Other Meat, with Mutton possessing a relatively smaller market share. Factors driving beef dominance include consistent consumer demand and widespread availability.
- Distribution Channel: Off-Trade (retail) remains the largest channel, with a gradual increase observed in the On-Trade (foodservice) segment, driven by the growth of the restaurant industry.
Key Drivers for US Dominance:
- Strong consumer demand for red meat.
- Large and well-established food processing industry.
- Extensive distribution network.
- Favorable regulatory environment (relative to other regions).
NA Red Meat Market Product Innovations
The North American red meat market is witnessing significant product innovation, driven by consumer demand for healthier, more convenient, and sustainably produced products. New product development focuses on value-added offerings, including marinated meats, ready-to-cook meals, and organic options. Technological advancements in packaging and preservation are extending shelf life and improving product quality. These innovations are enhancing market competitiveness and expanding consumer choices.
Report Scope & Segmentation Analysis
This report provides a comprehensive segmentation of the North American red meat market based on form (Canned, Fresh/Chilled, Frozen, Processed), type (Beef, Mutton, Pork, Other Meat), and distribution channel (Off-Trade, On-Trade). Each segment is analyzed in terms of its market size, growth projections, and competitive dynamics. The report projects significant growth across all segments, with the processed segment demonstrating the fastest growth rate due to the increasing demand for convenient food products. Competitive dynamics vary across segments, with intense competition among large players in the Fresh/Chilled and Processed segments.
Key Drivers of NA Red Meat Market Growth
The North American red meat market's growth is driven by a confluence of factors. Increasing consumer disposable incomes fuel demand for higher-quality red meat products. The expansion of food service industries, particularly quick-service restaurants, boosts consumption of processed and convenient red meat options. Technological advancements are improving processing efficiency and product shelf life. Government policies supporting the agriculture sector also contribute to market growth.
Challenges in the NA Red Meat Market Sector
The NA red meat market faces several challenges. Fluctuating raw material prices and supply chain disruptions impact profitability and market stability. Increasing consumer awareness of health and environmental concerns puts pressure on producers to adopt sustainable and ethical practices. Stringent regulations regarding food safety and labeling increase compliance costs. Intense competition amongst large corporations and the rise of plant-based alternatives pose further challenges.
Emerging Opportunities in NA Red Meat Market
Emerging opportunities lie in the growing demand for premium and specialty red meat products, such as organic, grass-fed, and naturally raised options. The increasing popularity of convenient ready-to-eat meals and value-added products offers significant growth potential. Expanding into new markets and utilizing technology to enhance efficiency and sustainability represent key opportunities for market players. Furthermore, exploring innovative packaging solutions that extend product shelf-life and maintain quality offers considerable potential.
Leading Players in the NA Red Meat Market Market
- WH Group Limited
- NH Foods Ltd
- Vion Group
- Tyson Foods Inc
- Perdue Farms Inc
- Conagra Brands Inc
- Sysco Corporation
- The Kraft Heinz Company
- Hormel Foods Corporation
- Cargill Inc
- Marfrig Global Foods S A
- The Clemens Family Corporation
- JBS SA
- OSI Group
Key Developments in NA Red Meat Market Industry
- November 2022: Conagra Brands, Inc. announced a USD 60 Million investment to expand its Troy, Ohio facility, increasing production capacity for Slim Jim products.
- December 2022: JBS acquired certain assets from TriOak Foods, enhancing its supply chain control.
- April 2023: JBS USA's Swift Prepared Food launched Principe Foods, producing high-quality Italian meats and charcuterie.
Future Outlook for NA Red Meat Market Market
The North American red meat market is poised for continued growth, driven by evolving consumer preferences and technological advancements. The increasing demand for convenient, value-added products and the growing focus on sustainability will shape future market dynamics. Strategic partnerships, investments in innovation, and a commitment to sustainable practices will be critical for success in this dynamic market.
NA Red Meat Market Segmentation
-
1. Type
- 1.1. Beef
- 1.2. Mutton
- 1.3. Pork
- 1.4. Other Meat
-
2. Form
- 2.1. Canned
- 2.2. Fresh / Chilled
- 2.3. Frozen
- 2.4. Processed
-
3. Distribution Channel
-
3.1. Off-Trade
- 3.1.1. Convenience Stores
- 3.1.2. Online Channel
- 3.1.3. Supermarkets and Hypermarkets
- 3.1.4. Others
- 3.2. On-Trade
-
3.1. Off-Trade
NA Red Meat Market Segmentation By Geography
-
1. North America
- 1.1. United States
- 1.2. Canada
- 1.3. Mexico
-
2. South America
- 2.1. Brazil
- 2.2. Argentina
- 2.3. Rest of South America
-
3. Europe
- 3.1. United Kingdom
- 3.2. Germany
- 3.3. France
- 3.4. Italy
- 3.5. Spain
- 3.6. Russia
- 3.7. Benelux
- 3.8. Nordics
- 3.9. Rest of Europe
-
4. Middle East & Africa
- 4.1. Turkey
- 4.2. Israel
- 4.3. GCC
- 4.4. North Africa
- 4.5. South Africa
- 4.6. Rest of Middle East & Africa
-
5. Asia Pacific
- 5.1. China
- 5.2. India
- 5.3. Japan
- 5.4. South Korea
- 5.5. ASEAN
- 5.6. Oceania
- 5.7. Rest of Asia Pacific
NA Red Meat Market REPORT HIGHLIGHTS
| Aspects | Details |
|---|---|
| Study Period | 2019-2033 |
| Base Year | 2024 |
| Estimated Year | 2025 |
| Forecast Period | 2025-2033 |
| Historical Period | 2019-2024 |
| Growth Rate | CAGR of 6.42% from 2019-2033 |
| Segmentation |
|
Table of Contents
- 1. Introduction
- 1.1. Research Scope
- 1.2. Market Segmentation
- 1.3. Research Methodology
- 1.4. Definitions and Assumptions
- 2. Executive Summary
- 2.1. Introduction
- 3. Market Dynamics
- 3.1. Introduction
- 3.2. Market Drivers
- 3.2.1. Increasing Demand for Low-Fat and Low-Calorie Food; Increasing Product Innovation
- 3.3. Market Restrains
- 3.3.1. ; Threat of New Entrants; Bargaining Power of Buyers/Consumers; Bargaining Power of Suppliers; Threat of Substitute Products; Degree Of Competition
- 3.4. Market Trends
- 3.4.1. OTHER KEY INDUSTRY TRENDS COVERED IN THE REPORT
- 4. Market Factor Analysis
- 4.1. Porters Five Forces
- 4.2. Supply/Value Chain
- 4.3. PESTEL analysis
- 4.4. Market Entropy
- 4.5. Patent/Trademark Analysis
- 5. Global NA Red Meat Market Analysis, Insights and Forecast, 2019-2031
- 5.1. Market Analysis, Insights and Forecast - by Type
- 5.1.1. Beef
- 5.1.2. Mutton
- 5.1.3. Pork
- 5.1.4. Other Meat
- 5.2. Market Analysis, Insights and Forecast - by Form
- 5.2.1. Canned
- 5.2.2. Fresh / Chilled
- 5.2.3. Frozen
- 5.2.4. Processed
- 5.3. Market Analysis, Insights and Forecast - by Distribution Channel
- 5.3.1. Off-Trade
- 5.3.1.1. Convenience Stores
- 5.3.1.2. Online Channel
- 5.3.1.3. Supermarkets and Hypermarkets
- 5.3.1.4. Others
- 5.3.2. On-Trade
- 5.3.1. Off-Trade
- 5.4. Market Analysis, Insights and Forecast - by Region
- 5.4.1. North America
- 5.4.2. South America
- 5.4.3. Europe
- 5.4.4. Middle East & Africa
- 5.4.5. Asia Pacific
- 5.1. Market Analysis, Insights and Forecast - by Type
- 6. North America NA Red Meat Market Analysis, Insights and Forecast, 2019-2031
- 6.1. Market Analysis, Insights and Forecast - by Type
- 6.1.1. Beef
- 6.1.2. Mutton
- 6.1.3. Pork
- 6.1.4. Other Meat
- 6.2. Market Analysis, Insights and Forecast - by Form
- 6.2.1. Canned
- 6.2.2. Fresh / Chilled
- 6.2.3. Frozen
- 6.2.4. Processed
- 6.3. Market Analysis, Insights and Forecast - by Distribution Channel
- 6.3.1. Off-Trade
- 6.3.1.1. Convenience Stores
- 6.3.1.2. Online Channel
- 6.3.1.3. Supermarkets and Hypermarkets
- 6.3.1.4. Others
- 6.3.2. On-Trade
- 6.3.1. Off-Trade
- 6.1. Market Analysis, Insights and Forecast - by Type
- 7. South America NA Red Meat Market Analysis, Insights and Forecast, 2019-2031
- 7.1. Market Analysis, Insights and Forecast - by Type
- 7.1.1. Beef
- 7.1.2. Mutton
- 7.1.3. Pork
- 7.1.4. Other Meat
- 7.2. Market Analysis, Insights and Forecast - by Form
- 7.2.1. Canned
- 7.2.2. Fresh / Chilled
- 7.2.3. Frozen
- 7.2.4. Processed
- 7.3. Market Analysis, Insights and Forecast - by Distribution Channel
- 7.3.1. Off-Trade
- 7.3.1.1. Convenience Stores
- 7.3.1.2. Online Channel
- 7.3.1.3. Supermarkets and Hypermarkets
- 7.3.1.4. Others
- 7.3.2. On-Trade
- 7.3.1. Off-Trade
- 7.1. Market Analysis, Insights and Forecast - by Type
- 8. Europe NA Red Meat Market Analysis, Insights and Forecast, 2019-2031
- 8.1. Market Analysis, Insights and Forecast - by Type
- 8.1.1. Beef
- 8.1.2. Mutton
- 8.1.3. Pork
- 8.1.4. Other Meat
- 8.2. Market Analysis, Insights and Forecast - by Form
- 8.2.1. Canned
- 8.2.2. Fresh / Chilled
- 8.2.3. Frozen
- 8.2.4. Processed
- 8.3. Market Analysis, Insights and Forecast - by Distribution Channel
- 8.3.1. Off-Trade
- 8.3.1.1. Convenience Stores
- 8.3.1.2. Online Channel
- 8.3.1.3. Supermarkets and Hypermarkets
- 8.3.1.4. Others
- 8.3.2. On-Trade
- 8.3.1. Off-Trade
- 8.1. Market Analysis, Insights and Forecast - by Type
- 9. Middle East & Africa NA Red Meat Market Analysis, Insights and Forecast, 2019-2031
- 9.1. Market Analysis, Insights and Forecast - by Type
- 9.1.1. Beef
- 9.1.2. Mutton
- 9.1.3. Pork
- 9.1.4. Other Meat
- 9.2. Market Analysis, Insights and Forecast - by Form
- 9.2.1. Canned
- 9.2.2. Fresh / Chilled
- 9.2.3. Frozen
- 9.2.4. Processed
- 9.3. Market Analysis, Insights and Forecast - by Distribution Channel
- 9.3.1. Off-Trade
- 9.3.1.1. Convenience Stores
- 9.3.1.2. Online Channel
- 9.3.1.3. Supermarkets and Hypermarkets
- 9.3.1.4. Others
- 9.3.2. On-Trade
- 9.3.1. Off-Trade
- 9.1. Market Analysis, Insights and Forecast - by Type
- 10. Asia Pacific NA Red Meat Market Analysis, Insights and Forecast, 2019-2031
- 10.1. Market Analysis, Insights and Forecast - by Type
- 10.1.1. Beef
- 10.1.2. Mutton
- 10.1.3. Pork
- 10.1.4. Other Meat
- 10.2. Market Analysis, Insights and Forecast - by Form
- 10.2.1. Canned
- 10.2.2. Fresh / Chilled
- 10.2.3. Frozen
- 10.2.4. Processed
- 10.3. Market Analysis, Insights and Forecast - by Distribution Channel
- 10.3.1. Off-Trade
- 10.3.1.1. Convenience Stores
- 10.3.1.2. Online Channel
- 10.3.1.3. Supermarkets and Hypermarkets
- 10.3.1.4. Others
- 10.3.2. On-Trade
- 10.3.1. Off-Trade
- 10.1. Market Analysis, Insights and Forecast - by Type
- 11. North America NA Red Meat Market Analysis, Insights and Forecast, 2019-2031
- 11.1. Market Analysis, Insights and Forecast - By Country/Sub-region
- 11.1.1 United States
- 11.1.2 Canada
- 11.1.3 Mexico
- 11.1.4 Rest of North America
- 12. Europe NA Red Meat Market Analysis, Insights and Forecast, 2019-2031
- 12.1. Market Analysis, Insights and Forecast - By Country/Sub-region
- 12.1.1 Spain
- 12.1.2 United Kingdom
- 12.1.3 Germany
- 12.1.4 France
- 12.1.5 Italy
- 12.1.6 Russia
- 12.1.7 Rest of Europe
- 13. Asia Pacific NA Red Meat Market Analysis, Insights and Forecast, 2019-2031
- 13.1. Market Analysis, Insights and Forecast - By Country/Sub-region
- 13.1.1 China
- 13.1.2 Japan
- 13.1.3 India
- 13.1.4 Australia
- 13.1.5 Rest of Asia Pacific
- 14. South America NA Red Meat Market Analysis, Insights and Forecast, 2019-2031
- 14.1. Market Analysis, Insights and Forecast - By Country/Sub-region
- 14.1.1 Brazil
- 14.1.2 Argentina
- 14.1.3 Rest of South America
- 15. Middle East and Africa NA Red Meat Market Analysis, Insights and Forecast, 2019-2031
- 15.1. Market Analysis, Insights and Forecast - By Country/Sub-region
- 15.1.1 South Africa
- 15.1.2 United Arab Emirates
- 15.1.3 Rest of Middle East and Africa
- 16. Competitive Analysis
- 16.1. Global Market Share Analysis 2024
- 16.2. Company Profiles
- 16.2.1 WH Group Limite
- 16.2.1.1. Overview
- 16.2.1.2. Products
- 16.2.1.3. SWOT Analysis
- 16.2.1.4. Recent Developments
- 16.2.1.5. Financials (Based on Availability)
- 16.2.2 NH Foods Ltd
- 16.2.2.1. Overview
- 16.2.2.2. Products
- 16.2.2.3. SWOT Analysis
- 16.2.2.4. Recent Developments
- 16.2.2.5. Financials (Based on Availability)
- 16.2.3 Vion Group
- 16.2.3.1. Overview
- 16.2.3.2. Products
- 16.2.3.3. SWOT Analysis
- 16.2.3.4. Recent Developments
- 16.2.3.5. Financials (Based on Availability)
- 16.2.4 Tyson Foods Inc
- 16.2.4.1. Overview
- 16.2.4.2. Products
- 16.2.4.3. SWOT Analysis
- 16.2.4.4. Recent Developments
- 16.2.4.5. Financials (Based on Availability)
- 16.2.5 Perdue Farms Inc
- 16.2.5.1. Overview
- 16.2.5.2. Products
- 16.2.5.3. SWOT Analysis
- 16.2.5.4. Recent Developments
- 16.2.5.5. Financials (Based on Availability)
- 16.2.6 Conagra Brands Inc
- 16.2.6.1. Overview
- 16.2.6.2. Products
- 16.2.6.3. SWOT Analysis
- 16.2.6.4. Recent Developments
- 16.2.6.5. Financials (Based on Availability)
- 16.2.7 Sysco Corporation
- 16.2.7.1. Overview
- 16.2.7.2. Products
- 16.2.7.3. SWOT Analysis
- 16.2.7.4. Recent Developments
- 16.2.7.5. Financials (Based on Availability)
- 16.2.8 The Kraft Heinz Company
- 16.2.8.1. Overview
- 16.2.8.2. Products
- 16.2.8.3. SWOT Analysis
- 16.2.8.4. Recent Developments
- 16.2.8.5. Financials (Based on Availability)
- 16.2.9 Hormel Foods Corporation
- 16.2.9.1. Overview
- 16.2.9.2. Products
- 16.2.9.3. SWOT Analysis
- 16.2.9.4. Recent Developments
- 16.2.9.5. Financials (Based on Availability)
- 16.2.10 Cargill Inc
- 16.2.10.1. Overview
- 16.2.10.2. Products
- 16.2.10.3. SWOT Analysis
- 16.2.10.4. Recent Developments
- 16.2.10.5. Financials (Based on Availability)
- 16.2.11 Marfrig Global Foods S A
- 16.2.11.1. Overview
- 16.2.11.2. Products
- 16.2.11.3. SWOT Analysis
- 16.2.11.4. Recent Developments
- 16.2.11.5. Financials (Based on Availability)
- 16.2.12 The Clemens Family Corporation
- 16.2.12.1. Overview
- 16.2.12.2. Products
- 16.2.12.3. SWOT Analysis
- 16.2.12.4. Recent Developments
- 16.2.12.5. Financials (Based on Availability)
- 16.2.13 JBS SA
- 16.2.13.1. Overview
- 16.2.13.2. Products
- 16.2.13.3. SWOT Analysis
- 16.2.13.4. Recent Developments
- 16.2.13.5. Financials (Based on Availability)
- 16.2.14 OSI Group
- 16.2.14.1. Overview
- 16.2.14.2. Products
- 16.2.14.3. SWOT Analysis
- 16.2.14.4. Recent Developments
- 16.2.14.5. Financials (Based on Availability)
- 16.2.1 WH Group Limite
List of Figures
- Figure 1: Global NA Red Meat Market Revenue Breakdown (Million, %) by Region 2024 & 2032
- Figure 2: North America NA Red Meat Market Revenue (Million), by Country 2024 & 2032
- Figure 3: North America NA Red Meat Market Revenue Share (%), by Country 2024 & 2032
- Figure 4: Europe NA Red Meat Market Revenue (Million), by Country 2024 & 2032
- Figure 5: Europe NA Red Meat Market Revenue Share (%), by Country 2024 & 2032
- Figure 6: Asia Pacific NA Red Meat Market Revenue (Million), by Country 2024 & 2032
- Figure 7: Asia Pacific NA Red Meat Market Revenue Share (%), by Country 2024 & 2032
- Figure 8: South America NA Red Meat Market Revenue (Million), by Country 2024 & 2032
- Figure 9: South America NA Red Meat Market Revenue Share (%), by Country 2024 & 2032
- Figure 10: Middle East and Africa NA Red Meat Market Revenue (Million), by Country 2024 & 2032
- Figure 11: Middle East and Africa NA Red Meat Market Revenue Share (%), by Country 2024 & 2032
- Figure 12: North America NA Red Meat Market Revenue (Million), by Type 2024 & 2032
- Figure 13: North America NA Red Meat Market Revenue Share (%), by Type 2024 & 2032
- Figure 14: North America NA Red Meat Market Revenue (Million), by Form 2024 & 2032
- Figure 15: North America NA Red Meat Market Revenue Share (%), by Form 2024 & 2032
- Figure 16: North America NA Red Meat Market Revenue (Million), by Distribution Channel 2024 & 2032
- Figure 17: North America NA Red Meat Market Revenue Share (%), by Distribution Channel 2024 & 2032
- Figure 18: North America NA Red Meat Market Revenue (Million), by Country 2024 & 2032
- Figure 19: North America NA Red Meat Market Revenue Share (%), by Country 2024 & 2032
- Figure 20: South America NA Red Meat Market Revenue (Million), by Type 2024 & 2032
- Figure 21: South America NA Red Meat Market Revenue Share (%), by Type 2024 & 2032
- Figure 22: South America NA Red Meat Market Revenue (Million), by Form 2024 & 2032
- Figure 23: South America NA Red Meat Market Revenue Share (%), by Form 2024 & 2032
- Figure 24: South America NA Red Meat Market Revenue (Million), by Distribution Channel 2024 & 2032
- Figure 25: South America NA Red Meat Market Revenue Share (%), by Distribution Channel 2024 & 2032
- Figure 26: South America NA Red Meat Market Revenue (Million), by Country 2024 & 2032
- Figure 27: South America NA Red Meat Market Revenue Share (%), by Country 2024 & 2032
- Figure 28: Europe NA Red Meat Market Revenue (Million), by Type 2024 & 2032
- Figure 29: Europe NA Red Meat Market Revenue Share (%), by Type 2024 & 2032
- Figure 30: Europe NA Red Meat Market Revenue (Million), by Form 2024 & 2032
- Figure 31: Europe NA Red Meat Market Revenue Share (%), by Form 2024 & 2032
- Figure 32: Europe NA Red Meat Market Revenue (Million), by Distribution Channel 2024 & 2032
- Figure 33: Europe NA Red Meat Market Revenue Share (%), by Distribution Channel 2024 & 2032
- Figure 34: Europe NA Red Meat Market Revenue (Million), by Country 2024 & 2032
- Figure 35: Europe NA Red Meat Market Revenue Share (%), by Country 2024 & 2032
- Figure 36: Middle East & Africa NA Red Meat Market Revenue (Million), by Type 2024 & 2032
- Figure 37: Middle East & Africa NA Red Meat Market Revenue Share (%), by Type 2024 & 2032
- Figure 38: Middle East & Africa NA Red Meat Market Revenue (Million), by Form 2024 & 2032
- Figure 39: Middle East & Africa NA Red Meat Market Revenue Share (%), by Form 2024 & 2032
- Figure 40: Middle East & Africa NA Red Meat Market Revenue (Million), by Distribution Channel 2024 & 2032
- Figure 41: Middle East & Africa NA Red Meat Market Revenue Share (%), by Distribution Channel 2024 & 2032
- Figure 42: Middle East & Africa NA Red Meat Market Revenue (Million), by Country 2024 & 2032
- Figure 43: Middle East & Africa NA Red Meat Market Revenue Share (%), by Country 2024 & 2032
- Figure 44: Asia Pacific NA Red Meat Market Revenue (Million), by Type 2024 & 2032
- Figure 45: Asia Pacific NA Red Meat Market Revenue Share (%), by Type 2024 & 2032
- Figure 46: Asia Pacific NA Red Meat Market Revenue (Million), by Form 2024 & 2032
- Figure 47: Asia Pacific NA Red Meat Market Revenue Share (%), by Form 2024 & 2032
- Figure 48: Asia Pacific NA Red Meat Market Revenue (Million), by Distribution Channel 2024 & 2032
- Figure 49: Asia Pacific NA Red Meat Market Revenue Share (%), by Distribution Channel 2024 & 2032
- Figure 50: Asia Pacific NA Red Meat Market Revenue (Million), by Country 2024 & 2032
- Figure 51: Asia Pacific NA Red Meat Market Revenue Share (%), by Country 2024 & 2032
List of Tables
- Table 1: Global NA Red Meat Market Revenue Million Forecast, by Region 2019 & 2032
- Table 2: Global NA Red Meat Market Revenue Million Forecast, by Type 2019 & 2032
- Table 3: Global NA Red Meat Market Revenue Million Forecast, by Form 2019 & 2032
- Table 4: Global NA Red Meat Market Revenue Million Forecast, by Distribution Channel 2019 & 2032
- Table 5: Global NA Red Meat Market Revenue Million Forecast, by Region 2019 & 2032
- Table 6: Global NA Red Meat Market Revenue Million Forecast, by Country 2019 & 2032
- Table 7: United States NA Red Meat Market Revenue (Million) Forecast, by Application 2019 & 2032
- Table 8: Canada NA Red Meat Market Revenue (Million) Forecast, by Application 2019 & 2032
- Table 9: Mexico NA Red Meat Market Revenue (Million) Forecast, by Application 2019 & 2032
- Table 10: Rest of North America NA Red Meat Market Revenue (Million) Forecast, by Application 2019 & 2032
- Table 11: Global NA Red Meat Market Revenue Million Forecast, by Country 2019 & 2032
- Table 12: Spain NA Red Meat Market Revenue (Million) Forecast, by Application 2019 & 2032
- Table 13: United Kingdom NA Red Meat Market Revenue (Million) Forecast, by Application 2019 & 2032
- Table 14: Germany NA Red Meat Market Revenue (Million) Forecast, by Application 2019 & 2032
- Table 15: France NA Red Meat Market Revenue (Million) Forecast, by Application 2019 & 2032
- Table 16: Italy NA Red Meat Market Revenue (Million) Forecast, by Application 2019 & 2032
- Table 17: Russia NA Red Meat Market Revenue (Million) Forecast, by Application 2019 & 2032
- Table 18: Rest of Europe NA Red Meat Market Revenue (Million) Forecast, by Application 2019 & 2032
- Table 19: Global NA Red Meat Market Revenue Million Forecast, by Country 2019 & 2032
- Table 20: China NA Red Meat Market Revenue (Million) Forecast, by Application 2019 & 2032
- Table 21: Japan NA Red Meat Market Revenue (Million) Forecast, by Application 2019 & 2032
- Table 22: India NA Red Meat Market Revenue (Million) Forecast, by Application 2019 & 2032
- Table 23: Australia NA Red Meat Market Revenue (Million) Forecast, by Application 2019 & 2032
- Table 24: Rest of Asia Pacific NA Red Meat Market Revenue (Million) Forecast, by Application 2019 & 2032
- Table 25: Global NA Red Meat Market Revenue Million Forecast, by Country 2019 & 2032
- Table 26: Brazil NA Red Meat Market Revenue (Million) Forecast, by Application 2019 & 2032
- Table 27: Argentina NA Red Meat Market Revenue (Million) Forecast, by Application 2019 & 2032
- Table 28: Rest of South America NA Red Meat Market Revenue (Million) Forecast, by Application 2019 & 2032
- Table 29: Global NA Red Meat Market Revenue Million Forecast, by Country 2019 & 2032
- Table 30: South Africa NA Red Meat Market Revenue (Million) Forecast, by Application 2019 & 2032
- Table 31: United Arab Emirates NA Red Meat Market Revenue (Million) Forecast, by Application 2019 & 2032
- Table 32: Rest of Middle East and Africa NA Red Meat Market Revenue (Million) Forecast, by Application 2019 & 2032
- Table 33: Global NA Red Meat Market Revenue Million Forecast, by Type 2019 & 2032
- Table 34: Global NA Red Meat Market Revenue Million Forecast, by Form 2019 & 2032
- Table 35: Global NA Red Meat Market Revenue Million Forecast, by Distribution Channel 2019 & 2032
- Table 36: Global NA Red Meat Market Revenue Million Forecast, by Country 2019 & 2032
- Table 37: United States NA Red Meat Market Revenue (Million) Forecast, by Application 2019 & 2032
- Table 38: Canada NA Red Meat Market Revenue (Million) Forecast, by Application 2019 & 2032
- Table 39: Mexico NA Red Meat Market Revenue (Million) Forecast, by Application 2019 & 2032
- Table 40: Global NA Red Meat Market Revenue Million Forecast, by Type 2019 & 2032
- Table 41: Global NA Red Meat Market Revenue Million Forecast, by Form 2019 & 2032
- Table 42: Global NA Red Meat Market Revenue Million Forecast, by Distribution Channel 2019 & 2032
- Table 43: Global NA Red Meat Market Revenue Million Forecast, by Country 2019 & 2032
- Table 44: Brazil NA Red Meat Market Revenue (Million) Forecast, by Application 2019 & 2032
- Table 45: Argentina NA Red Meat Market Revenue (Million) Forecast, by Application 2019 & 2032
- Table 46: Rest of South America NA Red Meat Market Revenue (Million) Forecast, by Application 2019 & 2032
- Table 47: Global NA Red Meat Market Revenue Million Forecast, by Type 2019 & 2032
- Table 48: Global NA Red Meat Market Revenue Million Forecast, by Form 2019 & 2032
- Table 49: Global NA Red Meat Market Revenue Million Forecast, by Distribution Channel 2019 & 2032
- Table 50: Global NA Red Meat Market Revenue Million Forecast, by Country 2019 & 2032
- Table 51: United Kingdom NA Red Meat Market Revenue (Million) Forecast, by Application 2019 & 2032
- Table 52: Germany NA Red Meat Market Revenue (Million) Forecast, by Application 2019 & 2032
- Table 53: France NA Red Meat Market Revenue (Million) Forecast, by Application 2019 & 2032
- Table 54: Italy NA Red Meat Market Revenue (Million) Forecast, by Application 2019 & 2032
- Table 55: Spain NA Red Meat Market Revenue (Million) Forecast, by Application 2019 & 2032
- Table 56: Russia NA Red Meat Market Revenue (Million) Forecast, by Application 2019 & 2032
- Table 57: Benelux NA Red Meat Market Revenue (Million) Forecast, by Application 2019 & 2032
- Table 58: Nordics NA Red Meat Market Revenue (Million) Forecast, by Application 2019 & 2032
- Table 59: Rest of Europe NA Red Meat Market Revenue (Million) Forecast, by Application 2019 & 2032
- Table 60: Global NA Red Meat Market Revenue Million Forecast, by Type 2019 & 2032
- Table 61: Global NA Red Meat Market Revenue Million Forecast, by Form 2019 & 2032
- Table 62: Global NA Red Meat Market Revenue Million Forecast, by Distribution Channel 2019 & 2032
- Table 63: Global NA Red Meat Market Revenue Million Forecast, by Country 2019 & 2032
- Table 64: Turkey NA Red Meat Market Revenue (Million) Forecast, by Application 2019 & 2032
- Table 65: Israel NA Red Meat Market Revenue (Million) Forecast, by Application 2019 & 2032
- Table 66: GCC NA Red Meat Market Revenue (Million) Forecast, by Application 2019 & 2032
- Table 67: North Africa NA Red Meat Market Revenue (Million) Forecast, by Application 2019 & 2032
- Table 68: South Africa NA Red Meat Market Revenue (Million) Forecast, by Application 2019 & 2032
- Table 69: Rest of Middle East & Africa NA Red Meat Market Revenue (Million) Forecast, by Application 2019 & 2032
- Table 70: Global NA Red Meat Market Revenue Million Forecast, by Type 2019 & 2032
- Table 71: Global NA Red Meat Market Revenue Million Forecast, by Form 2019 & 2032
- Table 72: Global NA Red Meat Market Revenue Million Forecast, by Distribution Channel 2019 & 2032
- Table 73: Global NA Red Meat Market Revenue Million Forecast, by Country 2019 & 2032
- Table 74: China NA Red Meat Market Revenue (Million) Forecast, by Application 2019 & 2032
- Table 75: India NA Red Meat Market Revenue (Million) Forecast, by Application 2019 & 2032
- Table 76: Japan NA Red Meat Market Revenue (Million) Forecast, by Application 2019 & 2032
- Table 77: South Korea NA Red Meat Market Revenue (Million) Forecast, by Application 2019 & 2032
- Table 78: ASEAN NA Red Meat Market Revenue (Million) Forecast, by Application 2019 & 2032
- Table 79: Oceania NA Red Meat Market Revenue (Million) Forecast, by Application 2019 & 2032
- Table 80: Rest of Asia Pacific NA Red Meat Market Revenue (Million) Forecast, by Application 2019 & 2032
Frequently Asked Questions
1. What is the projected Compound Annual Growth Rate (CAGR) of the NA Red Meat Market?
The projected CAGR is approximately 6.42%.
2. Which companies are prominent players in the NA Red Meat Market?
Key companies in the market include WH Group Limite, NH Foods Ltd, Vion Group, Tyson Foods Inc, Perdue Farms Inc, Conagra Brands Inc, Sysco Corporation, The Kraft Heinz Company, Hormel Foods Corporation, Cargill Inc, Marfrig Global Foods S A, The Clemens Family Corporation, JBS SA, OSI Group.
3. What are the main segments of the NA Red Meat Market?
The market segments include Type, Form, Distribution Channel.
4. Can you provide details about the market size?
The market size is estimated to be USD XX Million as of 2022.
5. What are some drivers contributing to market growth?
Increasing Demand for Low-Fat and Low-Calorie Food; Increasing Product Innovation.
6. What are the notable trends driving market growth?
OTHER KEY INDUSTRY TRENDS COVERED IN THE REPORT.
7. Are there any restraints impacting market growth?
; Threat of New Entrants; Bargaining Power of Buyers/Consumers; Bargaining Power of Suppliers; Threat of Substitute Products; Degree Of Competition.
8. Can you provide examples of recent developments in the market?
April 2023: Swift Prepared Food, a subsidiary of JBS USA, launched Principe Foods, which produces high-quality Italian meats and charcuterie.December 2022: JBS has acquired “certain assets” from US-based pork supplier TriOak Foods, strengthening its control over the supply chain.November 2022: Conagra Brands, Inc. has announced plans to invest about USD 60 million to expand the Troy facility's production capacity in Ohio, United States. Slim Jim products are mainly manufactured in the facility. Conagra stated that the 389,000 square foot plant will gain around 15,000 square feet as part of the expansion.
9. What pricing options are available for accessing the report?
Pricing options include single-user, multi-user, and enterprise licenses priced at USD 3800, USD 4500, and USD 5800 respectively.
10. Is the market size provided in terms of value or volume?
The market size is provided in terms of value, measured in Million.
11. Are there any specific market keywords associated with the report?
Yes, the market keyword associated with the report is "NA Red Meat Market," which aids in identifying and referencing the specific market segment covered.
12. How do I determine which pricing option suits my needs best?
The pricing options vary based on user requirements and access needs. Individual users may opt for single-user licenses, while businesses requiring broader access may choose multi-user or enterprise licenses for cost-effective access to the report.
13. Are there any additional resources or data provided in the NA Red Meat Market report?
While the report offers comprehensive insights, it's advisable to review the specific contents or supplementary materials provided to ascertain if additional resources or data are available.
14. How can I stay updated on further developments or reports in the NA Red Meat Market?
To stay informed about further developments, trends, and reports in the NA Red Meat Market, consider subscribing to industry newsletters, following relevant companies and organizations, or regularly checking reputable industry news sources and publications.
Methodology
Step 1 - Identification of Relevant Samples Size from Population Database


Step 2 - Approaches for Defining Global Market Size (Value, Volume* & Price*)

Note*: In applicable scenarios
Step 3 - Data Sources
Primary Research
- Web Analytics
- Survey Reports
- Research Institute
- Latest Research Reports
- Opinion Leaders
Secondary Research
- Annual Reports
- White Paper
- Latest Press Release
- Industry Association
- Paid Database
- Investor Presentations

Step 4 - Data Triangulation
Involves using different sources of information in order to increase the validity of a study
These sources are likely to be stakeholders in a program - participants, other researchers, program staff, other community members, and so on.
Then we put all data in single framework & apply various statistical tools to find out the dynamic on the market.
During the analysis stage, feedback from the stakeholder groups would be compared to determine areas of agreement as well as areas of divergence


