
Key Insights
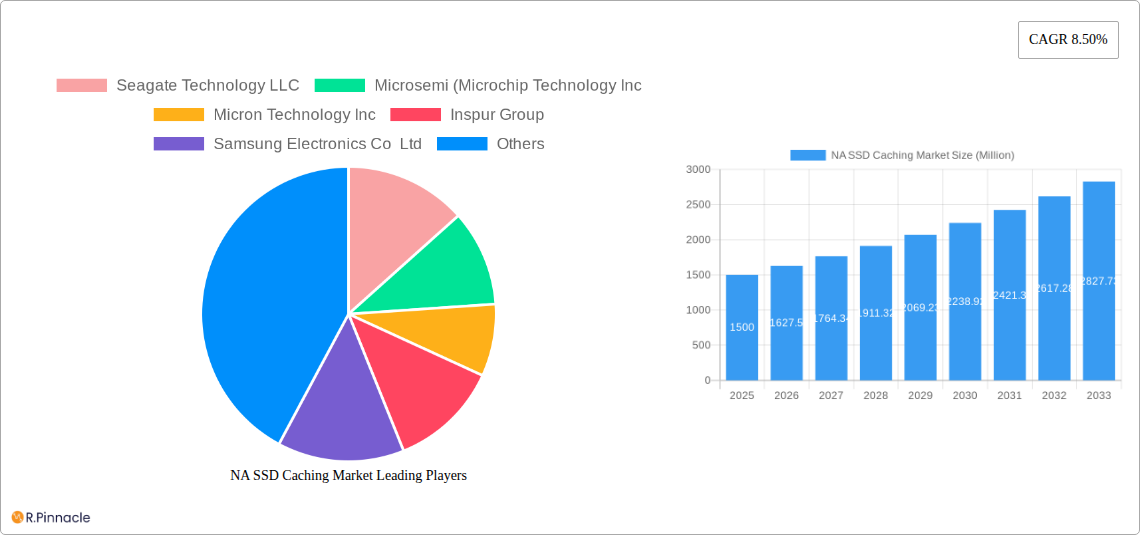
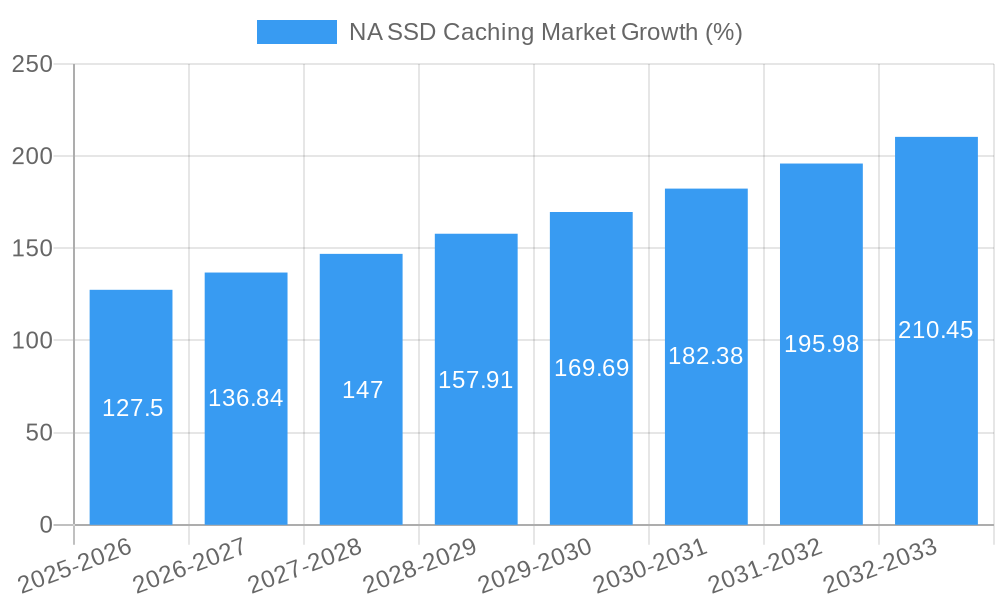
The North American SSD caching market is experiencing robust growth, driven by the increasing demand for high-performance computing and data storage solutions across enterprise and personal applications. The market's Compound Annual Growth Rate (CAGR) of 8.50% from 2019 to 2033 signifies a consistently expanding market. Key drivers include the proliferation of cloud computing, the rise of big data analytics, and the growing need for faster data access speeds in various sectors. The enterprise storage segment dominates the market due to the substantial investments made by organizations to optimize their IT infrastructure for improved efficiency and reduced latency. However, the personal storage segment is witnessing significant growth as consumers increasingly adopt high-performance computing devices and require faster storage solutions for demanding applications such as gaming and video editing. Major players like Seagate, Micron, Western Digital, and Samsung are actively involved in innovation and competition, driving down costs and improving performance, which further fuels market expansion.
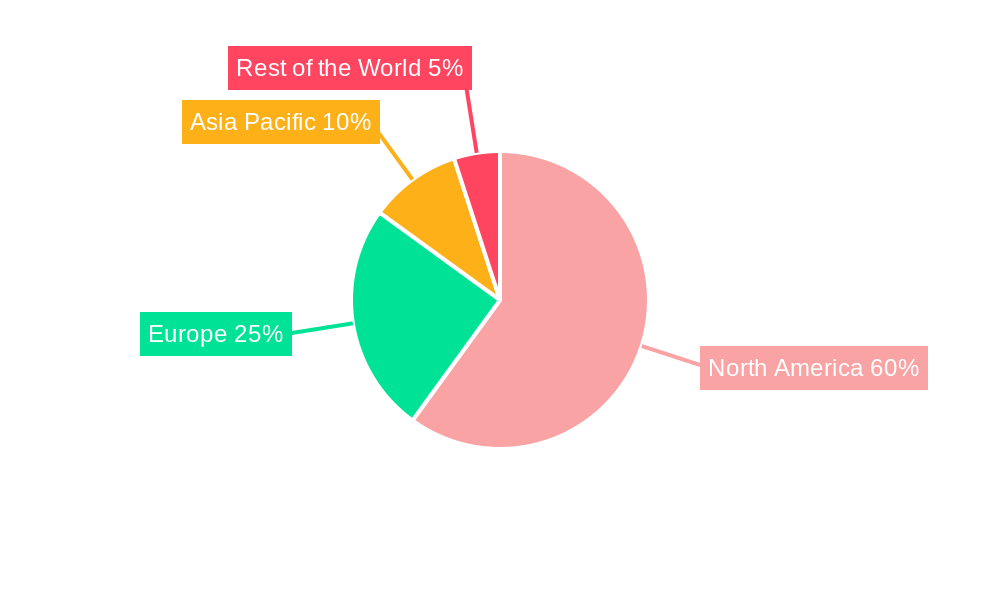
Despite the positive outlook, the market faces certain restraints. These include the relatively high initial investment costs associated with implementing SSD caching solutions, the potential for data loss if not managed properly, and the ongoing technological advancements that continuously impact product lifecycles. However, ongoing innovation in SSD technology, leading to increased storage capacity and lower costs, is mitigating these challenges. The geographical distribution of the market is weighted towards North America, benefiting from a strong technological base and high adoption rates within the enterprise sector. Future growth will be influenced by factors such as the increasing adoption of NVMe technology, the expansion of 5G networks, and the continued development of advanced data analytics applications. The market is projected to witness substantial expansion in the forecast period (2025-2033), driven by these factors and continued investments in IT infrastructure upgrades.
This comprehensive report provides an in-depth analysis of the North American (NA) SSD Caching Market, offering valuable insights for industry professionals, investors, and strategic decision-makers. Covering the period 2019-2033, with a focus on 2025, this report delves into market structure, dynamics, leading players, and future trends, providing actionable intelligence to navigate this rapidly evolving landscape. The market is segmented by application into Enterprise Storage and Personal Storage.
NA SSD Caching Market Market Structure & Innovation Trends
The NA SSD caching market exhibits a moderately concentrated structure, with key players like Seagate, Micron, Samsung, Western Digital, and Intel holding significant market share. The exact market share for each company in 2025 is estimated at xx%, indicating a competitive yet consolidated market. Innovation is driven by the increasing demand for faster data processing speeds and higher storage capacities, particularly in enterprise and cloud environments. Regulatory frameworks, such as data privacy regulations, influence market growth. Product substitutes, such as traditional HDD caching, are facing increasing competition. The end-user demographics are broad, encompassing businesses, consumers, and government entities. M&A activity in this sector has been moderate, with deal values in the range of xx Million USD in recent years, mainly focusing on expanding technology portfolios and market reach.
NA SSD Caching Market Market Dynamics & Trends
The NA SSD caching market is experiencing robust growth, driven by the expanding adoption of cloud computing, big data analytics, and the rise of data-intensive applications. The Compound Annual Growth Rate (CAGR) from 2025 to 2033 is projected to be xx%. Technological disruptions, such as the development of NVMe technology and advancements in 3D NAND flash memory, are significantly impacting market dynamics. Consumer preferences are shifting towards higher storage capacities, faster read/write speeds, and improved power efficiency. The competitive landscape is characterized by intense rivalry among established players, along with the emergence of new entrants. Market penetration of SSD caching solutions is steadily increasing across various sectors, with significant growth anticipated in the enterprise segment.
Dominant Regions & Segments in NA SSD Caching Market
The Enterprise Storage segment is currently the dominant application within the NA SSD caching market. Key drivers for this dominance include:
- High demand for performance: Enterprise applications, such as databases and virtual servers, require high-speed data access which SSD caching solutions excel in delivering.
- Increased data volume: The exponential growth of data in enterprise environments necessitates efficient storage and retrieval mechanisms.
- Cloud adoption: The move towards cloud-based infrastructure boosts the need for efficient storage and caching solutions.
- Investment in data centers: Organizations heavily invest in expanding and upgrading their data center infrastructure to support high-performance computing.
The United States is the leading region, benefiting from significant investment in technology and a large user base. Canada also contributes substantially to market growth. This dominance is attributed to advanced technological infrastructure, a thriving IT sector, and strong government initiatives to support technological innovation.
NA SSD Caching Market Product Innovations
Recent product developments include Intel's SSD 670p (March 2021), a 144-layer quad-level cell (QLC) based SSD offering improved performance compared to its predecessors. Further, Intel’s launch of the SSD D7-P5500 and D7-P5600 Series (August 2020) targeted enterprise and cloud environments with optimized performance and capacity. These innovations highlight the ongoing focus on enhancing performance, endurance, and efficiency to meet the growing demands of various applications. The market fit for these innovations is strong, driven by the need for faster and more reliable storage solutions.
Report Scope & Segmentation Analysis
The NA SSD caching market is segmented by application into Enterprise Storage and Personal Storage.
Enterprise Storage: This segment encompasses SSD caching solutions deployed in data centers, cloud infrastructure, and enterprise servers. Growth is projected at xx% CAGR during the forecast period, driven by rising data volumes and performance demands. The segment is highly competitive, with major players vying for market share.
Personal Storage: This segment covers SSD caching solutions used in PCs, laptops, and gaming consoles. The growth rate is estimated at xx% CAGR during the forecast period. This segment exhibits less intense competition compared to the enterprise segment.
Key Drivers of NA SSD Caching Market Growth
Several factors drive the NA SSD caching market's growth:
- Technological advancements: Development of high-performance NVMe drives and improved 3D NAND flash memory.
- Growing data volumes: Increasing demand for efficient storage and retrieval mechanisms.
- Cloud computing adoption: The shift towards cloud-based infrastructure fuels the demand for SSD caching.
- Favorable economic conditions: Increased investment in technology infrastructure.
- Government regulations: Data privacy regulations promote investment in secure storage solutions.
Challenges in the NA SSD Caching Market Sector
The NA SSD caching market faces certain challenges:
- High initial investment costs for SSD caching solutions.
- Supply chain disruptions impacting component availability and prices.
- Intense competition among established players.
- Potential data security concerns relating to the storage of sensitive information.
- The need for skilled professionals to manage and maintain complex SSD caching systems.
These factors can impact market growth and profitability.
Emerging Opportunities in NA SSD Caching Market
Several emerging opportunities are shaping the NA SSD caching market:
- Growth of edge computing: The demand for fast data processing near the data source.
- Expansion into new markets: Opportunities in developing economies with growing technology adoption.
- Advancements in AI and machine learning: Increased use of SSD caching in AI applications.
- Development of innovative storage technologies: Continued improvement in NAND flash memory and controller technology.
Leading Players in the NA SSD Caching Market Market
- Seagate Technology LLC
- Microsemi (Microchip Technology Inc)
- Micron Technology Inc
- Inspur Group
- Samsung Electronics Co Ltd
- Transcend Information Inc
- Kioxia (Toshiba Memory Corporation)
- ADATA Technology Co Ltd
- Western Digital Corporation
- SK Hynix Inc
- NetApp Inc
- Intel Corporation
- QNAP Systems Inc
Key Developments in NA SSD Caching Market Industry
- March 2021: Intel released the SSD 670p, a 144-layer QLC-based SSD with improved performance and endurance.
- August 2020: Intel launched the SSD D7-P5500 and D7-P5600 Series, designed for enterprise and cloud environments. These developments showcase advancements in SSD technology, enhancing performance and addressing the needs of diverse applications.
Future Outlook for NA SSD Caching Market Market
The future of the NA SSD caching market is bright, driven by continued technological advancements, the proliferation of data-intensive applications, and the ongoing expansion of cloud computing. Strategic opportunities exist in developing innovative storage solutions, expanding into new markets, and focusing on data security. The market is poised for sustained growth over the forecast period.
NA SSD Caching Market Segmentation
-
1. Application
- 1.1. Enterprise Storage
- 1.2. Personal Storage
NA SSD Caching Market Segmentation By Geography
-
1. North America
- 1.1. United States
- 1.2. Canada
- 1.3. Mexico
-
2. South America
- 2.1. Brazil
- 2.2. Argentina
- 2.3. Rest of South America
-
3. Europe
- 3.1. United Kingdom
- 3.2. Germany
- 3.3. France
- 3.4. Italy
- 3.5. Spain
- 3.6. Russia
- 3.7. Benelux
- 3.8. Nordics
- 3.9. Rest of Europe
-
4. Middle East & Africa
- 4.1. Turkey
- 4.2. Israel
- 4.3. GCC
- 4.4. North Africa
- 4.5. South Africa
- 4.6. Rest of Middle East & Africa
-
5. Asia Pacific
- 5.1. China
- 5.2. India
- 5.3. Japan
- 5.4. South Korea
- 5.5. ASEAN
- 5.6. Oceania
- 5.7. Rest of Asia Pacific
NA SSD Caching Market REPORT HIGHLIGHTS
| Aspects | Details |
|---|---|
| Study Period | 2019-2033 |
| Base Year | 2024 |
| Estimated Year | 2025 |
| Forecast Period | 2025-2033 |
| Historical Period | 2019-2024 |
| Growth Rate | CAGR of 8.50% from 2019-2033 |
| Segmentation |
|
Table of Contents
- 1. Introduction
- 1.1. Research Scope
- 1.2. Market Segmentation
- 1.3. Research Methodology
- 1.4. Definitions and Assumptions
- 2. Executive Summary
- 2.1. Introduction
- 3. Market Dynamics
- 3.1. Introduction
- 3.2. Market Drivers
- 3.2.1. Improvements Offered by SSDs Over Conventional HDDs
- 3.3. Market Restrains
- 3.3.1. Slow Pace in Development of Applications Despite Heavy investments in R&D; Commplexities in Hardware Designing
- 3.4. Market Trends
- 3.4.1. Enterprise Storage Expected to Hold Major Share
- 4. Market Factor Analysis
- 4.1. Porters Five Forces
- 4.2. Supply/Value Chain
- 4.3. PESTEL analysis
- 4.4. Market Entropy
- 4.5. Patent/Trademark Analysis
- 5. Global NA SSD Caching Market Analysis, Insights and Forecast, 2019-2031
- 5.1. Market Analysis, Insights and Forecast - by Application
- 5.1.1. Enterprise Storage
- 5.1.2. Personal Storage
- 5.2. Market Analysis, Insights and Forecast - by Region
- 5.2.1. North America
- 5.2.2. South America
- 5.2.3. Europe
- 5.2.4. Middle East & Africa
- 5.2.5. Asia Pacific
- 5.1. Market Analysis, Insights and Forecast - by Application
- 6. North America NA SSD Caching Market Analysis, Insights and Forecast, 2019-2031
- 6.1. Market Analysis, Insights and Forecast - by Application
- 6.1.1. Enterprise Storage
- 6.1.2. Personal Storage
- 6.1. Market Analysis, Insights and Forecast - by Application
- 7. South America NA SSD Caching Market Analysis, Insights and Forecast, 2019-2031
- 7.1. Market Analysis, Insights and Forecast - by Application
- 7.1.1. Enterprise Storage
- 7.1.2. Personal Storage
- 7.1. Market Analysis, Insights and Forecast - by Application
- 8. Europe NA SSD Caching Market Analysis, Insights and Forecast, 2019-2031
- 8.1. Market Analysis, Insights and Forecast - by Application
- 8.1.1. Enterprise Storage
- 8.1.2. Personal Storage
- 8.1. Market Analysis, Insights and Forecast - by Application
- 9. Middle East & Africa NA SSD Caching Market Analysis, Insights and Forecast, 2019-2031
- 9.1. Market Analysis, Insights and Forecast - by Application
- 9.1.1. Enterprise Storage
- 9.1.2. Personal Storage
- 9.1. Market Analysis, Insights and Forecast - by Application
- 10. Asia Pacific NA SSD Caching Market Analysis, Insights and Forecast, 2019-2031
- 10.1. Market Analysis, Insights and Forecast - by Application
- 10.1.1. Enterprise Storage
- 10.1.2. Personal Storage
- 10.1. Market Analysis, Insights and Forecast - by Application
- 11. North America NA SSD Caching Market Analysis, Insights and Forecast, 2019-2031
- 11.1. Market Analysis, Insights and Forecast - By Country/Sub-region
- 11.1.1 United States
- 11.1.2 Canada
- 12. Europe NA SSD Caching Market Analysis, Insights and Forecast, 2019-2031
- 12.1. Market Analysis, Insights and Forecast - By Country/Sub-region
- 12.1.1 Germany
- 12.1.2 United Kingdom
- 12.1.3 France
- 12.1.4 Rest of Europe
- 13. Asia Pacific NA SSD Caching Market Analysis, Insights and Forecast, 2019-2031
- 13.1. Market Analysis, Insights and Forecast - By Country/Sub-region
- 13.1.1 China
- 13.1.2 Taiwan
- 13.1.3 South Korea
- 13.1.4 Rest of Asia Pacific
- 14. Rest of the World NA SSD Caching Market Analysis, Insights and Forecast, 2019-2031
- 14.1. Market Analysis, Insights and Forecast - By Country/Sub-region
- 14.1.1.
- 15. Competitive Analysis
- 15.1. Global Market Share Analysis 2024
- 15.2. Company Profiles
- 15.2.1 Seagate Technology LLC
- 15.2.1.1. Overview
- 15.2.1.2. Products
- 15.2.1.3. SWOT Analysis
- 15.2.1.4. Recent Developments
- 15.2.1.5. Financials (Based on Availability)
- 15.2.2 Microsemi (Microchip Technology Inc
- 15.2.2.1. Overview
- 15.2.2.2. Products
- 15.2.2.3. SWOT Analysis
- 15.2.2.4. Recent Developments
- 15.2.2.5. Financials (Based on Availability)
- 15.2.3 Micron Technology Inc
- 15.2.3.1. Overview
- 15.2.3.2. Products
- 15.2.3.3. SWOT Analysis
- 15.2.3.4. Recent Developments
- 15.2.3.5. Financials (Based on Availability)
- 15.2.4 Inspur Group
- 15.2.4.1. Overview
- 15.2.4.2. Products
- 15.2.4.3. SWOT Analysis
- 15.2.4.4. Recent Developments
- 15.2.4.5. Financials (Based on Availability)
- 15.2.5 Samsung Electronics Co Ltd
- 15.2.5.1. Overview
- 15.2.5.2. Products
- 15.2.5.3. SWOT Analysis
- 15.2.5.4. Recent Developments
- 15.2.5.5. Financials (Based on Availability)
- 15.2.6 Transcend Information Inc
- 15.2.6.1. Overview
- 15.2.6.2. Products
- 15.2.6.3. SWOT Analysis
- 15.2.6.4. Recent Developments
- 15.2.6.5. Financials (Based on Availability)
- 15.2.7 Kioxia (Toshiba Memory Corporation)
- 15.2.7.1. Overview
- 15.2.7.2. Products
- 15.2.7.3. SWOT Analysis
- 15.2.7.4. Recent Developments
- 15.2.7.5. Financials (Based on Availability)
- 15.2.8 ADATA Technology Co Ltd
- 15.2.8.1. Overview
- 15.2.8.2. Products
- 15.2.8.3. SWOT Analysis
- 15.2.8.4. Recent Developments
- 15.2.8.5. Financials (Based on Availability)
- 15.2.9 Western Digital Corporation
- 15.2.9.1. Overview
- 15.2.9.2. Products
- 15.2.9.3. SWOT Analysis
- 15.2.9.4. Recent Developments
- 15.2.9.5. Financials (Based on Availability)
- 15.2.10 SK Hynix Inc
- 15.2.10.1. Overview
- 15.2.10.2. Products
- 15.2.10.3. SWOT Analysis
- 15.2.10.4. Recent Developments
- 15.2.10.5. Financials (Based on Availability)
- 15.2.11 NetApp Inc
- 15.2.11.1. Overview
- 15.2.11.2. Products
- 15.2.11.3. SWOT Analysis
- 15.2.11.4. Recent Developments
- 15.2.11.5. Financials (Based on Availability)
- 15.2.12 Intel Corporation
- 15.2.12.1. Overview
- 15.2.12.2. Products
- 15.2.12.3. SWOT Analysis
- 15.2.12.4. Recent Developments
- 15.2.12.5. Financials (Based on Availability)
- 15.2.13 QNAP Systems Inc
- 15.2.13.1. Overview
- 15.2.13.2. Products
- 15.2.13.3. SWOT Analysis
- 15.2.13.4. Recent Developments
- 15.2.13.5. Financials (Based on Availability)
- 15.2.1 Seagate Technology LLC
List of Figures
- Figure 1: Global NA SSD Caching Market Revenue Breakdown (Million, %) by Region 2024 & 2032
- Figure 2: North America NA SSD Caching Market Revenue (Million), by Country 2024 & 2032
- Figure 3: North America NA SSD Caching Market Revenue Share (%), by Country 2024 & 2032
- Figure 4: Europe NA SSD Caching Market Revenue (Million), by Country 2024 & 2032
- Figure 5: Europe NA SSD Caching Market Revenue Share (%), by Country 2024 & 2032
- Figure 6: Asia Pacific NA SSD Caching Market Revenue (Million), by Country 2024 & 2032
- Figure 7: Asia Pacific NA SSD Caching Market Revenue Share (%), by Country 2024 & 2032
- Figure 8: Rest of the World NA SSD Caching Market Revenue (Million), by Country 2024 & 2032
- Figure 9: Rest of the World NA SSD Caching Market Revenue Share (%), by Country 2024 & 2032
- Figure 10: North America NA SSD Caching Market Revenue (Million), by Application 2024 & 2032
- Figure 11: North America NA SSD Caching Market Revenue Share (%), by Application 2024 & 2032
- Figure 12: North America NA SSD Caching Market Revenue (Million), by Country 2024 & 2032
- Figure 13: North America NA SSD Caching Market Revenue Share (%), by Country 2024 & 2032
- Figure 14: South America NA SSD Caching Market Revenue (Million), by Application 2024 & 2032
- Figure 15: South America NA SSD Caching Market Revenue Share (%), by Application 2024 & 2032
- Figure 16: South America NA SSD Caching Market Revenue (Million), by Country 2024 & 2032
- Figure 17: South America NA SSD Caching Market Revenue Share (%), by Country 2024 & 2032
- Figure 18: Europe NA SSD Caching Market Revenue (Million), by Application 2024 & 2032
- Figure 19: Europe NA SSD Caching Market Revenue Share (%), by Application 2024 & 2032
- Figure 20: Europe NA SSD Caching Market Revenue (Million), by Country 2024 & 2032
- Figure 21: Europe NA SSD Caching Market Revenue Share (%), by Country 2024 & 2032
- Figure 22: Middle East & Africa NA SSD Caching Market Revenue (Million), by Application 2024 & 2032
- Figure 23: Middle East & Africa NA SSD Caching Market Revenue Share (%), by Application 2024 & 2032
- Figure 24: Middle East & Africa NA SSD Caching Market Revenue (Million), by Country 2024 & 2032
- Figure 25: Middle East & Africa NA SSD Caching Market Revenue Share (%), by Country 2024 & 2032
- Figure 26: Asia Pacific NA SSD Caching Market Revenue (Million), by Application 2024 & 2032
- Figure 27: Asia Pacific NA SSD Caching Market Revenue Share (%), by Application 2024 & 2032
- Figure 28: Asia Pacific NA SSD Caching Market Revenue (Million), by Country 2024 & 2032
- Figure 29: Asia Pacific NA SSD Caching Market Revenue Share (%), by Country 2024 & 2032
List of Tables
- Table 1: Global NA SSD Caching Market Revenue Million Forecast, by Region 2019 & 2032
- Table 2: Global NA SSD Caching Market Revenue Million Forecast, by Application 2019 & 2032
- Table 3: Global NA SSD Caching Market Revenue Million Forecast, by Region 2019 & 2032
- Table 4: Global NA SSD Caching Market Revenue Million Forecast, by Country 2019 & 2032
- Table 5: United States NA SSD Caching Market Revenue (Million) Forecast, by Application 2019 & 2032
- Table 6: Canada NA SSD Caching Market Revenue (Million) Forecast, by Application 2019 & 2032
- Table 7: Global NA SSD Caching Market Revenue Million Forecast, by Country 2019 & 2032
- Table 8: Germany NA SSD Caching Market Revenue (Million) Forecast, by Application 2019 & 2032
- Table 9: United Kingdom NA SSD Caching Market Revenue (Million) Forecast, by Application 2019 & 2032
- Table 10: France NA SSD Caching Market Revenue (Million) Forecast, by Application 2019 & 2032
- Table 11: Rest of Europe NA SSD Caching Market Revenue (Million) Forecast, by Application 2019 & 2032
- Table 12: Global NA SSD Caching Market Revenue Million Forecast, by Country 2019 & 2032
- Table 13: China NA SSD Caching Market Revenue (Million) Forecast, by Application 2019 & 2032
- Table 14: Taiwan NA SSD Caching Market Revenue (Million) Forecast, by Application 2019 & 2032
- Table 15: South Korea NA SSD Caching Market Revenue (Million) Forecast, by Application 2019 & 2032
- Table 16: Rest of Asia Pacific NA SSD Caching Market Revenue (Million) Forecast, by Application 2019 & 2032
- Table 17: Global NA SSD Caching Market Revenue Million Forecast, by Country 2019 & 2032
- Table 18: NA SSD Caching Market Revenue (Million) Forecast, by Application 2019 & 2032
- Table 19: Global NA SSD Caching Market Revenue Million Forecast, by Application 2019 & 2032
- Table 20: Global NA SSD Caching Market Revenue Million Forecast, by Country 2019 & 2032
- Table 21: United States NA SSD Caching Market Revenue (Million) Forecast, by Application 2019 & 2032
- Table 22: Canada NA SSD Caching Market Revenue (Million) Forecast, by Application 2019 & 2032
- Table 23: Mexico NA SSD Caching Market Revenue (Million) Forecast, by Application 2019 & 2032
- Table 24: Global NA SSD Caching Market Revenue Million Forecast, by Application 2019 & 2032
- Table 25: Global NA SSD Caching Market Revenue Million Forecast, by Country 2019 & 2032
- Table 26: Brazil NA SSD Caching Market Revenue (Million) Forecast, by Application 2019 & 2032
- Table 27: Argentina NA SSD Caching Market Revenue (Million) Forecast, by Application 2019 & 2032
- Table 28: Rest of South America NA SSD Caching Market Revenue (Million) Forecast, by Application 2019 & 2032
- Table 29: Global NA SSD Caching Market Revenue Million Forecast, by Application 2019 & 2032
- Table 30: Global NA SSD Caching Market Revenue Million Forecast, by Country 2019 & 2032
- Table 31: United Kingdom NA SSD Caching Market Revenue (Million) Forecast, by Application 2019 & 2032
- Table 32: Germany NA SSD Caching Market Revenue (Million) Forecast, by Application 2019 & 2032
- Table 33: France NA SSD Caching Market Revenue (Million) Forecast, by Application 2019 & 2032
- Table 34: Italy NA SSD Caching Market Revenue (Million) Forecast, by Application 2019 & 2032
- Table 35: Spain NA SSD Caching Market Revenue (Million) Forecast, by Application 2019 & 2032
- Table 36: Russia NA SSD Caching Market Revenue (Million) Forecast, by Application 2019 & 2032
- Table 37: Benelux NA SSD Caching Market Revenue (Million) Forecast, by Application 2019 & 2032
- Table 38: Nordics NA SSD Caching Market Revenue (Million) Forecast, by Application 2019 & 2032
- Table 39: Rest of Europe NA SSD Caching Market Revenue (Million) Forecast, by Application 2019 & 2032
- Table 40: Global NA SSD Caching Market Revenue Million Forecast, by Application 2019 & 2032
- Table 41: Global NA SSD Caching Market Revenue Million Forecast, by Country 2019 & 2032
- Table 42: Turkey NA SSD Caching Market Revenue (Million) Forecast, by Application 2019 & 2032
- Table 43: Israel NA SSD Caching Market Revenue (Million) Forecast, by Application 2019 & 2032
- Table 44: GCC NA SSD Caching Market Revenue (Million) Forecast, by Application 2019 & 2032
- Table 45: North Africa NA SSD Caching Market Revenue (Million) Forecast, by Application 2019 & 2032
- Table 46: South Africa NA SSD Caching Market Revenue (Million) Forecast, by Application 2019 & 2032
- Table 47: Rest of Middle East & Africa NA SSD Caching Market Revenue (Million) Forecast, by Application 2019 & 2032
- Table 48: Global NA SSD Caching Market Revenue Million Forecast, by Application 2019 & 2032
- Table 49: Global NA SSD Caching Market Revenue Million Forecast, by Country 2019 & 2032
- Table 50: China NA SSD Caching Market Revenue (Million) Forecast, by Application 2019 & 2032
- Table 51: India NA SSD Caching Market Revenue (Million) Forecast, by Application 2019 & 2032
- Table 52: Japan NA SSD Caching Market Revenue (Million) Forecast, by Application 2019 & 2032
- Table 53: South Korea NA SSD Caching Market Revenue (Million) Forecast, by Application 2019 & 2032
- Table 54: ASEAN NA SSD Caching Market Revenue (Million) Forecast, by Application 2019 & 2032
- Table 55: Oceania NA SSD Caching Market Revenue (Million) Forecast, by Application 2019 & 2032
- Table 56: Rest of Asia Pacific NA SSD Caching Market Revenue (Million) Forecast, by Application 2019 & 2032
Frequently Asked Questions
1. What is the projected Compound Annual Growth Rate (CAGR) of the NA SSD Caching Market?
The projected CAGR is approximately 8.50%.
2. Which companies are prominent players in the NA SSD Caching Market?
Key companies in the market include Seagate Technology LLC, Microsemi (Microchip Technology Inc, Micron Technology Inc, Inspur Group, Samsung Electronics Co Ltd, Transcend Information Inc, Kioxia (Toshiba Memory Corporation), ADATA Technology Co Ltd, Western Digital Corporation, SK Hynix Inc, NetApp Inc, Intel Corporation, QNAP Systems Inc.
3. What are the main segments of the NA SSD Caching Market?
The market segments include Application.
4. Can you provide details about the market size?
The market size is estimated to be USD XX Million as of 2022.
5. What are some drivers contributing to market growth?
Improvements Offered by SSDs Over Conventional HDDs.
6. What are the notable trends driving market growth?
Enterprise Storage Expected to Hold Major Share.
7. Are there any restraints impacting market growth?
Slow Pace in Development of Applications Despite Heavy investments in R&D; Commplexities in Hardware Designing.
8. Can you provide examples of recent developments in the market?
March 2021 - A Solid State Drive (SSD) 670p has been released by Intel. The client SSD is a 144-layer quad-level cell-based device. The SSD can hold up to two terabytes of data in a single drive. According to Intel, SSDs can be used to supplement everyday computing needs and assist extreme gaming. When compared to the previous generation Intel QLC 3D NAND SSD, the new SSD 670p is said to give improved performance, including a 2-times sequential read and a 20% endurance boost. To meet normal processing demands, the Intel SSD 670p has been optimized for low queue depth and mixed workloads.
9. What pricing options are available for accessing the report?
Pricing options include single-user, multi-user, and enterprise licenses priced at USD 3800, USD 4500, and USD 5800 respectively.
10. Is the market size provided in terms of value or volume?
The market size is provided in terms of value, measured in Million.
11. Are there any specific market keywords associated with the report?
Yes, the market keyword associated with the report is "NA SSD Caching Market," which aids in identifying and referencing the specific market segment covered.
12. How do I determine which pricing option suits my needs best?
The pricing options vary based on user requirements and access needs. Individual users may opt for single-user licenses, while businesses requiring broader access may choose multi-user or enterprise licenses for cost-effective access to the report.
13. Are there any additional resources or data provided in the NA SSD Caching Market report?
While the report offers comprehensive insights, it's advisable to review the specific contents or supplementary materials provided to ascertain if additional resources or data are available.
14. How can I stay updated on further developments or reports in the NA SSD Caching Market?
To stay informed about further developments, trends, and reports in the NA SSD Caching Market, consider subscribing to industry newsletters, following relevant companies and organizations, or regularly checking reputable industry news sources and publications.
Methodology
Step 1 - Identification of Relevant Samples Size from Population Database


Step 2 - Approaches for Defining Global Market Size (Value, Volume* & Price*)

Note*: In applicable scenarios
Step 3 - Data Sources
Primary Research
- Web Analytics
- Survey Reports
- Research Institute
- Latest Research Reports
- Opinion Leaders
Secondary Research
- Annual Reports
- White Paper
- Latest Press Release
- Industry Association
- Paid Database
- Investor Presentations

Step 4 - Data Triangulation
Involves using different sources of information in order to increase the validity of a study
These sources are likely to be stakeholders in a program - participants, other researchers, program staff, other community members, and so on.
Then we put all data in single framework & apply various statistical tools to find out the dynamic on the market.
During the analysis stage, feedback from the stakeholder groups would be compared to determine areas of agreement as well as areas of divergence


