
Key Insights
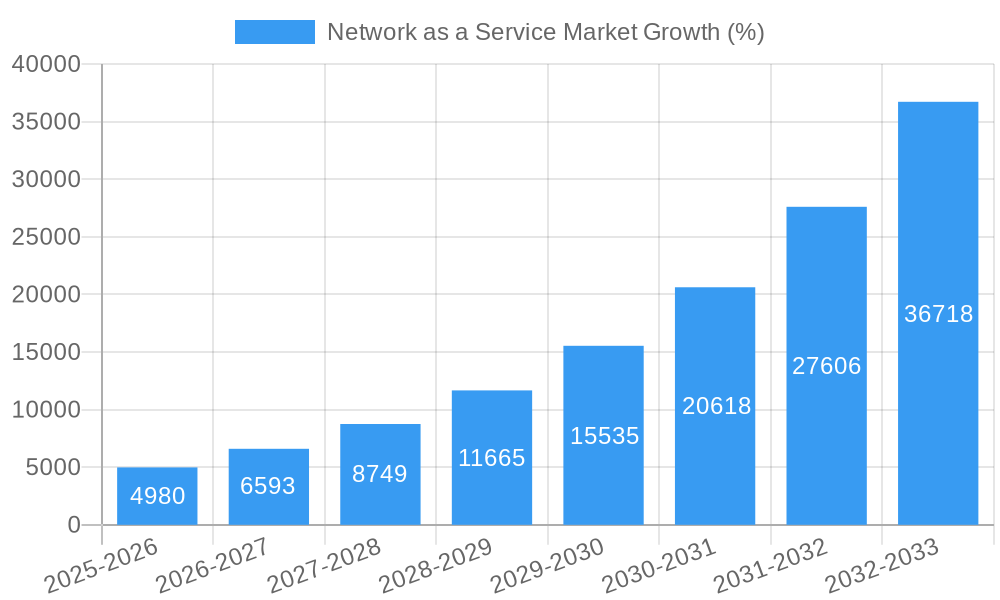
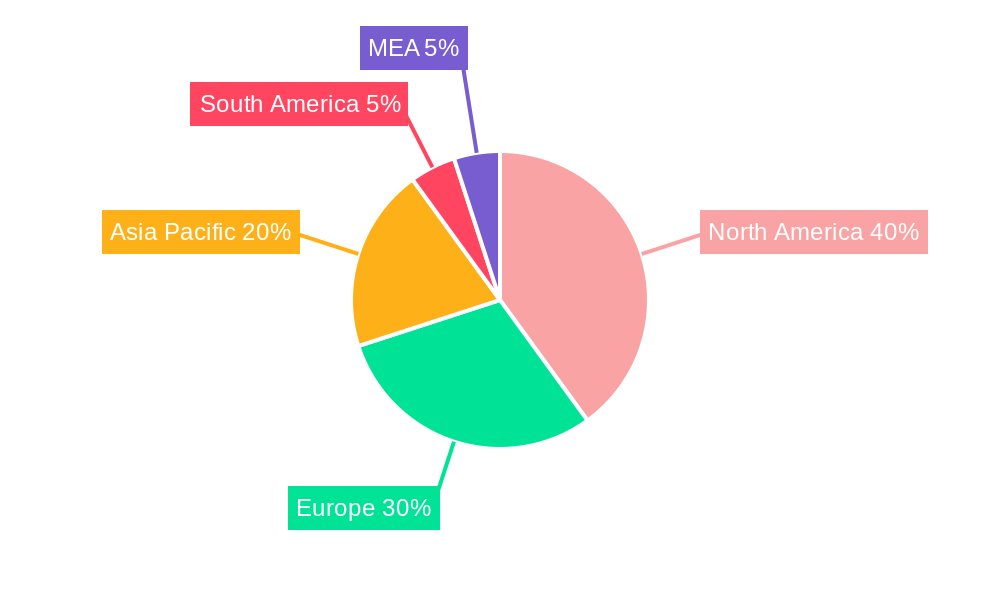
The Network as a Service (NaaS) market is experiencing robust growth, fueled by the increasing adoption of cloud computing, the demand for flexible and scalable IT infrastructure, and the rising need for enhanced network security. The market's Compound Annual Growth Rate (CAGR) of 32.36% from 2019 to 2024 suggests a significant expansion, projected to continue in the forecast period (2025-2033). Key drivers include the migration to hybrid and multi-cloud environments, the need for improved network agility and efficiency, and the growing preference for subscription-based IT services. The diverse range of NaaS offerings, encompassing LAN-as-a-Service, WAN-as-a-Service, and various application-specific solutions like vCPE and Bandwidth on Demand (BoD), caters to a broad spectrum of industries, including healthcare, BFSI, and IT & Telecom. The segment breakdown reveals strong demand across all application types and industry verticals, signifying the pervasive influence of NaaS across the business landscape. Geographical distribution indicates a substantial market presence in North America and Europe, with Asia Pacific showing significant potential for future growth driven by rapid digital transformation and infrastructure development in emerging economies.
While the market enjoys significant momentum, potential restraints include concerns regarding security and data privacy, integration complexities, and the need for robust vendor management. However, ongoing technological advancements, increasing awareness of NaaS benefits, and the proactive efforts of key market players like Telstra, AT&T, Cisco, and others in developing innovative solutions are expected to mitigate these challenges. The substantial investment in 5G and edge computing infrastructure further boosts market prospects, underpinning the long-term growth trajectory of the NaaS sector. Competition is intense, with established players and emerging niche providers vying for market share. Successful strategies will rely on delivering superior security features, strong customer support, and tailored solutions that address specific industry needs. The market's future success hinges on addressing evolving customer demands for improved performance, reliability, and cost-effectiveness.
Network as a Service (NaaS) Market Report: 2019-2033
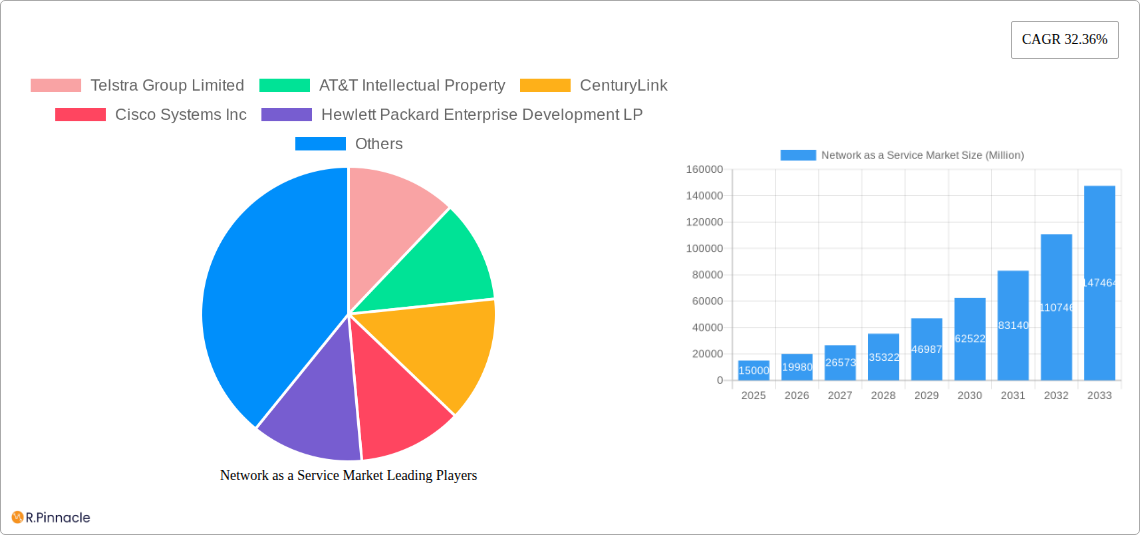
This comprehensive report provides a detailed analysis of the Network as a Service (NaaS) market, offering invaluable insights for industry professionals, investors, and strategic decision-makers. The study period covers 2019-2033, with a base year of 2025 and a forecast period of 2025-2033. The report leverages extensive data analysis and expert insights to paint a clear picture of current market dynamics and future growth trajectories. Key players like Telstra Group Limited, AT&T Intellectual Property, and Cisco Systems Inc. are analyzed in depth, alongside emerging trends and challenges. Market sizing in Millions is provided throughout.
Network as a Service Market Structure & Innovation Trends
The NaaS market exhibits a moderately concentrated structure, with a few dominant players holding significant market share, though many smaller niche players also exist. Market share data for 2024 indicates that the top five players collectively hold approximately xx% of the market. Significant innovation is driven by advancements in cloud computing, software-defined networking (SDN), and network function virtualization (NFV), enabling more flexible, scalable, and cost-effective network solutions. Regulatory frameworks, particularly around data privacy and security, play a crucial role in shaping market growth. Product substitutes, primarily traditional on-premise network solutions, continue to compete, though their market share is gradually diminishing. End-user demographics are shifting towards cloud-centric businesses and enterprises seeking agility and efficiency.
Key Observations:
- High M&A activity, with several significant deals exceeding xx Million in value in the past three years.
- Increasing adoption of SDN and NFV is disrupting traditional networking models.
- Regulatory compliance and security concerns are paramount for market participants.
- The market is witnessing increased competition from both established players and new entrants.
Network as a Service Market Market Dynamics & Trends
The NaaS market is experiencing robust growth, driven by the increasing adoption of cloud-based services, the growing need for secure and reliable network connectivity, and the rising demand for flexible and scalable network solutions across various industry verticals. The market's Compound Annual Growth Rate (CAGR) is projected to be xx% during the forecast period (2025-2033). Technological disruptions, primarily fueled by advancements in 5G, edge computing, and AI, are further accelerating market growth and creating new opportunities. Consumer preferences are leaning towards simplified network management, improved security, and cost optimization, impacting the demand for advanced NaaS features and services. Intense competitive dynamics, marked by both organic growth initiatives and strategic acquisitions, are shaping the market landscape. Market penetration is expected to reach xx% by 2033.
Dominant Regions & Segments in Network as a Service Market
The North American region currently holds the largest market share, followed by Europe and Asia-Pacific. Key growth drivers in these regions include robust digital transformation initiatives, increasing investments in advanced infrastructure, and supportive government policies.
Dominant Segments:
By Type: WAN-as-a-Service (WANaaS) is currently the dominant segment, driven by the increasing demand for secure and reliable wide area network connectivity. LAN-as-a-Service (LANaaS) is also witnessing significant growth, primarily fueled by the adoption of cloud-based solutions.
By Application: Cloud-based services (vCPE) hold the largest market share, followed by Integrated Network Security-as-a-Service. The demand for Bandwidth on Demand (BoD) is also growing steadily, driven by the increasing need for flexible and scalable network capacity.
By Industry Vertical: The IT and Telecom sector is currently the largest consumer of NaaS solutions, followed by the BFSI (Banking, Financial Services, and Insurance) sector. However, other verticals like Healthcare, Retail, and Manufacturing are witnessing rapid growth in NaaS adoption due to increasing digitization and the need for enhanced operational efficiency.
Key Drivers for Regional Dominance:
- North America: High technological adoption rates, robust IT infrastructure, and the presence of major technology vendors.
- Europe: Growing investments in digital infrastructure, supportive regulatory environment, and increasing demand for secure network solutions.
- Asia-Pacific: Rapid digitalization across various industries, increasing mobile penetration, and rising government investments in 5G infrastructure.
Network as a Service Market Product Innovations
Recent product innovations are centered around enhanced security features, improved scalability, and greater integration with cloud-based platforms. The market is witnessing the emergence of AI-powered network management tools and automation solutions. These advancements are improving network performance, simplifying network management, and reducing operational costs, leading to a greater market fit and significant competitive advantages for vendors offering these features.
Report Scope & Segmentation Analysis
This report comprehensively analyzes the NaaS market across various segments:
By Type: LANaaS and WANaaS, with detailed growth projections and market size estimations for each segment. Competitive dynamics within each segment are also explored.
By Application: Cloud-based Services (vCPE), Bandwidth on Demand (BoD), Integrated Network Security-as-a-Service, Wide Area Network (WAN), and Virtual Private Network (VPN), with analysis of their market sizes and growth trajectories.
By Industry Vertical: Healthcare, BFSI, Retail and E-commerce, IT and Telecom, Manufacturing, Transportation and Logistics, and Public Sector, with specific insights into the growth drivers and challenges for each vertical.
Key Drivers of Network as a Service Market Growth
The key drivers behind the NaaS market's growth include:
- Technological advancements: SDN, NFV, 5G, and edge computing are revolutionizing network infrastructure.
- Increased cloud adoption: Businesses are increasingly migrating their operations to the cloud, creating a surge in demand for NaaS.
- Cost optimization: NaaS offers significant cost savings compared to traditional on-premise solutions.
- Enhanced security: NaaS providers offer advanced security features that protect against cyber threats.
- Improved scalability and flexibility: NaaS solutions can be easily scaled up or down based on changing business needs.
Challenges in the Network as a Service Market Sector
The NaaS market faces several challenges:
- Security concerns: Data breaches and cyberattacks pose a significant threat to NaaS providers and their customers.
- Interoperability issues: The lack of standardization can hinder seamless integration between different NaaS solutions.
- Vendor lock-in: Businesses may face challenges in switching providers once they have invested in a specific NaaS platform.
- Regulatory compliance: Compliance with data privacy regulations can add complexity and costs for NaaS providers.
Emerging Opportunities in Network as a Service Market
The NaaS market presents numerous emerging opportunities, including:
- Expansion into new markets: NaaS has the potential to penetrate underserved regions and industries.
- Integration with IoT: The growing number of IoT devices creates opportunities for NaaS providers to offer connected services.
- Development of specialized NaaS solutions: tailored to specific industry verticals.
- AI-powered network management: leveraging AI for improved network efficiency and automation.
Leading Players in the Network as a Service Market Market
- Telstra Group Limited
- AT&T Intellectual Property
- CenturyLink
- Cisco Systems Inc
- Hewlett Packard Enterprise Development LP
- GTT Communications Inc
- Juniper Networks Inc
- Masergy Communications Inc
- DXC Technology Company
- NEC Corporation
- Broadcom
- Meta Networks Ltd (Proofpoint)
- TD SYNNEX Corporation
- VMware Inc
- Akamai Technologies
- Oracle
- Verizon
- Nokia (Alcatel Lucent)
- IBM
Key Developments in Network as a Service Market Industry
- March 2023: Akamai Technologies announced an agreement to acquire Ondat, strengthening its cloud computing offerings.
- November 2022: GDS partnered with DCConnect to provide connectivity and network automation solutions using SDN, expanding its reach in Asia.
- August 2022: Nokia partnered with Furukawa Electric LatAm to expand its optical LAN solutions, securing over 450 enterprise customers.
Future Outlook for Network as a Service Market Market
The NaaS market is poised for continued strong growth, driven by ongoing technological advancements, increasing cloud adoption, and the expanding need for flexible and secure network solutions. Strategic partnerships, acquisitions, and the development of innovative solutions will be key factors shaping the market's future. The market's potential lies in its ability to provide businesses with scalable, cost-effective, and secure network infrastructure, enabling them to thrive in an increasingly interconnected world. The integration of emerging technologies such as AI and edge computing will unlock further opportunities, creating a dynamic and rapidly evolving market landscape.
Network as a Service Market Segmentation
-
1. Type
- 1.1. LaaS
- 1.2. WaaS
- 1.3. cloud-based services (vCPE)
- 1.4. BoD
- 1.5. managed network security services
-
2. Application
- 2.1. Cloud-based services
- 2.2. mobility
- 2.3. IoT
- 2.4. security
- 2.5. WAN optimization
-
3. Industry Vertical
- 3.1. Healthcare
- 3.2. BFSI
- 3.3. Retail and E-commerce
- 3.4. IT and Telecom
- 3.5. Manufacturing
- 3.6. Transportation and Logistics
- 3.7. Public Sector
Network as a Service Market Segmentation By Geography
-
1. North America
- 1.1. United States
- 1.2. Canada
-
2. Europe
- 2.1. United Kingdom
- 2.2. Germany
- 2.3. France
- 2.4. Rest of Europe
-
3. Asia Pacific
- 3.1. China
- 3.2. Japan
- 3.3. India
- 3.4. Rest of Asia Pacific
-
4. Latin America
- 4.1. Brazil
- 4.2. Argentina
- 4.3. Mexico
- 4.4. Rest of Latin America
-
5. Middle East and Africa
- 5.1. United Arab Emirates
- 5.2. Saudi Arabia
- 5.3. Rest of Middle East and Africa
Network as a Service Market REPORT HIGHLIGHTS
| Aspects | Details |
|---|---|
| Study Period | 2019-2033 |
| Base Year | 2024 |
| Estimated Year | 2025 |
| Forecast Period | 2025-2033 |
| Historical Period | 2019-2024 |
| Growth Rate | CAGR of 32.36% from 2019-2033 |
| Segmentation |
|
Table of Contents
- 1. Introduction
- 1.1. Research Scope
- 1.2. Market Segmentation
- 1.3. Research Methodology
- 1.4. Definitions and Assumptions
- 2. Executive Summary
- 2.1. Introduction
- 3. Market Dynamics
- 3.1. Introduction
- 3.2. Market Drivers
- 3.2.1. Increased Adoption of Cloud Services among Enterprises; Augmentation in Software-defined Networking (SDN) Integration with Existing Network Infrastructure
- 3.3. Market Restrains
- 3.3.1. Privacy and Data Security Concerns
- 3.4. Market Trends
- 3.4.1. Increased Adoption of Cloud Services among Enterprises to Drive the Market
- 4. Market Factor Analysis
- 4.1. Porters Five Forces
- 4.2. Supply/Value Chain
- 4.3. PESTEL analysis
- 4.4. Market Entropy
- 4.5. Patent/Trademark Analysis
- 5. Global Network as a Service Market Analysis, Insights and Forecast, 2019-2031
- 5.1. Market Analysis, Insights and Forecast - by Type
- 5.1.1. LaaS
- 5.1.2. WaaS
- 5.1.3. cloud-based services (vCPE)
- 5.1.4. BoD
- 5.1.5. managed network security services
- 5.2. Market Analysis, Insights and Forecast - by Application
- 5.2.1. Cloud-based services
- 5.2.2. mobility
- 5.2.3. IoT
- 5.2.4. security
- 5.2.5. WAN optimization
- 5.3. Market Analysis, Insights and Forecast - by Industry Vertical
- 5.3.1. Healthcare
- 5.3.2. BFSI
- 5.3.3. Retail and E-commerce
- 5.3.4. IT and Telecom
- 5.3.5. Manufacturing
- 5.3.6. Transportation and Logistics
- 5.3.7. Public Sector
- 5.4. Market Analysis, Insights and Forecast - by Region
- 5.4.1. North America
- 5.4.2. Europe
- 5.4.3. Asia Pacific
- 5.4.4. Latin America
- 5.4.5. Middle East and Africa
- 5.1. Market Analysis, Insights and Forecast - by Type
- 6. North America Network as a Service Market Analysis, Insights and Forecast, 2019-2031
- 6.1. Market Analysis, Insights and Forecast - by Type
- 6.1.1. LaaS
- 6.1.2. WaaS
- 6.1.3. cloud-based services (vCPE)
- 6.1.4. BoD
- 6.1.5. managed network security services
- 6.2. Market Analysis, Insights and Forecast - by Application
- 6.2.1. Cloud-based services
- 6.2.2. mobility
- 6.2.3. IoT
- 6.2.4. security
- 6.2.5. WAN optimization
- 6.3. Market Analysis, Insights and Forecast - by Industry Vertical
- 6.3.1. Healthcare
- 6.3.2. BFSI
- 6.3.3. Retail and E-commerce
- 6.3.4. IT and Telecom
- 6.3.5. Manufacturing
- 6.3.6. Transportation and Logistics
- 6.3.7. Public Sector
- 6.1. Market Analysis, Insights and Forecast - by Type
- 7. Europe Network as a Service Market Analysis, Insights and Forecast, 2019-2031
- 7.1. Market Analysis, Insights and Forecast - by Type
- 7.1.1. LaaS
- 7.1.2. WaaS
- 7.1.3. cloud-based services (vCPE)
- 7.1.4. BoD
- 7.1.5. managed network security services
- 7.2. Market Analysis, Insights and Forecast - by Application
- 7.2.1. Cloud-based services
- 7.2.2. mobility
- 7.2.3. IoT
- 7.2.4. security
- 7.2.5. WAN optimization
- 7.3. Market Analysis, Insights and Forecast - by Industry Vertical
- 7.3.1. Healthcare
- 7.3.2. BFSI
- 7.3.3. Retail and E-commerce
- 7.3.4. IT and Telecom
- 7.3.5. Manufacturing
- 7.3.6. Transportation and Logistics
- 7.3.7. Public Sector
- 7.1. Market Analysis, Insights and Forecast - by Type
- 8. Asia Pacific Network as a Service Market Analysis, Insights and Forecast, 2019-2031
- 8.1. Market Analysis, Insights and Forecast - by Type
- 8.1.1. LaaS
- 8.1.2. WaaS
- 8.1.3. cloud-based services (vCPE)
- 8.1.4. BoD
- 8.1.5. managed network security services
- 8.2. Market Analysis, Insights and Forecast - by Application
- 8.2.1. Cloud-based services
- 8.2.2. mobility
- 8.2.3. IoT
- 8.2.4. security
- 8.2.5. WAN optimization
- 8.3. Market Analysis, Insights and Forecast - by Industry Vertical
- 8.3.1. Healthcare
- 8.3.2. BFSI
- 8.3.3. Retail and E-commerce
- 8.3.4. IT and Telecom
- 8.3.5. Manufacturing
- 8.3.6. Transportation and Logistics
- 8.3.7. Public Sector
- 8.1. Market Analysis, Insights and Forecast - by Type
- 9. Latin America Network as a Service Market Analysis, Insights and Forecast, 2019-2031
- 9.1. Market Analysis, Insights and Forecast - by Type
- 9.1.1. LaaS
- 9.1.2. WaaS
- 9.1.3. cloud-based services (vCPE)
- 9.1.4. BoD
- 9.1.5. managed network security services
- 9.2. Market Analysis, Insights and Forecast - by Application
- 9.2.1. Cloud-based services
- 9.2.2. mobility
- 9.2.3. IoT
- 9.2.4. security
- 9.2.5. WAN optimization
- 9.3. Market Analysis, Insights and Forecast - by Industry Vertical
- 9.3.1. Healthcare
- 9.3.2. BFSI
- 9.3.3. Retail and E-commerce
- 9.3.4. IT and Telecom
- 9.3.5. Manufacturing
- 9.3.6. Transportation and Logistics
- 9.3.7. Public Sector
- 9.1. Market Analysis, Insights and Forecast - by Type
- 10. Middle East and Africa Network as a Service Market Analysis, Insights and Forecast, 2019-2031
- 10.1. Market Analysis, Insights and Forecast - by Type
- 10.1.1. LaaS
- 10.1.2. WaaS
- 10.1.3. cloud-based services (vCPE)
- 10.1.4. BoD
- 10.1.5. managed network security services
- 10.2. Market Analysis, Insights and Forecast - by Application
- 10.2.1. Cloud-based services
- 10.2.2. mobility
- 10.2.3. IoT
- 10.2.4. security
- 10.2.5. WAN optimization
- 10.3. Market Analysis, Insights and Forecast - by Industry Vertical
- 10.3.1. Healthcare
- 10.3.2. BFSI
- 10.3.3. Retail and E-commerce
- 10.3.4. IT and Telecom
- 10.3.5. Manufacturing
- 10.3.6. Transportation and Logistics
- 10.3.7. Public Sector
- 10.1. Market Analysis, Insights and Forecast - by Type
- 11. North America Network as a Service Market Analysis, Insights and Forecast, 2019-2031
- 11.1. Market Analysis, Insights and Forecast - By Country/Sub-region
- 11.1.1 United States
- 11.1.2 Canada
- 11.1.3 Mexico
- 12. Europe Network as a Service Market Analysis, Insights and Forecast, 2019-2031
- 12.1. Market Analysis, Insights and Forecast - By Country/Sub-region
- 12.1.1 Germany
- 12.1.2 United Kingdom
- 12.1.3 France
- 12.1.4 Spain
- 12.1.5 Italy
- 12.1.6 Spain
- 12.1.7 Belgium
- 12.1.8 Netherland
- 12.1.9 Nordics
- 12.1.10 Rest of Europe
- 13. Asia Pacific Network as a Service Market Analysis, Insights and Forecast, 2019-2031
- 13.1. Market Analysis, Insights and Forecast - By Country/Sub-region
- 13.1.1 China
- 13.1.2 Japan
- 13.1.3 India
- 13.1.4 South Korea
- 13.1.5 Southeast Asia
- 13.1.6 Australia
- 13.1.7 Indonesia
- 13.1.8 Phillipes
- 13.1.9 Singapore
- 13.1.10 Thailandc
- 13.1.11 Rest of Asia Pacific
- 14. South America Network as a Service Market Analysis, Insights and Forecast, 2019-2031
- 14.1. Market Analysis, Insights and Forecast - By Country/Sub-region
- 14.1.1 Brazil
- 14.1.2 Argentina
- 14.1.3 Peru
- 14.1.4 Chile
- 14.1.5 Colombia
- 14.1.6 Ecuador
- 14.1.7 Venezuela
- 14.1.8 Rest of South America
- 15. North America Network as a Service Market Analysis, Insights and Forecast, 2019-2031
- 15.1. Market Analysis, Insights and Forecast - By Country/Sub-region
- 15.1.1 United States
- 15.1.2 Canada
- 15.1.3 Mexico
- 16. MEA Network as a Service Market Analysis, Insights and Forecast, 2019-2031
- 16.1. Market Analysis, Insights and Forecast - By Country/Sub-region
- 16.1.1 United Arab Emirates
- 16.1.2 Saudi Arabia
- 16.1.3 South Africa
- 16.1.4 Rest of Middle East and Africa
- 17. Competitive Analysis
- 17.1. Global Market Share Analysis 2024
- 17.2. Company Profiles
- 17.2.1 Telstra Group Limited
- 17.2.1.1. Overview
- 17.2.1.2. Products
- 17.2.1.3. SWOT Analysis
- 17.2.1.4. Recent Developments
- 17.2.1.5. Financials (Based on Availability)
- 17.2.2 AT&T Intellectual Property
- 17.2.2.1. Overview
- 17.2.2.2. Products
- 17.2.2.3. SWOT Analysis
- 17.2.2.4. Recent Developments
- 17.2.2.5. Financials (Based on Availability)
- 17.2.3 CenturyLink
- 17.2.3.1. Overview
- 17.2.3.2. Products
- 17.2.3.3. SWOT Analysis
- 17.2.3.4. Recent Developments
- 17.2.3.5. Financials (Based on Availability)
- 17.2.4 Cisco Systems Inc
- 17.2.4.1. Overview
- 17.2.4.2. Products
- 17.2.4.3. SWOT Analysis
- 17.2.4.4. Recent Developments
- 17.2.4.5. Financials (Based on Availability)
- 17.2.5 Hewlett Packard Enterprise Development LP
- 17.2.5.1. Overview
- 17.2.5.2. Products
- 17.2.5.3. SWOT Analysis
- 17.2.5.4. Recent Developments
- 17.2.5.5. Financials (Based on Availability)
- 17.2.6 GTT Communications Inc
- 17.2.6.1. Overview
- 17.2.6.2. Products
- 17.2.6.3. SWOT Analysis
- 17.2.6.4. Recent Developments
- 17.2.6.5. Financials (Based on Availability)
- 17.2.7 Juniper Networks Inc
- 17.2.7.1. Overview
- 17.2.7.2. Products
- 17.2.7.3. SWOT Analysis
- 17.2.7.4. Recent Developments
- 17.2.7.5. Financials (Based on Availability)
- 17.2.8 Masergy Communications Inc
- 17.2.8.1. Overview
- 17.2.8.2. Products
- 17.2.8.3. SWOT Analysis
- 17.2.8.4. Recent Developments
- 17.2.8.5. Financials (Based on Availability)
- 17.2.9 DXC Technology Company
- 17.2.9.1. Overview
- 17.2.9.2. Products
- 17.2.9.3. SWOT Analysis
- 17.2.9.4. Recent Developments
- 17.2.9.5. Financials (Based on Availability)
- 17.2.10 NEC Corporation
- 17.2.10.1. Overview
- 17.2.10.2. Products
- 17.2.10.3. SWOT Analysis
- 17.2.10.4. Recent Developments
- 17.2.10.5. Financials (Based on Availability)
- 17.2.11 Broadcom
- 17.2.11.1. Overview
- 17.2.11.2. Products
- 17.2.11.3. SWOT Analysis
- 17.2.11.4. Recent Developments
- 17.2.11.5. Financials (Based on Availability)
- 17.2.12 Meta Networks Ltd (Proofpoint)
- 17.2.12.1. Overview
- 17.2.12.2. Products
- 17.2.12.3. SWOT Analysis
- 17.2.12.4. Recent Developments
- 17.2.12.5. Financials (Based on Availability)
- 17.2.13 TD SYNNEX Corporation
- 17.2.13.1. Overview
- 17.2.13.2. Products
- 17.2.13.3. SWOT Analysis
- 17.2.13.4. Recent Developments
- 17.2.13.5. Financials (Based on Availability)
- 17.2.14 VMware Inc
- 17.2.14.1. Overview
- 17.2.14.2. Products
- 17.2.14.3. SWOT Analysis
- 17.2.14.4. Recent Developments
- 17.2.14.5. Financials (Based on Availability)
- 17.2.15 Akamai Technologie
- 17.2.15.1. Overview
- 17.2.15.2. Products
- 17.2.15.3. SWOT Analysis
- 17.2.15.4. Recent Developments
- 17.2.15.5. Financials (Based on Availability)
- 17.2.16 Oracle
- 17.2.16.1. Overview
- 17.2.16.2. Products
- 17.2.16.3. SWOT Analysis
- 17.2.16.4. Recent Developments
- 17.2.16.5. Financials (Based on Availability)
- 17.2.17 Verizon
- 17.2.17.1. Overview
- 17.2.17.2. Products
- 17.2.17.3. SWOT Analysis
- 17.2.17.4. Recent Developments
- 17.2.17.5. Financials (Based on Availability)
- 17.2.18 Nokia (Alcatel Lucent)
- 17.2.18.1. Overview
- 17.2.18.2. Products
- 17.2.18.3. SWOT Analysis
- 17.2.18.4. Recent Developments
- 17.2.18.5. Financials (Based on Availability)
- 17.2.19 IBM
- 17.2.19.1. Overview
- 17.2.19.2. Products
- 17.2.19.3. SWOT Analysis
- 17.2.19.4. Recent Developments
- 17.2.19.5. Financials (Based on Availability)
- 17.2.1 Telstra Group Limited
List of Figures
- Figure 1: Global Network as a Service Market Revenue Breakdown (Million, %) by Region 2024 & 2032
- Figure 2: Global Network as a Service Market Volume Breakdown (K Unit, %) by Region 2024 & 2032
- Figure 3: North America Network as a Service Market Revenue (Million), by Country 2024 & 2032
- Figure 4: North America Network as a Service Market Volume (K Unit), by Country 2024 & 2032
- Figure 5: North America Network as a Service Market Revenue Share (%), by Country 2024 & 2032
- Figure 6: North America Network as a Service Market Volume Share (%), by Country 2024 & 2032
- Figure 7: Europe Network as a Service Market Revenue (Million), by Country 2024 & 2032
- Figure 8: Europe Network as a Service Market Volume (K Unit), by Country 2024 & 2032
- Figure 9: Europe Network as a Service Market Revenue Share (%), by Country 2024 & 2032
- Figure 10: Europe Network as a Service Market Volume Share (%), by Country 2024 & 2032
- Figure 11: Asia Pacific Network as a Service Market Revenue (Million), by Country 2024 & 2032
- Figure 12: Asia Pacific Network as a Service Market Volume (K Unit), by Country 2024 & 2032
- Figure 13: Asia Pacific Network as a Service Market Revenue Share (%), by Country 2024 & 2032
- Figure 14: Asia Pacific Network as a Service Market Volume Share (%), by Country 2024 & 2032
- Figure 15: South America Network as a Service Market Revenue (Million), by Country 2024 & 2032
- Figure 16: South America Network as a Service Market Volume (K Unit), by Country 2024 & 2032
- Figure 17: South America Network as a Service Market Revenue Share (%), by Country 2024 & 2032
- Figure 18: South America Network as a Service Market Volume Share (%), by Country 2024 & 2032
- Figure 19: North America Network as a Service Market Revenue (Million), by Country 2024 & 2032
- Figure 20: North America Network as a Service Market Volume (K Unit), by Country 2024 & 2032
- Figure 21: North America Network as a Service Market Revenue Share (%), by Country 2024 & 2032
- Figure 22: North America Network as a Service Market Volume Share (%), by Country 2024 & 2032
- Figure 23: MEA Network as a Service Market Revenue (Million), by Country 2024 & 2032
- Figure 24: MEA Network as a Service Market Volume (K Unit), by Country 2024 & 2032
- Figure 25: MEA Network as a Service Market Revenue Share (%), by Country 2024 & 2032
- Figure 26: MEA Network as a Service Market Volume Share (%), by Country 2024 & 2032
- Figure 27: North America Network as a Service Market Revenue (Million), by Type 2024 & 2032
- Figure 28: North America Network as a Service Market Volume (K Unit), by Type 2024 & 2032
- Figure 29: North America Network as a Service Market Revenue Share (%), by Type 2024 & 2032
- Figure 30: North America Network as a Service Market Volume Share (%), by Type 2024 & 2032
- Figure 31: North America Network as a Service Market Revenue (Million), by Application 2024 & 2032
- Figure 32: North America Network as a Service Market Volume (K Unit), by Application 2024 & 2032
- Figure 33: North America Network as a Service Market Revenue Share (%), by Application 2024 & 2032
- Figure 34: North America Network as a Service Market Volume Share (%), by Application 2024 & 2032
- Figure 35: North America Network as a Service Market Revenue (Million), by Industry Vertical 2024 & 2032
- Figure 36: North America Network as a Service Market Volume (K Unit), by Industry Vertical 2024 & 2032
- Figure 37: North America Network as a Service Market Revenue Share (%), by Industry Vertical 2024 & 2032
- Figure 38: North America Network as a Service Market Volume Share (%), by Industry Vertical 2024 & 2032
- Figure 39: North America Network as a Service Market Revenue (Million), by Country 2024 & 2032
- Figure 40: North America Network as a Service Market Volume (K Unit), by Country 2024 & 2032
- Figure 41: North America Network as a Service Market Revenue Share (%), by Country 2024 & 2032
- Figure 42: North America Network as a Service Market Volume Share (%), by Country 2024 & 2032
- Figure 43: Europe Network as a Service Market Revenue (Million), by Type 2024 & 2032
- Figure 44: Europe Network as a Service Market Volume (K Unit), by Type 2024 & 2032
- Figure 45: Europe Network as a Service Market Revenue Share (%), by Type 2024 & 2032
- Figure 46: Europe Network as a Service Market Volume Share (%), by Type 2024 & 2032
- Figure 47: Europe Network as a Service Market Revenue (Million), by Application 2024 & 2032
- Figure 48: Europe Network as a Service Market Volume (K Unit), by Application 2024 & 2032
- Figure 49: Europe Network as a Service Market Revenue Share (%), by Application 2024 & 2032
- Figure 50: Europe Network as a Service Market Volume Share (%), by Application 2024 & 2032
- Figure 51: Europe Network as a Service Market Revenue (Million), by Industry Vertical 2024 & 2032
- Figure 52: Europe Network as a Service Market Volume (K Unit), by Industry Vertical 2024 & 2032
- Figure 53: Europe Network as a Service Market Revenue Share (%), by Industry Vertical 2024 & 2032
- Figure 54: Europe Network as a Service Market Volume Share (%), by Industry Vertical 2024 & 2032
- Figure 55: Europe Network as a Service Market Revenue (Million), by Country 2024 & 2032
- Figure 56: Europe Network as a Service Market Volume (K Unit), by Country 2024 & 2032
- Figure 57: Europe Network as a Service Market Revenue Share (%), by Country 2024 & 2032
- Figure 58: Europe Network as a Service Market Volume Share (%), by Country 2024 & 2032
- Figure 59: Asia Pacific Network as a Service Market Revenue (Million), by Type 2024 & 2032
- Figure 60: Asia Pacific Network as a Service Market Volume (K Unit), by Type 2024 & 2032
- Figure 61: Asia Pacific Network as a Service Market Revenue Share (%), by Type 2024 & 2032
- Figure 62: Asia Pacific Network as a Service Market Volume Share (%), by Type 2024 & 2032
- Figure 63: Asia Pacific Network as a Service Market Revenue (Million), by Application 2024 & 2032
- Figure 64: Asia Pacific Network as a Service Market Volume (K Unit), by Application 2024 & 2032
- Figure 65: Asia Pacific Network as a Service Market Revenue Share (%), by Application 2024 & 2032
- Figure 66: Asia Pacific Network as a Service Market Volume Share (%), by Application 2024 & 2032
- Figure 67: Asia Pacific Network as a Service Market Revenue (Million), by Industry Vertical 2024 & 2032
- Figure 68: Asia Pacific Network as a Service Market Volume (K Unit), by Industry Vertical 2024 & 2032
- Figure 69: Asia Pacific Network as a Service Market Revenue Share (%), by Industry Vertical 2024 & 2032
- Figure 70: Asia Pacific Network as a Service Market Volume Share (%), by Industry Vertical 2024 & 2032
- Figure 71: Asia Pacific Network as a Service Market Revenue (Million), by Country 2024 & 2032
- Figure 72: Asia Pacific Network as a Service Market Volume (K Unit), by Country 2024 & 2032
- Figure 73: Asia Pacific Network as a Service Market Revenue Share (%), by Country 2024 & 2032
- Figure 74: Asia Pacific Network as a Service Market Volume Share (%), by Country 2024 & 2032
- Figure 75: Latin America Network as a Service Market Revenue (Million), by Type 2024 & 2032
- Figure 76: Latin America Network as a Service Market Volume (K Unit), by Type 2024 & 2032
- Figure 77: Latin America Network as a Service Market Revenue Share (%), by Type 2024 & 2032
- Figure 78: Latin America Network as a Service Market Volume Share (%), by Type 2024 & 2032
- Figure 79: Latin America Network as a Service Market Revenue (Million), by Application 2024 & 2032
- Figure 80: Latin America Network as a Service Market Volume (K Unit), by Application 2024 & 2032
- Figure 81: Latin America Network as a Service Market Revenue Share (%), by Application 2024 & 2032
- Figure 82: Latin America Network as a Service Market Volume Share (%), by Application 2024 & 2032
- Figure 83: Latin America Network as a Service Market Revenue (Million), by Industry Vertical 2024 & 2032
- Figure 84: Latin America Network as a Service Market Volume (K Unit), by Industry Vertical 2024 & 2032
- Figure 85: Latin America Network as a Service Market Revenue Share (%), by Industry Vertical 2024 & 2032
- Figure 86: Latin America Network as a Service Market Volume Share (%), by Industry Vertical 2024 & 2032
- Figure 87: Latin America Network as a Service Market Revenue (Million), by Country 2024 & 2032
- Figure 88: Latin America Network as a Service Market Volume (K Unit), by Country 2024 & 2032
- Figure 89: Latin America Network as a Service Market Revenue Share (%), by Country 2024 & 2032
- Figure 90: Latin America Network as a Service Market Volume Share (%), by Country 2024 & 2032
- Figure 91: Middle East and Africa Network as a Service Market Revenue (Million), by Type 2024 & 2032
- Figure 92: Middle East and Africa Network as a Service Market Volume (K Unit), by Type 2024 & 2032
- Figure 93: Middle East and Africa Network as a Service Market Revenue Share (%), by Type 2024 & 2032
- Figure 94: Middle East and Africa Network as a Service Market Volume Share (%), by Type 2024 & 2032
- Figure 95: Middle East and Africa Network as a Service Market Revenue (Million), by Application 2024 & 2032
- Figure 96: Middle East and Africa Network as a Service Market Volume (K Unit), by Application 2024 & 2032
- Figure 97: Middle East and Africa Network as a Service Market Revenue Share (%), by Application 2024 & 2032
- Figure 98: Middle East and Africa Network as a Service Market Volume Share (%), by Application 2024 & 2032
- Figure 99: Middle East and Africa Network as a Service Market Revenue (Million), by Industry Vertical 2024 & 2032
- Figure 100: Middle East and Africa Network as a Service Market Volume (K Unit), by Industry Vertical 2024 & 2032
- Figure 101: Middle East and Africa Network as a Service Market Revenue Share (%), by Industry Vertical 2024 & 2032
- Figure 102: Middle East and Africa Network as a Service Market Volume Share (%), by Industry Vertical 2024 & 2032
- Figure 103: Middle East and Africa Network as a Service Market Revenue (Million), by Country 2024 & 2032
- Figure 104: Middle East and Africa Network as a Service Market Volume (K Unit), by Country 2024 & 2032
- Figure 105: Middle East and Africa Network as a Service Market Revenue Share (%), by Country 2024 & 2032
- Figure 106: Middle East and Africa Network as a Service Market Volume Share (%), by Country 2024 & 2032
List of Tables
- Table 1: Global Network as a Service Market Revenue Million Forecast, by Region 2019 & 2032
- Table 2: Global Network as a Service Market Volume K Unit Forecast, by Region 2019 & 2032
- Table 3: Global Network as a Service Market Revenue Million Forecast, by Type 2019 & 2032
- Table 4: Global Network as a Service Market Volume K Unit Forecast, by Type 2019 & 2032
- Table 5: Global Network as a Service Market Revenue Million Forecast, by Application 2019 & 2032
- Table 6: Global Network as a Service Market Volume K Unit Forecast, by Application 2019 & 2032
- Table 7: Global Network as a Service Market Revenue Million Forecast, by Industry Vertical 2019 & 2032
- Table 8: Global Network as a Service Market Volume K Unit Forecast, by Industry Vertical 2019 & 2032
- Table 9: Global Network as a Service Market Revenue Million Forecast, by Region 2019 & 2032
- Table 10: Global Network as a Service Market Volume K Unit Forecast, by Region 2019 & 2032
- Table 11: Global Network as a Service Market Revenue Million Forecast, by Country 2019 & 2032
- Table 12: Global Network as a Service Market Volume K Unit Forecast, by Country 2019 & 2032
- Table 13: United States Network as a Service Market Revenue (Million) Forecast, by Application 2019 & 2032
- Table 14: United States Network as a Service Market Volume (K Unit) Forecast, by Application 2019 & 2032
- Table 15: Canada Network as a Service Market Revenue (Million) Forecast, by Application 2019 & 2032
- Table 16: Canada Network as a Service Market Volume (K Unit) Forecast, by Application 2019 & 2032
- Table 17: Mexico Network as a Service Market Revenue (Million) Forecast, by Application 2019 & 2032
- Table 18: Mexico Network as a Service Market Volume (K Unit) Forecast, by Application 2019 & 2032
- Table 19: Global Network as a Service Market Revenue Million Forecast, by Country 2019 & 2032
- Table 20: Global Network as a Service Market Volume K Unit Forecast, by Country 2019 & 2032
- Table 21: Germany Network as a Service Market Revenue (Million) Forecast, by Application 2019 & 2032
- Table 22: Germany Network as a Service Market Volume (K Unit) Forecast, by Application 2019 & 2032
- Table 23: United Kingdom Network as a Service Market Revenue (Million) Forecast, by Application 2019 & 2032
- Table 24: United Kingdom Network as a Service Market Volume (K Unit) Forecast, by Application 2019 & 2032
- Table 25: France Network as a Service Market Revenue (Million) Forecast, by Application 2019 & 2032
- Table 26: France Network as a Service Market Volume (K Unit) Forecast, by Application 2019 & 2032
- Table 27: Spain Network as a Service Market Revenue (Million) Forecast, by Application 2019 & 2032
- Table 28: Spain Network as a Service Market Volume (K Unit) Forecast, by Application 2019 & 2032
- Table 29: Italy Network as a Service Market Revenue (Million) Forecast, by Application 2019 & 2032
- Table 30: Italy Network as a Service Market Volume (K Unit) Forecast, by Application 2019 & 2032
- Table 31: Spain Network as a Service Market Revenue (Million) Forecast, by Application 2019 & 2032
- Table 32: Spain Network as a Service Market Volume (K Unit) Forecast, by Application 2019 & 2032
- Table 33: Belgium Network as a Service Market Revenue (Million) Forecast, by Application 2019 & 2032
- Table 34: Belgium Network as a Service Market Volume (K Unit) Forecast, by Application 2019 & 2032
- Table 35: Netherland Network as a Service Market Revenue (Million) Forecast, by Application 2019 & 2032
- Table 36: Netherland Network as a Service Market Volume (K Unit) Forecast, by Application 2019 & 2032
- Table 37: Nordics Network as a Service Market Revenue (Million) Forecast, by Application 2019 & 2032
- Table 38: Nordics Network as a Service Market Volume (K Unit) Forecast, by Application 2019 & 2032
- Table 39: Rest of Europe Network as a Service Market Revenue (Million) Forecast, by Application 2019 & 2032
- Table 40: Rest of Europe Network as a Service Market Volume (K Unit) Forecast, by Application 2019 & 2032
- Table 41: Global Network as a Service Market Revenue Million Forecast, by Country 2019 & 2032
- Table 42: Global Network as a Service Market Volume K Unit Forecast, by Country 2019 & 2032
- Table 43: China Network as a Service Market Revenue (Million) Forecast, by Application 2019 & 2032
- Table 44: China Network as a Service Market Volume (K Unit) Forecast, by Application 2019 & 2032
- Table 45: Japan Network as a Service Market Revenue (Million) Forecast, by Application 2019 & 2032
- Table 46: Japan Network as a Service Market Volume (K Unit) Forecast, by Application 2019 & 2032
- Table 47: India Network as a Service Market Revenue (Million) Forecast, by Application 2019 & 2032
- Table 48: India Network as a Service Market Volume (K Unit) Forecast, by Application 2019 & 2032
- Table 49: South Korea Network as a Service Market Revenue (Million) Forecast, by Application 2019 & 2032
- Table 50: South Korea Network as a Service Market Volume (K Unit) Forecast, by Application 2019 & 2032
- Table 51: Southeast Asia Network as a Service Market Revenue (Million) Forecast, by Application 2019 & 2032
- Table 52: Southeast Asia Network as a Service Market Volume (K Unit) Forecast, by Application 2019 & 2032
- Table 53: Australia Network as a Service Market Revenue (Million) Forecast, by Application 2019 & 2032
- Table 54: Australia Network as a Service Market Volume (K Unit) Forecast, by Application 2019 & 2032
- Table 55: Indonesia Network as a Service Market Revenue (Million) Forecast, by Application 2019 & 2032
- Table 56: Indonesia Network as a Service Market Volume (K Unit) Forecast, by Application 2019 & 2032
- Table 57: Phillipes Network as a Service Market Revenue (Million) Forecast, by Application 2019 & 2032
- Table 58: Phillipes Network as a Service Market Volume (K Unit) Forecast, by Application 2019 & 2032
- Table 59: Singapore Network as a Service Market Revenue (Million) Forecast, by Application 2019 & 2032
- Table 60: Singapore Network as a Service Market Volume (K Unit) Forecast, by Application 2019 & 2032
- Table 61: Thailandc Network as a Service Market Revenue (Million) Forecast, by Application 2019 & 2032
- Table 62: Thailandc Network as a Service Market Volume (K Unit) Forecast, by Application 2019 & 2032
- Table 63: Rest of Asia Pacific Network as a Service Market Revenue (Million) Forecast, by Application 2019 & 2032
- Table 64: Rest of Asia Pacific Network as a Service Market Volume (K Unit) Forecast, by Application 2019 & 2032
- Table 65: Global Network as a Service Market Revenue Million Forecast, by Country 2019 & 2032
- Table 66: Global Network as a Service Market Volume K Unit Forecast, by Country 2019 & 2032
- Table 67: Brazil Network as a Service Market Revenue (Million) Forecast, by Application 2019 & 2032
- Table 68: Brazil Network as a Service Market Volume (K Unit) Forecast, by Application 2019 & 2032
- Table 69: Argentina Network as a Service Market Revenue (Million) Forecast, by Application 2019 & 2032
- Table 70: Argentina Network as a Service Market Volume (K Unit) Forecast, by Application 2019 & 2032
- Table 71: Peru Network as a Service Market Revenue (Million) Forecast, by Application 2019 & 2032
- Table 72: Peru Network as a Service Market Volume (K Unit) Forecast, by Application 2019 & 2032
- Table 73: Chile Network as a Service Market Revenue (Million) Forecast, by Application 2019 & 2032
- Table 74: Chile Network as a Service Market Volume (K Unit) Forecast, by Application 2019 & 2032
- Table 75: Colombia Network as a Service Market Revenue (Million) Forecast, by Application 2019 & 2032
- Table 76: Colombia Network as a Service Market Volume (K Unit) Forecast, by Application 2019 & 2032
- Table 77: Ecuador Network as a Service Market Revenue (Million) Forecast, by Application 2019 & 2032
- Table 78: Ecuador Network as a Service Market Volume (K Unit) Forecast, by Application 2019 & 2032
- Table 79: Venezuela Network as a Service Market Revenue (Million) Forecast, by Application 2019 & 2032
- Table 80: Venezuela Network as a Service Market Volume (K Unit) Forecast, by Application 2019 & 2032
- Table 81: Rest of South America Network as a Service Market Revenue (Million) Forecast, by Application 2019 & 2032
- Table 82: Rest of South America Network as a Service Market Volume (K Unit) Forecast, by Application 2019 & 2032
- Table 83: Global Network as a Service Market Revenue Million Forecast, by Country 2019 & 2032
- Table 84: Global Network as a Service Market Volume K Unit Forecast, by Country 2019 & 2032
- Table 85: United States Network as a Service Market Revenue (Million) Forecast, by Application 2019 & 2032
- Table 86: United States Network as a Service Market Volume (K Unit) Forecast, by Application 2019 & 2032
- Table 87: Canada Network as a Service Market Revenue (Million) Forecast, by Application 2019 & 2032
- Table 88: Canada Network as a Service Market Volume (K Unit) Forecast, by Application 2019 & 2032
- Table 89: Mexico Network as a Service Market Revenue (Million) Forecast, by Application 2019 & 2032
- Table 90: Mexico Network as a Service Market Volume (K Unit) Forecast, by Application 2019 & 2032
- Table 91: Global Network as a Service Market Revenue Million Forecast, by Country 2019 & 2032
- Table 92: Global Network as a Service Market Volume K Unit Forecast, by Country 2019 & 2032
- Table 93: United Arab Emirates Network as a Service Market Revenue (Million) Forecast, by Application 2019 & 2032
- Table 94: United Arab Emirates Network as a Service Market Volume (K Unit) Forecast, by Application 2019 & 2032
- Table 95: Saudi Arabia Network as a Service Market Revenue (Million) Forecast, by Application 2019 & 2032
- Table 96: Saudi Arabia Network as a Service Market Volume (K Unit) Forecast, by Application 2019 & 2032
- Table 97: South Africa Network as a Service Market Revenue (Million) Forecast, by Application 2019 & 2032
- Table 98: South Africa Network as a Service Market Volume (K Unit) Forecast, by Application 2019 & 2032
- Table 99: Rest of Middle East and Africa Network as a Service Market Revenue (Million) Forecast, by Application 2019 & 2032
- Table 100: Rest of Middle East and Africa Network as a Service Market Volume (K Unit) Forecast, by Application 2019 & 2032
- Table 101: Global Network as a Service Market Revenue Million Forecast, by Type 2019 & 2032
- Table 102: Global Network as a Service Market Volume K Unit Forecast, by Type 2019 & 2032
- Table 103: Global Network as a Service Market Revenue Million Forecast, by Application 2019 & 2032
- Table 104: Global Network as a Service Market Volume K Unit Forecast, by Application 2019 & 2032
- Table 105: Global Network as a Service Market Revenue Million Forecast, by Industry Vertical 2019 & 2032
- Table 106: Global Network as a Service Market Volume K Unit Forecast, by Industry Vertical 2019 & 2032
- Table 107: Global Network as a Service Market Revenue Million Forecast, by Country 2019 & 2032
- Table 108: Global Network as a Service Market Volume K Unit Forecast, by Country 2019 & 2032
- Table 109: United States Network as a Service Market Revenue (Million) Forecast, by Application 2019 & 2032
- Table 110: United States Network as a Service Market Volume (K Unit) Forecast, by Application 2019 & 2032
- Table 111: Canada Network as a Service Market Revenue (Million) Forecast, by Application 2019 & 2032
- Table 112: Canada Network as a Service Market Volume (K Unit) Forecast, by Application 2019 & 2032
- Table 113: Global Network as a Service Market Revenue Million Forecast, by Type 2019 & 2032
- Table 114: Global Network as a Service Market Volume K Unit Forecast, by Type 2019 & 2032
- Table 115: Global Network as a Service Market Revenue Million Forecast, by Application 2019 & 2032
- Table 116: Global Network as a Service Market Volume K Unit Forecast, by Application 2019 & 2032
- Table 117: Global Network as a Service Market Revenue Million Forecast, by Industry Vertical 2019 & 2032
- Table 118: Global Network as a Service Market Volume K Unit Forecast, by Industry Vertical 2019 & 2032
- Table 119: Global Network as a Service Market Revenue Million Forecast, by Country 2019 & 2032
- Table 120: Global Network as a Service Market Volume K Unit Forecast, by Country 2019 & 2032
- Table 121: United Kingdom Network as a Service Market Revenue (Million) Forecast, by Application 2019 & 2032
- Table 122: United Kingdom Network as a Service Market Volume (K Unit) Forecast, by Application 2019 & 2032
- Table 123: Germany Network as a Service Market Revenue (Million) Forecast, by Application 2019 & 2032
- Table 124: Germany Network as a Service Market Volume (K Unit) Forecast, by Application 2019 & 2032
- Table 125: France Network as a Service Market Revenue (Million) Forecast, by Application 2019 & 2032
- Table 126: France Network as a Service Market Volume (K Unit) Forecast, by Application 2019 & 2032
- Table 127: Rest of Europe Network as a Service Market Revenue (Million) Forecast, by Application 2019 & 2032
- Table 128: Rest of Europe Network as a Service Market Volume (K Unit) Forecast, by Application 2019 & 2032
- Table 129: Global Network as a Service Market Revenue Million Forecast, by Type 2019 & 2032
- Table 130: Global Network as a Service Market Volume K Unit Forecast, by Type 2019 & 2032
- Table 131: Global Network as a Service Market Revenue Million Forecast, by Application 2019 & 2032
- Table 132: Global Network as a Service Market Volume K Unit Forecast, by Application 2019 & 2032
- Table 133: Global Network as a Service Market Revenue Million Forecast, by Industry Vertical 2019 & 2032
- Table 134: Global Network as a Service Market Volume K Unit Forecast, by Industry Vertical 2019 & 2032
- Table 135: Global Network as a Service Market Revenue Million Forecast, by Country 2019 & 2032
- Table 136: Global Network as a Service Market Volume K Unit Forecast, by Country 2019 & 2032
- Table 137: China Network as a Service Market Revenue (Million) Forecast, by Application 2019 & 2032
- Table 138: China Network as a Service Market Volume (K Unit) Forecast, by Application 2019 & 2032
- Table 139: Japan Network as a Service Market Revenue (Million) Forecast, by Application 2019 & 2032
- Table 140: Japan Network as a Service Market Volume (K Unit) Forecast, by Application 2019 & 2032
- Table 141: India Network as a Service Market Revenue (Million) Forecast, by Application 2019 & 2032
- Table 142: India Network as a Service Market Volume (K Unit) Forecast, by Application 2019 & 2032
- Table 143: Rest of Asia Pacific Network as a Service Market Revenue (Million) Forecast, by Application 2019 & 2032
- Table 144: Rest of Asia Pacific Network as a Service Market Volume (K Unit) Forecast, by Application 2019 & 2032
- Table 145: Global Network as a Service Market Revenue Million Forecast, by Type 2019 & 2032
- Table 146: Global Network as a Service Market Volume K Unit Forecast, by Type 2019 & 2032
- Table 147: Global Network as a Service Market Revenue Million Forecast, by Application 2019 & 2032
- Table 148: Global Network as a Service Market Volume K Unit Forecast, by Application 2019 & 2032
- Table 149: Global Network as a Service Market Revenue Million Forecast, by Industry Vertical 2019 & 2032
- Table 150: Global Network as a Service Market Volume K Unit Forecast, by Industry Vertical 2019 & 2032
- Table 151: Global Network as a Service Market Revenue Million Forecast, by Country 2019 & 2032
- Table 152: Global Network as a Service Market Volume K Unit Forecast, by Country 2019 & 2032
- Table 153: Brazil Network as a Service Market Revenue (Million) Forecast, by Application 2019 & 2032
- Table 154: Brazil Network as a Service Market Volume (K Unit) Forecast, by Application 2019 & 2032
- Table 155: Argentina Network as a Service Market Revenue (Million) Forecast, by Application 2019 & 2032
- Table 156: Argentina Network as a Service Market Volume (K Unit) Forecast, by Application 2019 & 2032
- Table 157: Mexico Network as a Service Market Revenue (Million) Forecast, by Application 2019 & 2032
- Table 158: Mexico Network as a Service Market Volume (K Unit) Forecast, by Application 2019 & 2032
- Table 159: Rest of Latin America Network as a Service Market Revenue (Million) Forecast, by Application 2019 & 2032
- Table 160: Rest of Latin America Network as a Service Market Volume (K Unit) Forecast, by Application 2019 & 2032
- Table 161: Global Network as a Service Market Revenue Million Forecast, by Type 2019 & 2032
- Table 162: Global Network as a Service Market Volume K Unit Forecast, by Type 2019 & 2032
- Table 163: Global Network as a Service Market Revenue Million Forecast, by Application 2019 & 2032
- Table 164: Global Network as a Service Market Volume K Unit Forecast, by Application 2019 & 2032
- Table 165: Global Network as a Service Market Revenue Million Forecast, by Industry Vertical 2019 & 2032
- Table 166: Global Network as a Service Market Volume K Unit Forecast, by Industry Vertical 2019 & 2032
- Table 167: Global Network as a Service Market Revenue Million Forecast, by Country 2019 & 2032
- Table 168: Global Network as a Service Market Volume K Unit Forecast, by Country 2019 & 2032
- Table 169: United Arab Emirates Network as a Service Market Revenue (Million) Forecast, by Application 2019 & 2032
- Table 170: United Arab Emirates Network as a Service Market Volume (K Unit) Forecast, by Application 2019 & 2032
- Table 171: Saudi Arabia Network as a Service Market Revenue (Million) Forecast, by Application 2019 & 2032
- Table 172: Saudi Arabia Network as a Service Market Volume (K Unit) Forecast, by Application 2019 & 2032
- Table 173: Rest of Middle East and Africa Network as a Service Market Revenue (Million) Forecast, by Application 2019 & 2032
- Table 174: Rest of Middle East and Africa Network as a Service Market Volume (K Unit) Forecast, by Application 2019 & 2032
Frequently Asked Questions
1. What is the projected Compound Annual Growth Rate (CAGR) of the Network as a Service Market?
The projected CAGR is approximately 32.36%.
2. Which companies are prominent players in the Network as a Service Market?
Key companies in the market include Telstra Group Limited, AT&T Intellectual Property, CenturyLink, Cisco Systems Inc, Hewlett Packard Enterprise Development LP, GTT Communications Inc, Juniper Networks Inc, Masergy Communications Inc, DXC Technology Company, NEC Corporation, Broadcom , Meta Networks Ltd (Proofpoint), TD SYNNEX Corporation, VMware Inc, Akamai Technologie, Oracle, Verizon, Nokia (Alcatel Lucent), IBM.
3. What are the main segments of the Network as a Service Market?
The market segments include Type, Application, Industry Vertical.
4. Can you provide details about the market size?
The market size is estimated to be USD XX Million as of 2022.
5. What are some drivers contributing to market growth?
Increased Adoption of Cloud Services among Enterprises; Augmentation in Software-defined Networking (SDN) Integration with Existing Network Infrastructure.
6. What are the notable trends driving market growth?
Increased Adoption of Cloud Services among Enterprises to Drive the Market.
7. Are there any restraints impacting market growth?
Privacy and Data Security Concerns.
8. Can you provide examples of recent developments in the market?
March 2023 - Akamai Technologies announced an agreement to acquire Ondat, a cloud-based storage technology provider with a Kubernetes-native platform for running stateful applications anywhere at scale. Acquiring Ondat's cloud storage technology and industry-recognized talent will strengthen Akamai's cloud computing offerings.
9. What pricing options are available for accessing the report?
Pricing options include single-user, multi-user, and enterprise licenses priced at USD 4750, USD 5250, and USD 8750 respectively.
10. Is the market size provided in terms of value or volume?
The market size is provided in terms of value, measured in Million and volume, measured in K Unit.
11. Are there any specific market keywords associated with the report?
Yes, the market keyword associated with the report is "Network as a Service Market," which aids in identifying and referencing the specific market segment covered.
12. How do I determine which pricing option suits my needs best?
The pricing options vary based on user requirements and access needs. Individual users may opt for single-user licenses, while businesses requiring broader access may choose multi-user or enterprise licenses for cost-effective access to the report.
13. Are there any additional resources or data provided in the Network as a Service Market report?
While the report offers comprehensive insights, it's advisable to review the specific contents or supplementary materials provided to ascertain if additional resources or data are available.
14. How can I stay updated on further developments or reports in the Network as a Service Market?
To stay informed about further developments, trends, and reports in the Network as a Service Market, consider subscribing to industry newsletters, following relevant companies and organizations, or regularly checking reputable industry news sources and publications.
Methodology
Step 1 - Identification of Relevant Samples Size from Population Database


Step 2 - Approaches for Defining Global Market Size (Value, Volume* & Price*)

Note*: In applicable scenarios
Step 3 - Data Sources
Primary Research
- Web Analytics
- Survey Reports
- Research Institute
- Latest Research Reports
- Opinion Leaders
Secondary Research
- Annual Reports
- White Paper
- Latest Press Release
- Industry Association
- Paid Database
- Investor Presentations

Step 4 - Data Triangulation
Involves using different sources of information in order to increase the validity of a study
These sources are likely to be stakeholders in a program - participants, other researchers, program staff, other community members, and so on.
Then we put all data in single framework & apply various statistical tools to find out the dynamic on the market.
During the analysis stage, feedback from the stakeholder groups would be compared to determine areas of agreement as well as areas of divergence


