
Key Insights
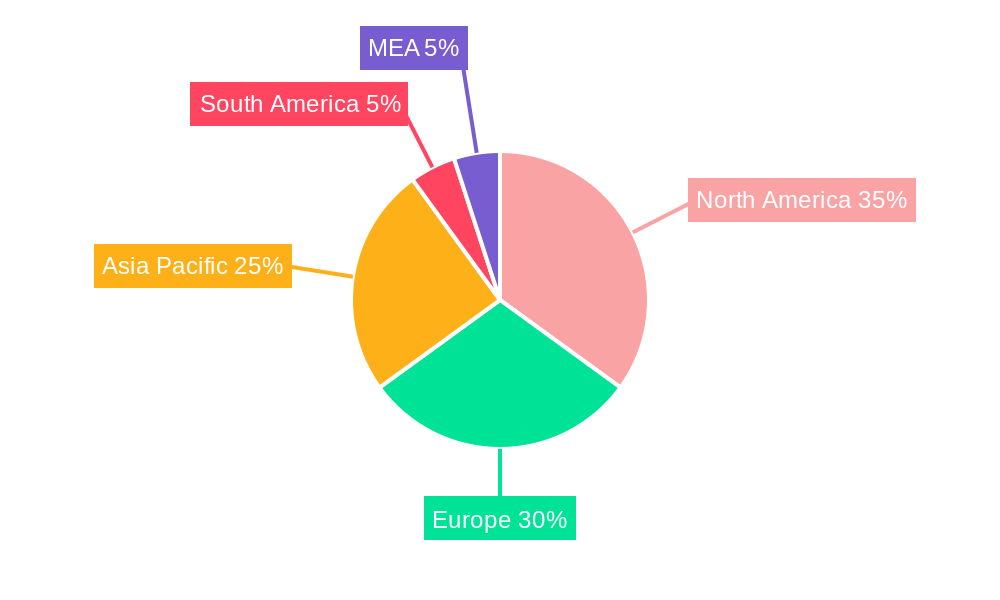
The global Network Managed Services market is experiencing robust growth, projected to reach a substantial value by 2033. Driven by the increasing adoption of cloud computing, the Internet of Things (IoT), and the expanding digital transformation initiatives across various sectors, the market shows a Compound Annual Growth Rate (CAGR) of 12.19%. Key industry drivers include the need for enhanced network security, improved operational efficiency, and reduced IT infrastructure costs. Businesses, particularly large enterprises and those in the BFSI, IT & Telecom, and Healthcare & Pharmaceutical sectors, are significantly investing in managed network services to ensure business continuity, optimize performance, and gain a competitive edge. The market is segmented by organization size (SMEs and large enterprises), end-user industry (BFSI, IT & Telecom, Healthcare & Pharmaceutical, Retail, Manufacturing, Education, and Others), and service type (Managed LAN, Managed WAN, Managed Wi-Fi, Managed Network Security, and Other Services). North America and Europe currently hold significant market share due to advanced technological infrastructure and higher adoption rates, but the Asia-Pacific region is expected to witness rapid growth fueled by increasing digitalization and expanding internet penetration.
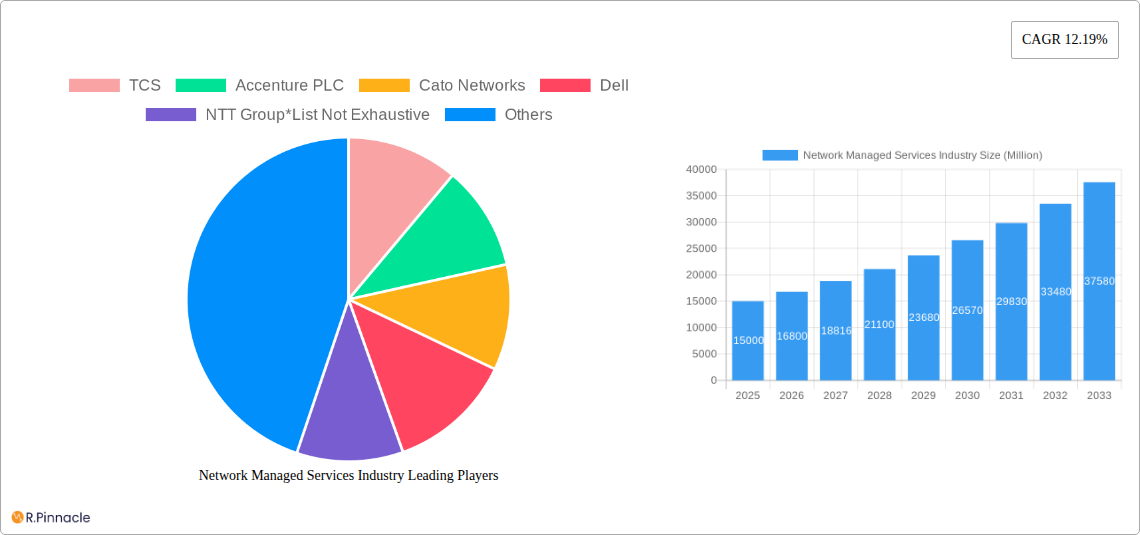
Despite the positive growth outlook, certain restraints exist, such as the complexities involved in integrating diverse network solutions and the rising concerns regarding data security and privacy. However, the continuous innovation in network technologies, including Software-Defined Networking (SDN) and Network Function Virtualization (NFV), is mitigating these challenges and is expected to further accelerate market expansion. The competitive landscape is marked by the presence of both global technology giants (like TCS, Accenture, IBM, and Dell) and specialized network service providers, leading to intense competition and driving innovation. The market is characterized by strategic partnerships, mergers and acquisitions, and ongoing efforts to provide comprehensive and customized network solutions to cater to diverse client needs. This competitive dynamism is likely to further fuel market growth in the coming years.
Network Managed Services Industry Report: 2019-2033 Forecast
This comprehensive report provides a detailed analysis of the Network Managed Services (NMS) industry, offering invaluable insights for industry professionals, investors, and strategic decision-makers. The study period covers 2019-2033, with a focus on the estimated year 2025 and a forecast period of 2025-2033. The report leverages extensive data and analysis to illuminate market trends, growth drivers, and competitive dynamics, including a thorough examination of key players such as TCS, Accenture PLC, Cato Networks, Dell, NTT Group, Wipro, Verizon, HCL Technologies Limited, IBM, and Lumen Technologies. The market is segmented by organization size (SMEs and Large Enterprises), end-user (BFSI, IT & Telecom, Healthcare & Pharmaceutical, Retail, Manufacturing, Education, and Others), and service type (Managed LAN, Managed WAN, Managed Wi-Fi, Managed Network Security, and Other Services). The report projects a market value exceeding $xx Million by 2033.
Network Managed Services Industry Market Structure & Innovation Trends
The Network Managed Services market is characterized by a moderately concentrated structure, with several large multinational players holding significant market share. TCS, Accenture, and IBM collectively account for an estimated xx% of the global market, based on 2024 revenue. This concentration is driven by economies of scale and extensive global reach. However, smaller, specialized providers continue to flourish by focusing on niche segments or offering innovative solutions.
Innovation in the NMS industry is primarily driven by advancements in cloud computing, software-defined networking (SDN), and artificial intelligence (AI). These technologies enable the development of more efficient, scalable, and secure managed services. Regulatory frameworks, such as data privacy regulations (GDPR, CCPA), significantly influence the industry by driving the demand for robust security solutions. Product substitutes, such as on-premise network management systems, are losing ground to the flexibility and cost-effectiveness of cloud-based NMS solutions.
Mergers and acquisitions (M&A) activity remains significant, with deal values exceeding $xx Million annually in recent years. Key M&A activities often focus on expanding service offerings, geographical reach, and technological capabilities. This includes strategic acquisitions of smaller companies with specialized expertise. For example, the acquisition of [insert example of M&A if known] in [year] highlighted the trend of expanding service portfolios.
Network Managed Services Industry Market Dynamics & Trends
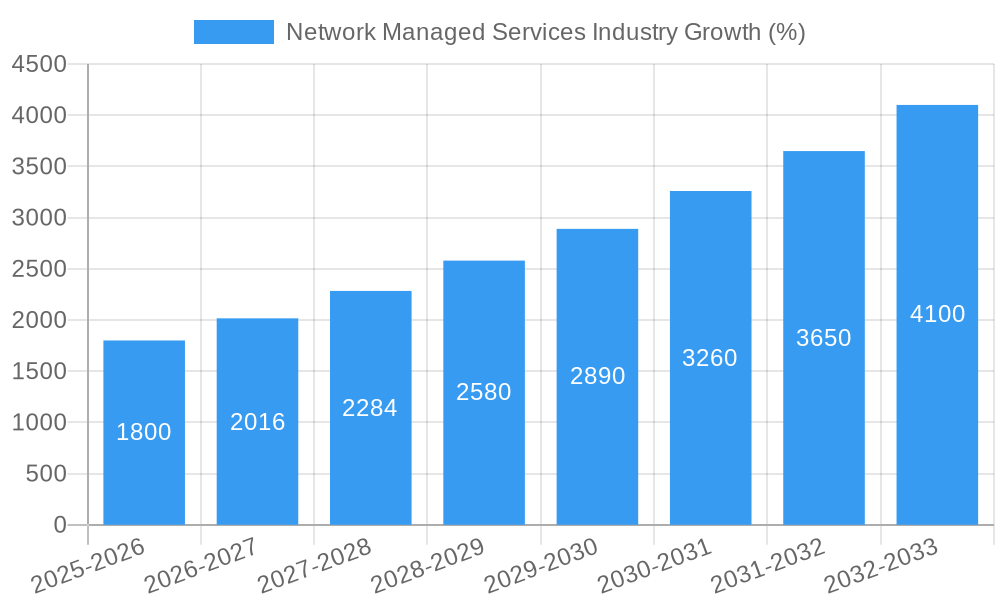
The NMS market is experiencing robust growth, driven by several factors. The increasing adoption of cloud computing and digital transformation initiatives across various industries fuels the demand for reliable and secure network management services. The shift towards remote work models and the need for enhanced network security have further accelerated market expansion. The market is projected to grow at a Compound Annual Growth Rate (CAGR) of xx% during the forecast period (2025-2033), reaching a market size of $xx Million by 2033. This growth is particularly pronounced in regions with robust digital infrastructure and high levels of technology adoption. Market penetration is highest in North America and Europe, with developing economies showing significant growth potential. Technological disruptions, particularly in 5G and edge computing, are reshaping the NMS landscape, creating new opportunities for service providers.
Dominant Regions & Segments in Network Managed Services Industry
North America currently holds the largest market share in the NMS industry, followed by Europe. This dominance is attributed to high levels of IT spending, advanced technological infrastructure, and a large base of enterprise customers. Asia Pacific is experiencing the fastest growth rate, driven by increasing digitalization and investment in IT infrastructure across emerging economies.
- By Organization Size: Large enterprises dominate the market due to their higher IT budgets and complex networking requirements. However, the SME segment is also growing rapidly, driven by increasing awareness of the benefits of outsourced network management.
- By End User: The BFSI and IT & Telecom sectors are major consumers of NMS, driven by the need for robust security and high network availability. The healthcare and pharmaceutical sectors are also witnessing strong growth, due to the increasing use of connected medical devices and the need for secure data transmission.
- By Type: Managed WAN and Managed Network Security services are the largest segments, driven by the growing need for secure and reliable connectivity across geographically dispersed locations. Managed Wi-Fi is also witnessing robust growth, fueled by the proliferation of Wi-Fi-enabled devices and the demand for improved network performance in workplaces and public spaces.
Key drivers for regional dominance include favorable economic policies, supportive regulatory environments, and investment in digital infrastructure. Countries with strong government initiatives promoting digital transformation tend to experience faster growth in the NMS market.
Network Managed Services Industry Product Innovations
Recent product innovations in the NMS industry center around AI-powered network management, automation, and enhanced security features. These solutions offer improved performance, reduced operational costs, and enhanced network security. The integration of SDN and cloud technologies is enabling more agile and scalable NMS solutions, better adapting to the dynamic needs of modern businesses. The market fit of these innovations is excellent, as businesses prioritize network reliability, security, and cost optimization.
Report Scope & Segmentation Analysis
This report provides a comprehensive analysis of the NMS market segmented by organization size (SMEs and Large Enterprises), end-user (BFSI, IT & Telecom, Healthcare & Pharmaceutical, Retail, Manufacturing, Education, and Others), and service type (Managed LAN, Managed WAN, Managed Wi-Fi, Managed Network Security, and Other Services). Each segment is analyzed based on historical data (2019-2024), estimated values (2025), and forecasted growth (2025-2033). The report details market size, growth projections, and competitive dynamics within each segment.
Key Drivers of Network Managed Services Industry Growth
Several factors are driving the growth of the NMS industry. The increasing adoption of cloud computing and digital transformation necessitates robust network management solutions. The rising demand for network security due to increasing cyber threats is another major driver. Finally, advancements in technologies such as SDN and AI are providing more efficient and cost-effective network management solutions.
Challenges in the Network Managed Services Industry Sector
The NMS industry faces challenges such as intense competition, increasing security threats, and the need for continuous technological innovation. Supply chain disruptions and fluctuations in the price of key components can also impact profitability. Regulatory compliance burdens add complexities and costs for service providers. These challenges represent quantifiable obstacles, impacting profit margins and market growth in the sector.
Emerging Opportunities in Network Managed Services Industry
Emerging opportunities include the expansion of 5G networks, growth in IoT devices, and the increasing adoption of edge computing. The development of AI-powered network management solutions presents significant opportunities for innovation and differentiation. Furthermore, the growing need for secure and reliable connectivity in various industries, such as healthcare and manufacturing, opens new avenues for growth.
Leading Players in the Network Managed Services Industry Market
- TCS
- Accenture PLC
- Cato Networks
- Dell
- NTT Group
- Wipro
- Verizon
- HCL Technologies Limited
- IBM
- Lumen Technologies
Key Developments in Network Managed Services Industry
- June 2023: Wipro launched a managed private 5G-as-a-service solution in partnership with Cisco, enhancing enterprise connectivity and business outcomes.
- May 2023: Cloudflare Inc. partnered with Kyndryl Holdings Inc. to offer modernized and scalable managed WAN-as-a-Service and Cloudflare Zero Trust solutions, enhancing enterprise cloud connectivity.
Future Outlook for Network Managed Services Industry Market
The future of the NMS market looks promising, driven by continued technological advancements, increasing digitalization, and rising demand for secure and reliable network connectivity across all sectors. Strategic partnerships, acquisitions, and innovations in areas such as AI-driven network management and 5G will be key growth accelerators. The market is poised for sustained growth, with substantial opportunities for established players and emerging entrants alike.
Network Managed Services Industry Segmentation
-
1. Type
- 1.1. Managed LAN
- 1.2. Managed WAN
- 1.3. Managed Wi-Fi
- 1.4. Managed Network Security
- 1.5. Other Services
-
2. Organization Size
- 2.1. Small and Medium Enterprises (SMEs)
- 2.2. Large Enterprises
-
3. End User
- 3.1. BFSI
- 3.2. IT and Telecom
- 3.3. Healthcare and Pharmaceutical
- 3.4. Retail
- 3.5. Manufacturing
- 3.6. Education
- 3.7. Others (Utilities, Media, Etc.)
Network Managed Services Industry Segmentation By Geography
- 1. North America
- 2. Europe
- 3. Asia Pacific
- 4. Middle East and Africa
- 5. Latin America
Network Managed Services Industry REPORT HIGHLIGHTS
| Aspects | Details |
|---|---|
| Study Period | 2019-2033 |
| Base Year | 2024 |
| Estimated Year | 2025 |
| Forecast Period | 2025-2033 |
| Historical Period | 2019-2024 |
| Growth Rate | CAGR of 12.19% from 2019-2033 |
| Segmentation |
|
Table of Contents
- 1. Introduction
- 1.1. Research Scope
- 1.2. Market Segmentation
- 1.3. Research Methodology
- 1.4. Definitions and Assumptions
- 2. Executive Summary
- 2.1. Introduction
- 3. Market Dynamics
- 3.1. Introduction
- 3.2. Market Drivers
- 3.2.1. Lack of in-house Expertise; Benefit of Extensive Focus on Core Operations; Cost Benefits and ROI Achieved through Managed Services
- 3.3. Market Restrains
- 3.3.1. Reluctance Among Medical Professionals to Adopt Advanced Healthcare Tools
- 3.4. Market Trends
- 3.4.1. IT and Telecom Sector to be the Largest End User
- 4. Market Factor Analysis
- 4.1. Porters Five Forces
- 4.2. Supply/Value Chain
- 4.3. PESTEL analysis
- 4.4. Market Entropy
- 4.5. Patent/Trademark Analysis
- 5. Global Network Managed Services Industry Analysis, Insights and Forecast, 2019-2031
- 5.1. Market Analysis, Insights and Forecast - by Type
- 5.1.1. Managed LAN
- 5.1.2. Managed WAN
- 5.1.3. Managed Wi-Fi
- 5.1.4. Managed Network Security
- 5.1.5. Other Services
- 5.2. Market Analysis, Insights and Forecast - by Organization Size
- 5.2.1. Small and Medium Enterprises (SMEs)
- 5.2.2. Large Enterprises
- 5.3. Market Analysis, Insights and Forecast - by End User
- 5.3.1. BFSI
- 5.3.2. IT and Telecom
- 5.3.3. Healthcare and Pharmaceutical
- 5.3.4. Retail
- 5.3.5. Manufacturing
- 5.3.6. Education
- 5.3.7. Others (Utilities, Media, Etc.)
- 5.4. Market Analysis, Insights and Forecast - by Region
- 5.4.1. North America
- 5.4.2. Europe
- 5.4.3. Asia Pacific
- 5.4.4. Middle East and Africa
- 5.4.5. Latin America
- 5.1. Market Analysis, Insights and Forecast - by Type
- 6. North America Network Managed Services Industry Analysis, Insights and Forecast, 2019-2031
- 6.1. Market Analysis, Insights and Forecast - by Type
- 6.1.1. Managed LAN
- 6.1.2. Managed WAN
- 6.1.3. Managed Wi-Fi
- 6.1.4. Managed Network Security
- 6.1.5. Other Services
- 6.2. Market Analysis, Insights and Forecast - by Organization Size
- 6.2.1. Small and Medium Enterprises (SMEs)
- 6.2.2. Large Enterprises
- 6.3. Market Analysis, Insights and Forecast - by End User
- 6.3.1. BFSI
- 6.3.2. IT and Telecom
- 6.3.3. Healthcare and Pharmaceutical
- 6.3.4. Retail
- 6.3.5. Manufacturing
- 6.3.6. Education
- 6.3.7. Others (Utilities, Media, Etc.)
- 6.1. Market Analysis, Insights and Forecast - by Type
- 7. Europe Network Managed Services Industry Analysis, Insights and Forecast, 2019-2031
- 7.1. Market Analysis, Insights and Forecast - by Type
- 7.1.1. Managed LAN
- 7.1.2. Managed WAN
- 7.1.3. Managed Wi-Fi
- 7.1.4. Managed Network Security
- 7.1.5. Other Services
- 7.2. Market Analysis, Insights and Forecast - by Organization Size
- 7.2.1. Small and Medium Enterprises (SMEs)
- 7.2.2. Large Enterprises
- 7.3. Market Analysis, Insights and Forecast - by End User
- 7.3.1. BFSI
- 7.3.2. IT and Telecom
- 7.3.3. Healthcare and Pharmaceutical
- 7.3.4. Retail
- 7.3.5. Manufacturing
- 7.3.6. Education
- 7.3.7. Others (Utilities, Media, Etc.)
- 7.1. Market Analysis, Insights and Forecast - by Type
- 8. Asia Pacific Network Managed Services Industry Analysis, Insights and Forecast, 2019-2031
- 8.1. Market Analysis, Insights and Forecast - by Type
- 8.1.1. Managed LAN
- 8.1.2. Managed WAN
- 8.1.3. Managed Wi-Fi
- 8.1.4. Managed Network Security
- 8.1.5. Other Services
- 8.2. Market Analysis, Insights and Forecast - by Organization Size
- 8.2.1. Small and Medium Enterprises (SMEs)
- 8.2.2. Large Enterprises
- 8.3. Market Analysis, Insights and Forecast - by End User
- 8.3.1. BFSI
- 8.3.2. IT and Telecom
- 8.3.3. Healthcare and Pharmaceutical
- 8.3.4. Retail
- 8.3.5. Manufacturing
- 8.3.6. Education
- 8.3.7. Others (Utilities, Media, Etc.)
- 8.1. Market Analysis, Insights and Forecast - by Type
- 9. Middle East and Africa Network Managed Services Industry Analysis, Insights and Forecast, 2019-2031
- 9.1. Market Analysis, Insights and Forecast - by Type
- 9.1.1. Managed LAN
- 9.1.2. Managed WAN
- 9.1.3. Managed Wi-Fi
- 9.1.4. Managed Network Security
- 9.1.5. Other Services
- 9.2. Market Analysis, Insights and Forecast - by Organization Size
- 9.2.1. Small and Medium Enterprises (SMEs)
- 9.2.2. Large Enterprises
- 9.3. Market Analysis, Insights and Forecast - by End User
- 9.3.1. BFSI
- 9.3.2. IT and Telecom
- 9.3.3. Healthcare and Pharmaceutical
- 9.3.4. Retail
- 9.3.5. Manufacturing
- 9.3.6. Education
- 9.3.7. Others (Utilities, Media, Etc.)
- 9.1. Market Analysis, Insights and Forecast - by Type
- 10. Latin America Network Managed Services Industry Analysis, Insights and Forecast, 2019-2031
- 10.1. Market Analysis, Insights and Forecast - by Type
- 10.1.1. Managed LAN
- 10.1.2. Managed WAN
- 10.1.3. Managed Wi-Fi
- 10.1.4. Managed Network Security
- 10.1.5. Other Services
- 10.2. Market Analysis, Insights and Forecast - by Organization Size
- 10.2.1. Small and Medium Enterprises (SMEs)
- 10.2.2. Large Enterprises
- 10.3. Market Analysis, Insights and Forecast - by End User
- 10.3.1. BFSI
- 10.3.2. IT and Telecom
- 10.3.3. Healthcare and Pharmaceutical
- 10.3.4. Retail
- 10.3.5. Manufacturing
- 10.3.6. Education
- 10.3.7. Others (Utilities, Media, Etc.)
- 10.1. Market Analysis, Insights and Forecast - by Type
- 11. North America Network Managed Services Industry Analysis, Insights and Forecast, 2019-2031
- 11.1. Market Analysis, Insights and Forecast - By Country/Sub-region
- 11.1.1 United States
- 11.1.2 Canada
- 11.1.3 Mexico
- 12. Europe Network Managed Services Industry Analysis, Insights and Forecast, 2019-2031
- 12.1. Market Analysis, Insights and Forecast - By Country/Sub-region
- 12.1.1 Germany
- 12.1.2 United Kingdom
- 12.1.3 France
- 12.1.4 Spain
- 12.1.5 Italy
- 12.1.6 Spain
- 12.1.7 Belgium
- 12.1.8 Netherland
- 12.1.9 Nordics
- 12.1.10 Rest of Europe
- 13. Asia Pacific Network Managed Services Industry Analysis, Insights and Forecast, 2019-2031
- 13.1. Market Analysis, Insights and Forecast - By Country/Sub-region
- 13.1.1 China
- 13.1.2 Japan
- 13.1.3 India
- 13.1.4 South Korea
- 13.1.5 Southeast Asia
- 13.1.6 Australia
- 13.1.7 Indonesia
- 13.1.8 Phillipes
- 13.1.9 Singapore
- 13.1.10 Thailandc
- 13.1.11 Rest of Asia Pacific
- 14. South America Network Managed Services Industry Analysis, Insights and Forecast, 2019-2031
- 14.1. Market Analysis, Insights and Forecast - By Country/Sub-region
- 14.1.1 Brazil
- 14.1.2 Argentina
- 14.1.3 Peru
- 14.1.4 Chile
- 14.1.5 Colombia
- 14.1.6 Ecuador
- 14.1.7 Venezuela
- 14.1.8 Rest of South America
- 15. North America Network Managed Services Industry Analysis, Insights and Forecast, 2019-2031
- 15.1. Market Analysis, Insights and Forecast - By Country/Sub-region
- 15.1.1 United States
- 15.1.2 Canada
- 15.1.3 Mexico
- 16. MEA Network Managed Services Industry Analysis, Insights and Forecast, 2019-2031
- 16.1. Market Analysis, Insights and Forecast - By Country/Sub-region
- 16.1.1 United Arab Emirates
- 16.1.2 Saudi Arabia
- 16.1.3 South Africa
- 16.1.4 Rest of Middle East and Africa
- 17. Competitive Analysis
- 17.1. Global Market Share Analysis 2024
- 17.2. Company Profiles
- 17.2.1 TCS
- 17.2.1.1. Overview
- 17.2.1.2. Products
- 17.2.1.3. SWOT Analysis
- 17.2.1.4. Recent Developments
- 17.2.1.5. Financials (Based on Availability)
- 17.2.2 Accenture PLC
- 17.2.2.1. Overview
- 17.2.2.2. Products
- 17.2.2.3. SWOT Analysis
- 17.2.2.4. Recent Developments
- 17.2.2.5. Financials (Based on Availability)
- 17.2.3 Cato Networks
- 17.2.3.1. Overview
- 17.2.3.2. Products
- 17.2.3.3. SWOT Analysis
- 17.2.3.4. Recent Developments
- 17.2.3.5. Financials (Based on Availability)
- 17.2.4 Dell
- 17.2.4.1. Overview
- 17.2.4.2. Products
- 17.2.4.3. SWOT Analysis
- 17.2.4.4. Recent Developments
- 17.2.4.5. Financials (Based on Availability)
- 17.2.5 NTT Group*List Not Exhaustive
- 17.2.5.1. Overview
- 17.2.5.2. Products
- 17.2.5.3. SWOT Analysis
- 17.2.5.4. Recent Developments
- 17.2.5.5. Financials (Based on Availability)
- 17.2.6 Wipro
- 17.2.6.1. Overview
- 17.2.6.2. Products
- 17.2.6.3. SWOT Analysis
- 17.2.6.4. Recent Developments
- 17.2.6.5. Financials (Based on Availability)
- 17.2.7 Verizon
- 17.2.7.1. Overview
- 17.2.7.2. Products
- 17.2.7.3. SWOT Analysis
- 17.2.7.4. Recent Developments
- 17.2.7.5. Financials (Based on Availability)
- 17.2.8 HCL Technologies Limited
- 17.2.8.1. Overview
- 17.2.8.2. Products
- 17.2.8.3. SWOT Analysis
- 17.2.8.4. Recent Developments
- 17.2.8.5. Financials (Based on Availability)
- 17.2.9 IBM
- 17.2.9.1. Overview
- 17.2.9.2. Products
- 17.2.9.3. SWOT Analysis
- 17.2.9.4. Recent Developments
- 17.2.9.5. Financials (Based on Availability)
- 17.2.10 Lumen Technologies
- 17.2.10.1. Overview
- 17.2.10.2. Products
- 17.2.10.3. SWOT Analysis
- 17.2.10.4. Recent Developments
- 17.2.10.5. Financials (Based on Availability)
- 17.2.1 TCS
List of Figures
- Figure 1: Global Network Managed Services Industry Revenue Breakdown (Million, %) by Region 2024 & 2032
- Figure 2: North America Network Managed Services Industry Revenue (Million), by Country 2024 & 2032
- Figure 3: North America Network Managed Services Industry Revenue Share (%), by Country 2024 & 2032
- Figure 4: Europe Network Managed Services Industry Revenue (Million), by Country 2024 & 2032
- Figure 5: Europe Network Managed Services Industry Revenue Share (%), by Country 2024 & 2032
- Figure 6: Asia Pacific Network Managed Services Industry Revenue (Million), by Country 2024 & 2032
- Figure 7: Asia Pacific Network Managed Services Industry Revenue Share (%), by Country 2024 & 2032
- Figure 8: South America Network Managed Services Industry Revenue (Million), by Country 2024 & 2032
- Figure 9: South America Network Managed Services Industry Revenue Share (%), by Country 2024 & 2032
- Figure 10: North America Network Managed Services Industry Revenue (Million), by Country 2024 & 2032
- Figure 11: North America Network Managed Services Industry Revenue Share (%), by Country 2024 & 2032
- Figure 12: MEA Network Managed Services Industry Revenue (Million), by Country 2024 & 2032
- Figure 13: MEA Network Managed Services Industry Revenue Share (%), by Country 2024 & 2032
- Figure 14: North America Network Managed Services Industry Revenue (Million), by Type 2024 & 2032
- Figure 15: North America Network Managed Services Industry Revenue Share (%), by Type 2024 & 2032
- Figure 16: North America Network Managed Services Industry Revenue (Million), by Organization Size 2024 & 2032
- Figure 17: North America Network Managed Services Industry Revenue Share (%), by Organization Size 2024 & 2032
- Figure 18: North America Network Managed Services Industry Revenue (Million), by End User 2024 & 2032
- Figure 19: North America Network Managed Services Industry Revenue Share (%), by End User 2024 & 2032
- Figure 20: North America Network Managed Services Industry Revenue (Million), by Country 2024 & 2032
- Figure 21: North America Network Managed Services Industry Revenue Share (%), by Country 2024 & 2032
- Figure 22: Europe Network Managed Services Industry Revenue (Million), by Type 2024 & 2032
- Figure 23: Europe Network Managed Services Industry Revenue Share (%), by Type 2024 & 2032
- Figure 24: Europe Network Managed Services Industry Revenue (Million), by Organization Size 2024 & 2032
- Figure 25: Europe Network Managed Services Industry Revenue Share (%), by Organization Size 2024 & 2032
- Figure 26: Europe Network Managed Services Industry Revenue (Million), by End User 2024 & 2032
- Figure 27: Europe Network Managed Services Industry Revenue Share (%), by End User 2024 & 2032
- Figure 28: Europe Network Managed Services Industry Revenue (Million), by Country 2024 & 2032
- Figure 29: Europe Network Managed Services Industry Revenue Share (%), by Country 2024 & 2032
- Figure 30: Asia Pacific Network Managed Services Industry Revenue (Million), by Type 2024 & 2032
- Figure 31: Asia Pacific Network Managed Services Industry Revenue Share (%), by Type 2024 & 2032
- Figure 32: Asia Pacific Network Managed Services Industry Revenue (Million), by Organization Size 2024 & 2032
- Figure 33: Asia Pacific Network Managed Services Industry Revenue Share (%), by Organization Size 2024 & 2032
- Figure 34: Asia Pacific Network Managed Services Industry Revenue (Million), by End User 2024 & 2032
- Figure 35: Asia Pacific Network Managed Services Industry Revenue Share (%), by End User 2024 & 2032
- Figure 36: Asia Pacific Network Managed Services Industry Revenue (Million), by Country 2024 & 2032
- Figure 37: Asia Pacific Network Managed Services Industry Revenue Share (%), by Country 2024 & 2032
- Figure 38: Middle East and Africa Network Managed Services Industry Revenue (Million), by Type 2024 & 2032
- Figure 39: Middle East and Africa Network Managed Services Industry Revenue Share (%), by Type 2024 & 2032
- Figure 40: Middle East and Africa Network Managed Services Industry Revenue (Million), by Organization Size 2024 & 2032
- Figure 41: Middle East and Africa Network Managed Services Industry Revenue Share (%), by Organization Size 2024 & 2032
- Figure 42: Middle East and Africa Network Managed Services Industry Revenue (Million), by End User 2024 & 2032
- Figure 43: Middle East and Africa Network Managed Services Industry Revenue Share (%), by End User 2024 & 2032
- Figure 44: Middle East and Africa Network Managed Services Industry Revenue (Million), by Country 2024 & 2032
- Figure 45: Middle East and Africa Network Managed Services Industry Revenue Share (%), by Country 2024 & 2032
- Figure 46: Latin America Network Managed Services Industry Revenue (Million), by Type 2024 & 2032
- Figure 47: Latin America Network Managed Services Industry Revenue Share (%), by Type 2024 & 2032
- Figure 48: Latin America Network Managed Services Industry Revenue (Million), by Organization Size 2024 & 2032
- Figure 49: Latin America Network Managed Services Industry Revenue Share (%), by Organization Size 2024 & 2032
- Figure 50: Latin America Network Managed Services Industry Revenue (Million), by End User 2024 & 2032
- Figure 51: Latin America Network Managed Services Industry Revenue Share (%), by End User 2024 & 2032
- Figure 52: Latin America Network Managed Services Industry Revenue (Million), by Country 2024 & 2032
- Figure 53: Latin America Network Managed Services Industry Revenue Share (%), by Country 2024 & 2032
List of Tables
- Table 1: Global Network Managed Services Industry Revenue Million Forecast, by Region 2019 & 2032
- Table 2: Global Network Managed Services Industry Revenue Million Forecast, by Type 2019 & 2032
- Table 3: Global Network Managed Services Industry Revenue Million Forecast, by Organization Size 2019 & 2032
- Table 4: Global Network Managed Services Industry Revenue Million Forecast, by End User 2019 & 2032
- Table 5: Global Network Managed Services Industry Revenue Million Forecast, by Region 2019 & 2032
- Table 6: Global Network Managed Services Industry Revenue Million Forecast, by Country 2019 & 2032
- Table 7: United States Network Managed Services Industry Revenue (Million) Forecast, by Application 2019 & 2032
- Table 8: Canada Network Managed Services Industry Revenue (Million) Forecast, by Application 2019 & 2032
- Table 9: Mexico Network Managed Services Industry Revenue (Million) Forecast, by Application 2019 & 2032
- Table 10: Global Network Managed Services Industry Revenue Million Forecast, by Country 2019 & 2032
- Table 11: Germany Network Managed Services Industry Revenue (Million) Forecast, by Application 2019 & 2032
- Table 12: United Kingdom Network Managed Services Industry Revenue (Million) Forecast, by Application 2019 & 2032
- Table 13: France Network Managed Services Industry Revenue (Million) Forecast, by Application 2019 & 2032
- Table 14: Spain Network Managed Services Industry Revenue (Million) Forecast, by Application 2019 & 2032
- Table 15: Italy Network Managed Services Industry Revenue (Million) Forecast, by Application 2019 & 2032
- Table 16: Spain Network Managed Services Industry Revenue (Million) Forecast, by Application 2019 & 2032
- Table 17: Belgium Network Managed Services Industry Revenue (Million) Forecast, by Application 2019 & 2032
- Table 18: Netherland Network Managed Services Industry Revenue (Million) Forecast, by Application 2019 & 2032
- Table 19: Nordics Network Managed Services Industry Revenue (Million) Forecast, by Application 2019 & 2032
- Table 20: Rest of Europe Network Managed Services Industry Revenue (Million) Forecast, by Application 2019 & 2032
- Table 21: Global Network Managed Services Industry Revenue Million Forecast, by Country 2019 & 2032
- Table 22: China Network Managed Services Industry Revenue (Million) Forecast, by Application 2019 & 2032
- Table 23: Japan Network Managed Services Industry Revenue (Million) Forecast, by Application 2019 & 2032
- Table 24: India Network Managed Services Industry Revenue (Million) Forecast, by Application 2019 & 2032
- Table 25: South Korea Network Managed Services Industry Revenue (Million) Forecast, by Application 2019 & 2032
- Table 26: Southeast Asia Network Managed Services Industry Revenue (Million) Forecast, by Application 2019 & 2032
- Table 27: Australia Network Managed Services Industry Revenue (Million) Forecast, by Application 2019 & 2032
- Table 28: Indonesia Network Managed Services Industry Revenue (Million) Forecast, by Application 2019 & 2032
- Table 29: Phillipes Network Managed Services Industry Revenue (Million) Forecast, by Application 2019 & 2032
- Table 30: Singapore Network Managed Services Industry Revenue (Million) Forecast, by Application 2019 & 2032
- Table 31: Thailandc Network Managed Services Industry Revenue (Million) Forecast, by Application 2019 & 2032
- Table 32: Rest of Asia Pacific Network Managed Services Industry Revenue (Million) Forecast, by Application 2019 & 2032
- Table 33: Global Network Managed Services Industry Revenue Million Forecast, by Country 2019 & 2032
- Table 34: Brazil Network Managed Services Industry Revenue (Million) Forecast, by Application 2019 & 2032
- Table 35: Argentina Network Managed Services Industry Revenue (Million) Forecast, by Application 2019 & 2032
- Table 36: Peru Network Managed Services Industry Revenue (Million) Forecast, by Application 2019 & 2032
- Table 37: Chile Network Managed Services Industry Revenue (Million) Forecast, by Application 2019 & 2032
- Table 38: Colombia Network Managed Services Industry Revenue (Million) Forecast, by Application 2019 & 2032
- Table 39: Ecuador Network Managed Services Industry Revenue (Million) Forecast, by Application 2019 & 2032
- Table 40: Venezuela Network Managed Services Industry Revenue (Million) Forecast, by Application 2019 & 2032
- Table 41: Rest of South America Network Managed Services Industry Revenue (Million) Forecast, by Application 2019 & 2032
- Table 42: Global Network Managed Services Industry Revenue Million Forecast, by Country 2019 & 2032
- Table 43: United States Network Managed Services Industry Revenue (Million) Forecast, by Application 2019 & 2032
- Table 44: Canada Network Managed Services Industry Revenue (Million) Forecast, by Application 2019 & 2032
- Table 45: Mexico Network Managed Services Industry Revenue (Million) Forecast, by Application 2019 & 2032
- Table 46: Global Network Managed Services Industry Revenue Million Forecast, by Country 2019 & 2032
- Table 47: United Arab Emirates Network Managed Services Industry Revenue (Million) Forecast, by Application 2019 & 2032
- Table 48: Saudi Arabia Network Managed Services Industry Revenue (Million) Forecast, by Application 2019 & 2032
- Table 49: South Africa Network Managed Services Industry Revenue (Million) Forecast, by Application 2019 & 2032
- Table 50: Rest of Middle East and Africa Network Managed Services Industry Revenue (Million) Forecast, by Application 2019 & 2032
- Table 51: Global Network Managed Services Industry Revenue Million Forecast, by Type 2019 & 2032
- Table 52: Global Network Managed Services Industry Revenue Million Forecast, by Organization Size 2019 & 2032
- Table 53: Global Network Managed Services Industry Revenue Million Forecast, by End User 2019 & 2032
- Table 54: Global Network Managed Services Industry Revenue Million Forecast, by Country 2019 & 2032
- Table 55: Global Network Managed Services Industry Revenue Million Forecast, by Type 2019 & 2032
- Table 56: Global Network Managed Services Industry Revenue Million Forecast, by Organization Size 2019 & 2032
- Table 57: Global Network Managed Services Industry Revenue Million Forecast, by End User 2019 & 2032
- Table 58: Global Network Managed Services Industry Revenue Million Forecast, by Country 2019 & 2032
- Table 59: Global Network Managed Services Industry Revenue Million Forecast, by Type 2019 & 2032
- Table 60: Global Network Managed Services Industry Revenue Million Forecast, by Organization Size 2019 & 2032
- Table 61: Global Network Managed Services Industry Revenue Million Forecast, by End User 2019 & 2032
- Table 62: Global Network Managed Services Industry Revenue Million Forecast, by Country 2019 & 2032
- Table 63: Global Network Managed Services Industry Revenue Million Forecast, by Type 2019 & 2032
- Table 64: Global Network Managed Services Industry Revenue Million Forecast, by Organization Size 2019 & 2032
- Table 65: Global Network Managed Services Industry Revenue Million Forecast, by End User 2019 & 2032
- Table 66: Global Network Managed Services Industry Revenue Million Forecast, by Country 2019 & 2032
- Table 67: Global Network Managed Services Industry Revenue Million Forecast, by Type 2019 & 2032
- Table 68: Global Network Managed Services Industry Revenue Million Forecast, by Organization Size 2019 & 2032
- Table 69: Global Network Managed Services Industry Revenue Million Forecast, by End User 2019 & 2032
- Table 70: Global Network Managed Services Industry Revenue Million Forecast, by Country 2019 & 2032
Frequently Asked Questions
1. What is the projected Compound Annual Growth Rate (CAGR) of the Network Managed Services Industry?
The projected CAGR is approximately 12.19%.
2. Which companies are prominent players in the Network Managed Services Industry?
Key companies in the market include TCS, Accenture PLC, Cato Networks, Dell, NTT Group*List Not Exhaustive, Wipro, Verizon, HCL Technologies Limited, IBM, Lumen Technologies.
3. What are the main segments of the Network Managed Services Industry?
The market segments include Type, Organization Size, End User.
4. Can you provide details about the market size?
The market size is estimated to be USD XX Million as of 2022.
5. What are some drivers contributing to market growth?
Lack of in-house Expertise; Benefit of Extensive Focus on Core Operations; Cost Benefits and ROI Achieved through Managed Services.
6. What are the notable trends driving market growth?
IT and Telecom Sector to be the Largest End User.
7. Are there any restraints impacting market growth?
Reluctance Among Medical Professionals to Adopt Advanced Healthcare Tools.
8. Can you provide examples of recent developments in the market?
June 2023: Wipro launched a managed private 5G-as-a-service solution in partnership with Cisco. Wipro said that the new offering enables enterprise customers to achieve better business outcomes via the integration of private 5G with their existing LAN/WAN/Cloud infrastructure.
9. What pricing options are available for accessing the report?
Pricing options include single-user, multi-user, and enterprise licenses priced at USD 4750, USD 5250, and USD 8750 respectively.
10. Is the market size provided in terms of value or volume?
The market size is provided in terms of value, measured in Million.
11. Are there any specific market keywords associated with the report?
Yes, the market keyword associated with the report is "Network Managed Services Industry," which aids in identifying and referencing the specific market segment covered.
12. How do I determine which pricing option suits my needs best?
The pricing options vary based on user requirements and access needs. Individual users may opt for single-user licenses, while businesses requiring broader access may choose multi-user or enterprise licenses for cost-effective access to the report.
13. Are there any additional resources or data provided in the Network Managed Services Industry report?
While the report offers comprehensive insights, it's advisable to review the specific contents or supplementary materials provided to ascertain if additional resources or data are available.
14. How can I stay updated on further developments or reports in the Network Managed Services Industry?
To stay informed about further developments, trends, and reports in the Network Managed Services Industry, consider subscribing to industry newsletters, following relevant companies and organizations, or regularly checking reputable industry news sources and publications.
Methodology
Step 1 - Identification of Relevant Samples Size from Population Database


Step 2 - Approaches for Defining Global Market Size (Value, Volume* & Price*)

Note*: In applicable scenarios
Step 3 - Data Sources
Primary Research
- Web Analytics
- Survey Reports
- Research Institute
- Latest Research Reports
- Opinion Leaders
Secondary Research
- Annual Reports
- White Paper
- Latest Press Release
- Industry Association
- Paid Database
- Investor Presentations

Step 4 - Data Triangulation
Involves using different sources of information in order to increase the validity of a study
These sources are likely to be stakeholders in a program - participants, other researchers, program staff, other community members, and so on.
Then we put all data in single framework & apply various statistical tools to find out the dynamic on the market.
During the analysis stage, feedback from the stakeholder groups would be compared to determine areas of agreement as well as areas of divergence


