
Key Insights
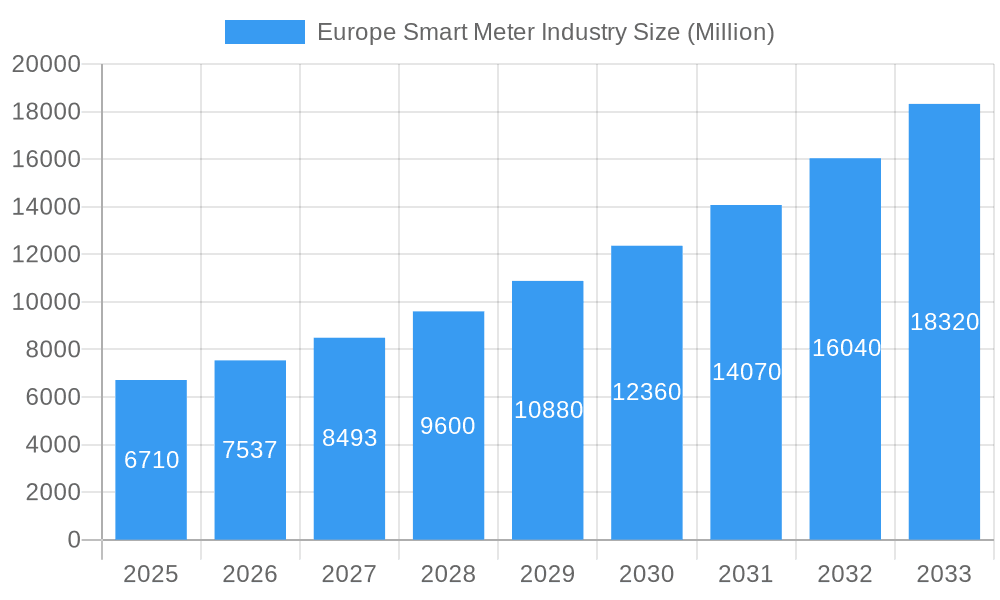
The European smart meter market, valued at €6.71 billion in 2025, is experiencing robust growth, projected to expand at a compound annual growth rate (CAGR) of 12.18% from 2025 to 2033. This surge is driven by several key factors. Firstly, increasing government mandates and incentives aimed at improving energy efficiency and grid modernization across countries like Germany, the UK, and France are significantly bolstering adoption. Secondly, the rising consumer demand for real-time energy monitoring and control, coupled with the advantages of reduced energy consumption and lower bills, fuels market expansion. Smart electricity meters currently dominate the market, followed by smart gas and water meters, with the residential sector accounting for the largest share of installations. However, significant growth opportunities exist within the commercial and industrial sectors, as businesses increasingly seek to optimize energy management and reduce operational costs. Technological advancements, such as the integration of advanced metering infrastructure (AMI) with smart grid technologies and the incorporation of data analytics capabilities within smart meters, further contribute to market expansion.

Europe Smart Meter Industry Market Size (In Billion)

Competition in the European smart meter market is intense, with major players like Itron, Badger Meter, and Landis+GYR vying for market share. However, the market is also witnessing the emergence of several regional players, particularly in countries such as Germany and Italy. While the high initial investment costs associated with smart meter deployments present a challenge, the long-term cost savings and environmental benefits are overcoming this hurdle. Furthermore, ongoing research and development efforts are focused on reducing the overall cost of smart meters and enhancing their functionality, making them more accessible and attractive to a wider range of consumers and businesses. The growth trajectory is expected to remain positive through 2033, driven by ongoing policy support, technological improvements, and increasing energy awareness among consumers and businesses alike.
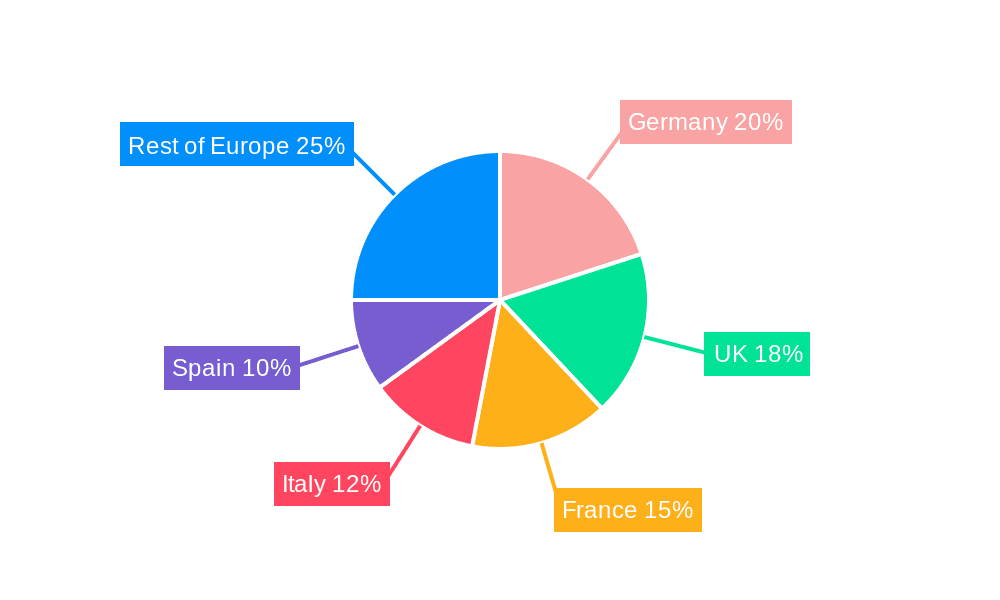
Europe Smart Meter Industry Company Market Share
Europe Smart Meter Industry Market Report: 2019-2033
This comprehensive report provides a detailed analysis of the Europe smart meter industry, offering invaluable insights for industry professionals, investors, and strategic decision-makers. With a focus on market dynamics, technological advancements, and competitive landscapes, this report covers the period from 2019 to 2033, with a base year of 2025 and a forecast period extending to 2033. The report leverages data from the historical period (2019-2024) to project future market trends and growth opportunities. The total market size is expected to reach xx Million by 2033.
Europe Smart Meter Industry Market Structure & Innovation Trends
This section analyzes the competitive landscape of the European smart meter market, encompassing market concentration, innovation drivers, regulatory frameworks, product substitutes, end-user demographics, and mergers and acquisitions (M&A) activities.
The market is characterized by a mix of established players and emerging companies. Market share is concentrated among major players like Itron Inc, Landis+GYR Group AG, and Kamstrup A/S, but smaller companies are actively innovating to gain market share. The estimated market share for Itron Inc in 2025 is xx%, while Landis+GYR Group AG holds xx% and Kamstrup A/S holds xx%. Innovation is primarily driven by the demand for improved energy efficiency, reduced operational costs, and enhanced grid management capabilities. Stringent environmental regulations and government incentives are also crucial drivers. M&A activity has been moderate in recent years, with deal values totaling approximately xx Million in the period 2019-2024. Key M&A activities have involved the consolidation of smaller players by larger firms to broaden their product portfolio and geographical reach.
- Market Concentration: Moderately concentrated with a few dominant players.
- Innovation Drivers: Energy efficiency, cost reduction, grid management.
- Regulatory Frameworks: Stringent environmental regulations and government incentives.
- Product Substitutes: Limited, with smart meters offering superior functionalities.
- End-User Demographics: Increasing adoption across residential, commercial, and industrial sectors.
- M&A Activity: Moderate activity, with total deal values reaching approximately xx Million (2019-2024).
Europe Smart Meter Industry Market Dynamics & Trends
This section explores the market's growth trajectory, influenced by factors like technological advancements, consumer preferences, and competitive landscape dynamics. The European smart meter market is experiencing significant growth, driven by rising energy costs, increasing environmental awareness, and government initiatives promoting smart grid deployments. Technological disruptions, such as the adoption of advanced communication technologies (e.g., NB-IoT, LoRaWAN) and the integration of artificial intelligence (AI) for predictive maintenance, are reshaping the industry. Consumer preference is shifting towards energy-efficient solutions with enhanced monitoring capabilities. The compound annual growth rate (CAGR) is projected at xx% from 2025 to 2033. Market penetration is expected to reach xx% by 2033, with significant growth across residential, commercial, and industrial sectors. Competitive dynamics are characterized by intense competition among leading players, driving innovation and price optimization.
Dominant Regions & Segments in Europe Smart Meter Industry
This section identifies leading regions and segments within the European smart meter market. Analysis is based on revenue and unit shipments for smart gas meters, smart water meters, and smart electricity meters, across residential, commercial, and industrial end-users, and across key countries: United Kingdom, Germany, France, Italy, Spain, and Rest of Europe.
- Leading Region: The United Kingdom currently holds the leading position, followed by Germany and France.
- Dominant Segment (By Type of Meter): Smart electricity meters constitute the largest segment, with significant revenue and unit shipments.
- Dominant Segment (By End User): The residential sector is currently the most significant end-user segment, driven by government-led smart meter rollouts.
Key Drivers for Dominance:
- United Kingdom: Government-backed smart meter rollout programs, robust infrastructure, and early adoption of smart grid technologies.
- Germany: Strong focus on energy efficiency, favorable regulatory environment, and well-developed infrastructure.
- France: Increasing government investments in smart grid modernization and growing consumer awareness of energy conservation.
Detailed analysis of each country's market dynamics, including economic policies and infrastructure development, is included within the full report.
Europe Smart Meter Industry Product Innovations
Recent product innovations include the introduction of advanced communication technologies like NB-IoT and LoRaWAN in smart meters, enhancing data transmission and remote management capabilities. Ultrasonic smart water meters, offering precise measurements and advanced data analytics, are also gaining traction. These innovations are improving energy efficiency, reducing operational costs, and enhancing grid management capabilities, aligning with market demand for sustainable and cost-effective solutions. The market is seeing a convergence of smart meters with other smart home and smart city technologies, creating further opportunities for integration and value creation.
Report Scope & Segmentation Analysis
This report segments the European smart meter market by:
Type of Meter: Smart Gas Meter, Smart Water Meter, Smart Electricity Meter. Each segment is analyzed based on revenue, unit shipments, and growth projections for the forecast period. Competitive dynamics within each segment are also examined.
End User: Residential, Commercial, Industrial. The report details the market size, growth projections, and competitive dynamics for each end-user segment.
Country: United Kingdom, Germany, France, Italy, Spain, Rest of Europe. Revenue, unit shipments, and market dynamics are analyzed for each country.
Key Drivers of Europe Smart Meter Industry Growth
The growth of the European smart meter industry is propelled by several factors:
- Government Regulations: Stringent environmental regulations and government incentives promoting energy efficiency and smart grid modernization are key drivers.
- Technological Advancements: The introduction of advanced communication technologies and data analytics capabilities is enhancing the functionality and value proposition of smart meters.
- Rising Energy Costs: Increasing energy prices are driving consumer demand for energy-efficient solutions and better energy management tools.
Challenges in the Europe Smart Meter Industry Sector
The European smart meter industry faces challenges such as:
- High Initial Investment Costs: The implementation of smart meter infrastructure requires significant upfront investment, posing a barrier for some stakeholders.
- Data Security Concerns: Ensuring the security and privacy of consumer data collected by smart meters is critical.
- Interoperability Issues: The lack of standardization across different smart meter technologies can hinder seamless integration and data exchange.
Emerging Opportunities in Europe Smart Meter Industry
Several emerging opportunities exist within the European smart meter industry:
- Expansion into Rural Areas: Extending smart meter deployments to underserved rural areas can unlock significant market potential.
- Integration with Smart City Initiatives: Integrating smart meters with other smart city infrastructure can create synergies and enhance overall efficiency.
- Adoption of Advanced Analytics: Leveraging data analytics to provide consumers with personalized insights and recommendations can drive greater adoption.
Leading Players in the Europe Smart Meter Industry Market
- Itron Inc
- Badger Meter Inc
- Zenner International GmbH & Co KG
- Sensus (Xylem Inc)
- Elster Group GmbH (Honeywell International Inc)
- Kamstrup A/S
- Apator SA
- Arad Group
- Diehl Stiftung & Co KG
- Landis+GYR Group AG
- Ningbo Sanxing Electric Co Ltd
- AEM
- General Electric Company
Key Developments in Europe Smart Meter Industry
- November 2022: Landis+Gyr launched its latest ultrasonic smart water meters (W270 and W370), leveraging NB-IoT technology for remote control and data acquisition. This enhances smart water network management capabilities.
- December 2022: Trilliant secured a contract to supply smart meters for Ireland's National Smart Metering Programme (NSMP), supporting ESB Networks' efforts to improve energy management, customer savings, and carbon footprint reduction.
Future Outlook for Europe Smart Meter Industry Market
The future of the European smart meter market is bright, with continued growth driven by technological advancements, supportive government policies, and increasing consumer awareness of energy efficiency. Strategic opportunities lie in expanding into new markets, integrating smart meters with other smart technologies, and leveraging advanced data analytics for enhanced grid management and customer engagement. The market is poised for substantial expansion as the adoption of smart meters accelerates across residential, commercial, and industrial sectors.
Europe Smart Meter Industry Segmentation
-
1. Type of Meter (Revenue and Unit Shipments)
- 1.1. Smart Gas Meter
- 1.2. Smart Water Meter
- 1.3. Smart Electricity Meter
-
2. End User
- 2.1. Residential
- 2.2. Commercial
- 2.3. Industrial
Europe Smart Meter Industry Segmentation By Geography
-
1. Europe
- 1.1. United Kingdom
- 1.2. Germany
- 1.3. France
- 1.4. Italy
- 1.5. Spain
- 1.6. Netherlands
- 1.7. Belgium
- 1.8. Sweden
- 1.9. Norway
- 1.10. Poland
- 1.11. Denmark
Europe Smart Meter Industry Regional Market Share
Geographic Coverage of Europe Smart Meter Industry
Europe Smart Meter Industry REPORT HIGHLIGHTS
| Aspects | Details |
|---|---|
| Study Period | 2020-2034 |
| Base Year | 2025 |
| Estimated Year | 2026 |
| Forecast Period | 2026-2034 |
| Historical Period | 2020-2025 |
| Growth Rate | CAGR of 12.18% from 2020-2034 |
| Segmentation |
|
Table of Contents
- 1. Introduction
- 1.1. Research Scope
- 1.2. Market Segmentation
- 1.3. Research Methodology
- 1.4. Definitions and Assumptions
- 2. Executive Summary
- 2.1. Introduction
- 3. Market Dynamics
- 3.1. Introduction
- 3.2. Market Drivers
- 3.2.1. Increased Investments in Smart Grid Projects; Growth in Smart City Deployment; Supportive Government Regulations
- 3.3. Market Restrains
- 3.3.1. High Costs and Security Concerns; Integration Difficulties with Smart Meters
- 3.4. Market Trends
- 3.4.1. Increased investments in smart grid projects in expected to drive the market growth
- 4. Market Factor Analysis
- 4.1. Porters Five Forces
- 4.2. Supply/Value Chain
- 4.3. PESTEL analysis
- 4.4. Market Entropy
- 4.5. Patent/Trademark Analysis
- 5. Europe Smart Meter Industry Analysis, Insights and Forecast, 2020-2032
- 5.1. Market Analysis, Insights and Forecast - by Type of Meter (Revenue and Unit Shipments)
- 5.1.1. Smart Gas Meter
- 5.1.2. Smart Water Meter
- 5.1.3. Smart Electricity Meter
- 5.2. Market Analysis, Insights and Forecast - by End User
- 5.2.1. Residential
- 5.2.2. Commercial
- 5.2.3. Industrial
- 5.3. Market Analysis, Insights and Forecast - by Region
- 5.3.1. Europe
- 5.1. Market Analysis, Insights and Forecast - by Type of Meter (Revenue and Unit Shipments)
- 6. Competitive Analysis
- 6.1. Market Share Analysis 2025
- 6.2. Company Profiles
- 6.2.1 Itron Inc
- 6.2.1.1. Overview
- 6.2.1.2. Products
- 6.2.1.3. SWOT Analysis
- 6.2.1.4. Recent Developments
- 6.2.1.5. Financials (Based on Availability)
- 6.2.2 Badger Meter Inc
- 6.2.2.1. Overview
- 6.2.2.2. Products
- 6.2.2.3. SWOT Analysis
- 6.2.2.4. Recent Developments
- 6.2.2.5. Financials (Based on Availability)
- 6.2.3 Zenner International GmbH & Co KG
- 6.2.3.1. Overview
- 6.2.3.2. Products
- 6.2.3.3. SWOT Analysis
- 6.2.3.4. Recent Developments
- 6.2.3.5. Financials (Based on Availability)
- 6.2.4 Sensus (Xylem Inc )
- 6.2.4.1. Overview
- 6.2.4.2. Products
- 6.2.4.3. SWOT Analysis
- 6.2.4.4. Recent Developments
- 6.2.4.5. Financials (Based on Availability)
- 6.2.5 Elster Group GmbH (Honeywell International Inc)
- 6.2.5.1. Overview
- 6.2.5.2. Products
- 6.2.5.3. SWOT Analysis
- 6.2.5.4. Recent Developments
- 6.2.5.5. Financials (Based on Availability)
- 6.2.6 Kamstrup A/S
- 6.2.6.1. Overview
- 6.2.6.2. Products
- 6.2.6.3. SWOT Analysis
- 6.2.6.4. Recent Developments
- 6.2.6.5. Financials (Based on Availability)
- 6.2.7 Apator SA
- 6.2.7.1. Overview
- 6.2.7.2. Products
- 6.2.7.3. SWOT Analysis
- 6.2.7.4. Recent Developments
- 6.2.7.5. Financials (Based on Availability)
- 6.2.8 Arad Group
- 6.2.8.1. Overview
- 6.2.8.2. Products
- 6.2.8.3. SWOT Analysis
- 6.2.8.4. Recent Developments
- 6.2.8.5. Financials (Based on Availability)
- 6.2.9 Diehl Stiftung & Co KG
- 6.2.9.1. Overview
- 6.2.9.2. Products
- 6.2.9.3. SWOT Analysis
- 6.2.9.4. Recent Developments
- 6.2.9.5. Financials (Based on Availability)
- 6.2.10 Landis+ GYR Group AG
- 6.2.10.1. Overview
- 6.2.10.2. Products
- 6.2.10.3. SWOT Analysis
- 6.2.10.4. Recent Developments
- 6.2.10.5. Financials (Based on Availability)
- 6.2.11 Ningbo Sanxing Electric Co Ltd
- 6.2.11.1. Overview
- 6.2.11.2. Products
- 6.2.11.3. SWOT Analysis
- 6.2.11.4. Recent Developments
- 6.2.11.5. Financials (Based on Availability)
- 6.2.12 AEM
- 6.2.12.1. Overview
- 6.2.12.2. Products
- 6.2.12.3. SWOT Analysis
- 6.2.12.4. Recent Developments
- 6.2.12.5. Financials (Based on Availability)
- 6.2.13 General Electric Company
- 6.2.13.1. Overview
- 6.2.13.2. Products
- 6.2.13.3. SWOT Analysis
- 6.2.13.4. Recent Developments
- 6.2.13.5. Financials (Based on Availability)
- 6.2.1 Itron Inc
List of Figures
- Figure 1: Europe Smart Meter Industry Revenue Breakdown (Million, %) by Product 2025 & 2033
- Figure 2: Europe Smart Meter Industry Share (%) by Company 2025
List of Tables
- Table 1: Europe Smart Meter Industry Revenue Million Forecast, by Type of Meter (Revenue and Unit Shipments) 2020 & 2033
- Table 2: Europe Smart Meter Industry Volume K Unit Forecast, by Type of Meter (Revenue and Unit Shipments) 2020 & 2033
- Table 3: Europe Smart Meter Industry Revenue Million Forecast, by End User 2020 & 2033
- Table 4: Europe Smart Meter Industry Volume K Unit Forecast, by End User 2020 & 2033
- Table 5: Europe Smart Meter Industry Revenue Million Forecast, by Region 2020 & 2033
- Table 6: Europe Smart Meter Industry Volume K Unit Forecast, by Region 2020 & 2033
- Table 7: Europe Smart Meter Industry Revenue Million Forecast, by Type of Meter (Revenue and Unit Shipments) 2020 & 2033
- Table 8: Europe Smart Meter Industry Volume K Unit Forecast, by Type of Meter (Revenue and Unit Shipments) 2020 & 2033
- Table 9: Europe Smart Meter Industry Revenue Million Forecast, by End User 2020 & 2033
- Table 10: Europe Smart Meter Industry Volume K Unit Forecast, by End User 2020 & 2033
- Table 11: Europe Smart Meter Industry Revenue Million Forecast, by Country 2020 & 2033
- Table 12: Europe Smart Meter Industry Volume K Unit Forecast, by Country 2020 & 2033
- Table 13: United Kingdom Europe Smart Meter Industry Revenue (Million) Forecast, by Application 2020 & 2033
- Table 14: United Kingdom Europe Smart Meter Industry Volume (K Unit) Forecast, by Application 2020 & 2033
- Table 15: Germany Europe Smart Meter Industry Revenue (Million) Forecast, by Application 2020 & 2033
- Table 16: Germany Europe Smart Meter Industry Volume (K Unit) Forecast, by Application 2020 & 2033
- Table 17: France Europe Smart Meter Industry Revenue (Million) Forecast, by Application 2020 & 2033
- Table 18: France Europe Smart Meter Industry Volume (K Unit) Forecast, by Application 2020 & 2033
- Table 19: Italy Europe Smart Meter Industry Revenue (Million) Forecast, by Application 2020 & 2033
- Table 20: Italy Europe Smart Meter Industry Volume (K Unit) Forecast, by Application 2020 & 2033
- Table 21: Spain Europe Smart Meter Industry Revenue (Million) Forecast, by Application 2020 & 2033
- Table 22: Spain Europe Smart Meter Industry Volume (K Unit) Forecast, by Application 2020 & 2033
- Table 23: Netherlands Europe Smart Meter Industry Revenue (Million) Forecast, by Application 2020 & 2033
- Table 24: Netherlands Europe Smart Meter Industry Volume (K Unit) Forecast, by Application 2020 & 2033
- Table 25: Belgium Europe Smart Meter Industry Revenue (Million) Forecast, by Application 2020 & 2033
- Table 26: Belgium Europe Smart Meter Industry Volume (K Unit) Forecast, by Application 2020 & 2033
- Table 27: Sweden Europe Smart Meter Industry Revenue (Million) Forecast, by Application 2020 & 2033
- Table 28: Sweden Europe Smart Meter Industry Volume (K Unit) Forecast, by Application 2020 & 2033
- Table 29: Norway Europe Smart Meter Industry Revenue (Million) Forecast, by Application 2020 & 2033
- Table 30: Norway Europe Smart Meter Industry Volume (K Unit) Forecast, by Application 2020 & 2033
- Table 31: Poland Europe Smart Meter Industry Revenue (Million) Forecast, by Application 2020 & 2033
- Table 32: Poland Europe Smart Meter Industry Volume (K Unit) Forecast, by Application 2020 & 2033
- Table 33: Denmark Europe Smart Meter Industry Revenue (Million) Forecast, by Application 2020 & 2033
- Table 34: Denmark Europe Smart Meter Industry Volume (K Unit) Forecast, by Application 2020 & 2033
Frequently Asked Questions
1. What is the projected Compound Annual Growth Rate (CAGR) of the Europe Smart Meter Industry?
The projected CAGR is approximately 12.18%.
2. Which companies are prominent players in the Europe Smart Meter Industry?
Key companies in the market include Itron Inc, Badger Meter Inc, Zenner International GmbH & Co KG, Sensus (Xylem Inc ), Elster Group GmbH (Honeywell International Inc), Kamstrup A/S, Apator SA, Arad Group, Diehl Stiftung & Co KG, Landis+ GYR Group AG, Ningbo Sanxing Electric Co Ltd, AEM, General Electric Company.
3. What are the main segments of the Europe Smart Meter Industry?
The market segments include Type of Meter (Revenue and Unit Shipments), End User.
4. Can you provide details about the market size?
The market size is estimated to be USD 6.71 Million as of 2022.
5. What are some drivers contributing to market growth?
Increased Investments in Smart Grid Projects; Growth in Smart City Deployment; Supportive Government Regulations.
6. What are the notable trends driving market growth?
Increased investments in smart grid projects in expected to drive the market growth.
7. Are there any restraints impacting market growth?
High Costs and Security Concerns; Integration Difficulties with Smart Meters.
8. Can you provide examples of recent developments in the market?
December 2022: Trilliant, a leading provider of solutions for advanced metering infrastructure (AMI), smart cities, smart grid, and IIoT, announced the selection of its UK division, Trilliant Networks Operations (UK) Ltd., as one of the suppliers to provide smart meters to support the rollout of Ireland’s National Smart Metering Programme (NSMP) by ESB Networks. The program aims to help customers manage their energy use, save money, and lower their carbon footprint.
9. What pricing options are available for accessing the report?
Pricing options include single-user, multi-user, and enterprise licenses priced at USD 3800, USD 4500, and USD 5800 respectively.
10. Is the market size provided in terms of value or volume?
The market size is provided in terms of value, measured in Million and volume, measured in K Unit.
11. Are there any specific market keywords associated with the report?
Yes, the market keyword associated with the report is "Europe Smart Meter Industry," which aids in identifying and referencing the specific market segment covered.
12. How do I determine which pricing option suits my needs best?
The pricing options vary based on user requirements and access needs. Individual users may opt for single-user licenses, while businesses requiring broader access may choose multi-user or enterprise licenses for cost-effective access to the report.
13. Are there any additional resources or data provided in the Europe Smart Meter Industry report?
While the report offers comprehensive insights, it's advisable to review the specific contents or supplementary materials provided to ascertain if additional resources or data are available.
14. How can I stay updated on further developments or reports in the Europe Smart Meter Industry?
To stay informed about further developments, trends, and reports in the Europe Smart Meter Industry, consider subscribing to industry newsletters, following relevant companies and organizations, or regularly checking reputable industry news sources and publications.
Methodology
Step 1 - Identification of Relevant Samples Size from Population Database


Step 2 - Approaches for Defining Global Market Size (Value, Volume* & Price*)

Note*: In applicable scenarios
Step 3 - Data Sources
Primary Research
- Web Analytics
- Survey Reports
- Research Institute
- Latest Research Reports
- Opinion Leaders
Secondary Research
- Annual Reports
- White Paper
- Latest Press Release
- Industry Association
- Paid Database
- Investor Presentations

Step 4 - Data Triangulation
Involves using different sources of information in order to increase the validity of a study
These sources are likely to be stakeholders in a program - participants, other researchers, program staff, other community members, and so on.
Then we put all data in single framework & apply various statistical tools to find out the dynamic on the market.
During the analysis stage, feedback from the stakeholder groups would be compared to determine areas of agreement as well as areas of divergence

