
Key Insights
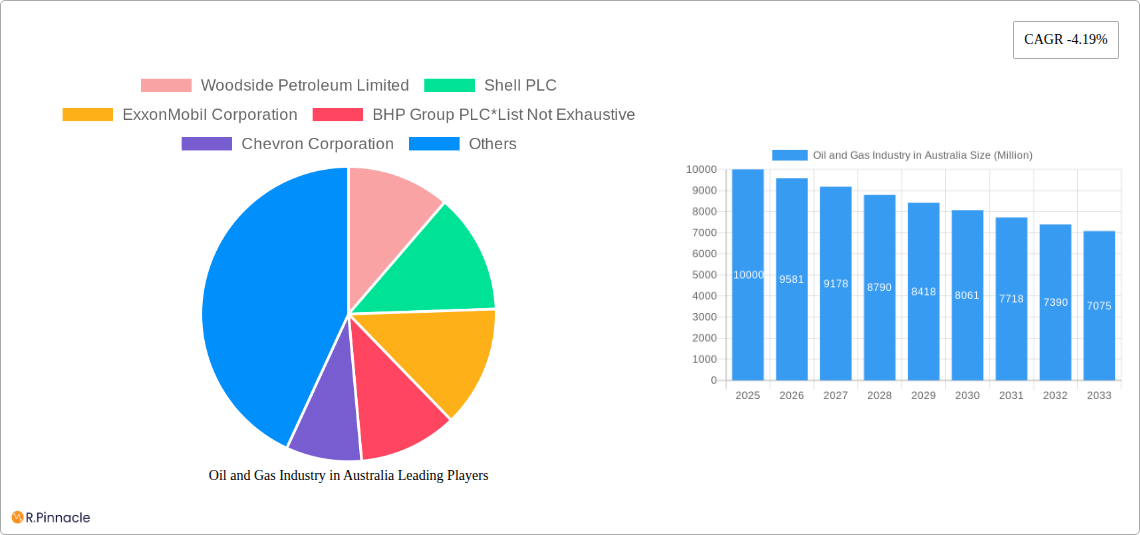
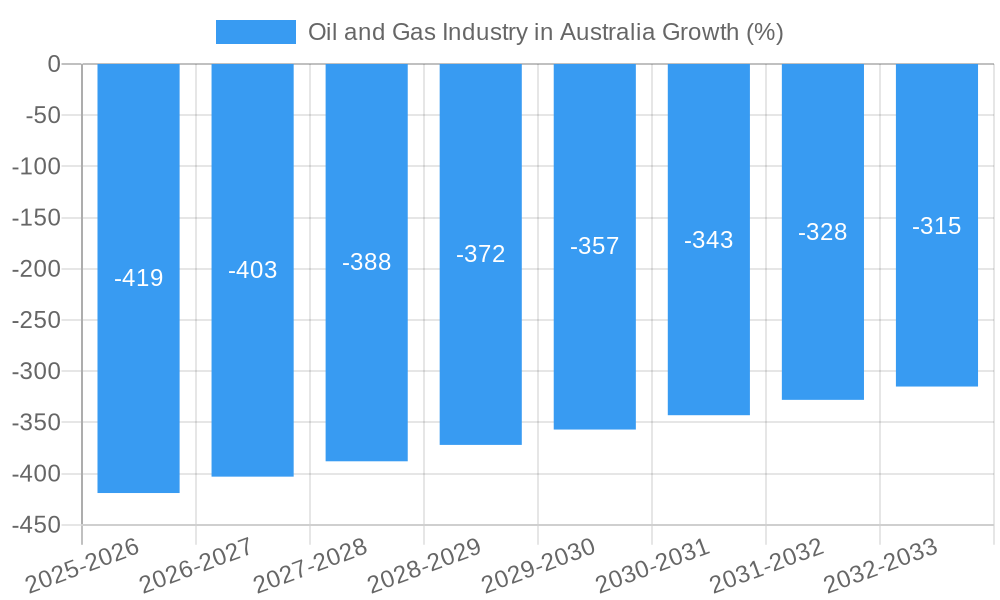
The Australian oil and gas market, while exhibiting a negative CAGR of -4.19% between 2019 and 2024, presents a complex picture for the forecast period of 2025-2033. The decline is likely attributable to several factors including increased focus on renewable energy sources, fluctuating global energy prices, and government regulations aimed at reducing carbon emissions. However, Australia's substantial reserves and established infrastructure continue to support a significant market. The major segments, crude oil, natural gas, and LNG, each contribute differently to the overall market value. Power generation remains a primary application, followed by transportation and industrial uses, while residential consumption contributes a smaller percentage. Leading companies like Woodside Petroleum, Shell, ExxonMobil, and BHP Group continue to play a dominant role, shaping production and export strategies. Future market performance will depend heavily on global energy demand, technological advancements in renewable energy, government policies supporting energy transition, and the potential for new discoveries and infrastructure developments.
The Australian oil and gas industry faces considerable challenges in the coming decade, navigating the complexities of a global energy transition. While a negative CAGR indicates contraction, the absolute market size remains substantial, driven by continued domestic demand and export opportunities, particularly for LNG. The industry's response to environmental concerns and government incentives for renewable energy will heavily influence its trajectory. Strategic investments in carbon capture and storage technologies, diversification into renewable energy portfolios, and enhanced operational efficiency will likely be critical for the survival and growth of key players. Furthermore, geopolitical factors and global energy price volatility will introduce uncertainty, requiring robust risk management and adaptive business strategies. The shift towards cleaner energy is undeniable, but the substantial existing infrastructure and continued demand for fossil fuels will ensure a continued, albeit potentially reduced, role for oil and gas in the Australian economy for the foreseeable future.
Oil and Gas Industry in Australia: 2019-2033 Market Report
This comprehensive report provides an in-depth analysis of the Australian oil and gas industry, offering invaluable insights for industry professionals, investors, and strategic decision-makers. Covering the period 2019-2033, with a base year of 2025 and forecast period of 2025-2033, this report leverages historical data (2019-2024) to predict future trends and opportunities. Key players such as Woodside Petroleum Limited, Shell PLC, ExxonMobil Corporation, BHP Group PLC, Chevron Corporation, TotalEnergies SE, and BP PLC are analyzed, although the list is not exhaustive. The report segments the market by type (Crude Oil, Natural Gas, Liquefied Natural Gas (LNG)) and application (Power Generation, Transportation, Industrial, Residential), providing granular market sizing and growth projections in millions of Australian dollars.
Oil and Gas Industry in Australia Market Structure & Innovation Trends
This section analyzes the competitive landscape, innovation drivers, and regulatory environment of Australia's oil and gas sector. Market concentration is examined through metrics like market share held by major players (e.g., Woodside Petroleum Limited holding xx% market share in LNG in 2025), highlighting the influence of mergers and acquisitions (M&A). The report details M&A activity, including deal values (e.g., a total of xx Million AUD in M&A deals in 2024), and their impact on market structure. Innovation drivers, such as government policies promoting carbon capture and storage (CCS) or investments in renewable natural gas (RNG), are thoroughly explored. Regulatory frameworks, including environmental regulations and licensing procedures, are analyzed alongside the impact of substitute products (e.g., renewables) and shifting end-user demographics.
Oil and Gas Industry in Australia Market Dynamics & Trends
This section delves into the key dynamics shaping the Australian oil and gas market. Market growth drivers, including increasing energy demand and government infrastructure projects, are assessed, alongside a quantitative analysis of the Compound Annual Growth Rate (CAGR) and market penetration for each segment. The report examines technological disruptions, such as the adoption of automation and digitalization, and their impact on efficiency and cost reduction. Consumer preferences, including the growing demand for cleaner energy sources, and competitive dynamics amongst major and minor players, are also explored. The section presents a detailed view of the market's overall trajectory during the study period.
Dominant Regions & Segments in Oil and Gas Industry in Australia
This section identifies the leading regions and segments within the Australian oil and gas industry. A comprehensive dominance analysis is provided, detailing the reasons behind the leadership of specific regions and segments.
- Key Drivers for Dominant Segments:
- LNG: Strong export demand, supported by existing infrastructure and government initiatives.
- Crude Oil: Relatively stable demand from domestic and international markets.
- Natural Gas: Growth driven by industrial and residential demand.
- Power Generation: Significant role of gas-fired power plants in the energy mix.
- Transportation: Demand in the transport sector remains significant despite the growing adoption of electric vehicles.
- Industrial: Continued industrial usage despite green alternatives gaining traction.
- Residential: Relatively stable demand despite the increase in renewable energy sources at household levels.
Oil and Gas Industry in Australia Product Innovations
This section summarizes recent product developments, their applications, and resulting competitive advantages. Technological trends, such as advancements in exploration and production technologies (e.g., enhanced oil recovery) and innovations in LNG processing and transportation are examined. The analysis emphasizes the market fit and commercial viability of these innovations within the context of the Australian market.
Report Scope & Segmentation Analysis
This report segments the Australian oil and gas market by both product type (Crude Oil, Natural Gas, LNG) and application (Power Generation, Transportation, Industrial, Residential). Each segment's market size, growth projections (e.g., LNG projected to grow at xx% CAGR from 2025 to 2033), and competitive dynamics are comprehensively analyzed. Detailed information is given about the current market size and its anticipated expansion for each specified segment.
Key Drivers of Oil and Gas Industry in Australia Growth
The growth of the Australian oil and gas industry is driven by several factors. These include sustained domestic demand, particularly in the power generation and industrial sectors, and strong export markets for LNG. Government policies supporting resource development, coupled with technological advancements in exploration and extraction, contribute significantly to the sector's expansion. Infrastructure projects, such as new pipelines, also bolster overall growth.
Challenges in the Oil and Gas Industry in Australia Sector
The Australian oil and gas sector faces significant challenges, including increasing environmental regulations and pressures to reduce carbon emissions. Supply chain disruptions can lead to project delays and cost overruns. Fluctuations in global energy prices and intensifying competition also pose ongoing difficulties for industry players. These challenges potentially impact profitability and investment decisions by xx Million AUD annually.
Emerging Opportunities in Oil and Gas Industry in Australia
The Australian oil and gas industry presents several emerging opportunities. These include growing demand for cleaner energy sources, such as renewable natural gas (RNG) and the potential for carbon capture and storage (CCS) technology to mitigate emissions. Exploration and development of new gas resources also offer significant potential for growth and increased production. Investing in innovative and sustainable practices can unlock new market segments and attract investors.
Leading Players in the Oil and Gas Industry in Australia Market
- Woodside Petroleum Limited
- Shell PLC
- ExxonMobil Corporation
- BHP Group PLC
- Chevron Corporation
- TotalEnergies SE
- BP PLC
Key Developments in Oil and Gas Industry in Australia Industry
- September 2022: Santos Ltd. sanctioned a USD 300 Million pipeline project, expanding its Darwin LNG facility's capacity and boosting export potential.
- March 2023: ConocoPhillips acquired a near-50% stake in Australia Pacific LNG (APLNG), significantly altering the market's competitive landscape and signaling increased investment in the sector. This move is expected to increase their production capacity by xx Million barrels of oil equivalent.
Future Outlook for Oil and Gas Industry in Australia Market
The Australian oil and gas industry is poised for continued growth, driven by strong domestic and export demand. Strategic investments in new technologies and infrastructure, coupled with a focus on environmental sustainability, will shape the sector's future trajectory. Opportunities exist in LNG exports and the potential for carbon capture and storage (CCS) to enhance the industry's long-term viability. However, navigating environmental concerns and regulatory changes will be crucial for sustained success.
Oil and Gas Industry in Australia Segmentation
- 1. Upstream
- 2. Midstream
- 3. Downstream
Oil and Gas Industry in Australia Segmentation By Geography
-
1. North America
- 1.1. United States
- 1.2. Canada
- 1.3. Mexico
-
2. South America
- 2.1. Brazil
- 2.2. Argentina
- 2.3. Rest of South America
-
3. Europe
- 3.1. United Kingdom
- 3.2. Germany
- 3.3. France
- 3.4. Italy
- 3.5. Spain
- 3.6. Russia
- 3.7. Benelux
- 3.8. Nordics
- 3.9. Rest of Europe
-
4. Middle East & Africa
- 4.1. Turkey
- 4.2. Israel
- 4.3. GCC
- 4.4. North Africa
- 4.5. South Africa
- 4.6. Rest of Middle East & Africa
-
5. Asia Pacific
- 5.1. China
- 5.2. India
- 5.3. Japan
- 5.4. South Korea
- 5.5. ASEAN
- 5.6. Oceania
- 5.7. Rest of Asia Pacific
Oil and Gas Industry in Australia REPORT HIGHLIGHTS
| Aspects | Details |
|---|---|
| Study Period | 2019-2033 |
| Base Year | 2024 |
| Estimated Year | 2025 |
| Forecast Period | 2025-2033 |
| Historical Period | 2019-2024 |
| Growth Rate | CAGR of -4.19% from 2019-2033 |
| Segmentation |
|
Table of Contents
- 1. Introduction
- 1.1. Research Scope
- 1.2. Market Segmentation
- 1.3. Research Methodology
- 1.4. Definitions and Assumptions
- 2. Executive Summary
- 2.1. Introduction
- 3. Market Dynamics
- 3.1. Introduction
- 3.2. Market Drivers
- 3.2.1. 4.; Increasing Natural Gas Demand4.; Rising Pipeline Network and Associated Infrastructure Development
- 3.3. Market Restrains
- 3.3.1. 4.; Rising Shift toward Renewable Energy
- 3.4. Market Trends
- 3.4.1. Midstream Segment Expected to Witness Significant Demand
- 4. Market Factor Analysis
- 4.1. Porters Five Forces
- 4.2. Supply/Value Chain
- 4.3. PESTEL analysis
- 4.4. Market Entropy
- 4.5. Patent/Trademark Analysis
- 5. Global Oil and Gas Industry in Australia Analysis, Insights and Forecast, 2019-2031
- 5.1. Market Analysis, Insights and Forecast - by Upstream
- 5.2. Market Analysis, Insights and Forecast - by Midstream
- 5.3. Market Analysis, Insights and Forecast - by Downstream
- 5.4. Market Analysis, Insights and Forecast - by Region
- 5.4.1. North America
- 5.4.2. South America
- 5.4.3. Europe
- 5.4.4. Middle East & Africa
- 5.4.5. Asia Pacific
- 5.1. Market Analysis, Insights and Forecast - by Upstream
- 6. North America Oil and Gas Industry in Australia Analysis, Insights and Forecast, 2019-2031
- 6.1. Market Analysis, Insights and Forecast - by Upstream
- 6.2. Market Analysis, Insights and Forecast - by Midstream
- 6.3. Market Analysis, Insights and Forecast - by Downstream
- 6.1. Market Analysis, Insights and Forecast - by Upstream
- 7. South America Oil and Gas Industry in Australia Analysis, Insights and Forecast, 2019-2031
- 7.1. Market Analysis, Insights and Forecast - by Upstream
- 7.2. Market Analysis, Insights and Forecast - by Midstream
- 7.3. Market Analysis, Insights and Forecast - by Downstream
- 7.1. Market Analysis, Insights and Forecast - by Upstream
- 8. Europe Oil and Gas Industry in Australia Analysis, Insights and Forecast, 2019-2031
- 8.1. Market Analysis, Insights and Forecast - by Upstream
- 8.2. Market Analysis, Insights and Forecast - by Midstream
- 8.3. Market Analysis, Insights and Forecast - by Downstream
- 8.1. Market Analysis, Insights and Forecast - by Upstream
- 9. Middle East & Africa Oil and Gas Industry in Australia Analysis, Insights and Forecast, 2019-2031
- 9.1. Market Analysis, Insights and Forecast - by Upstream
- 9.2. Market Analysis, Insights and Forecast - by Midstream
- 9.3. Market Analysis, Insights and Forecast - by Downstream
- 9.1. Market Analysis, Insights and Forecast - by Upstream
- 10. Asia Pacific Oil and Gas Industry in Australia Analysis, Insights and Forecast, 2019-2031
- 10.1. Market Analysis, Insights and Forecast - by Upstream
- 10.2. Market Analysis, Insights and Forecast - by Midstream
- 10.3. Market Analysis, Insights and Forecast - by Downstream
- 10.1. Market Analysis, Insights and Forecast - by Upstream
- 11. Competitive Analysis
- 11.1. Global Market Share Analysis 2024
- 11.2. Company Profiles
- 11.2.1 Woodside Petroleum Limited
- 11.2.1.1. Overview
- 11.2.1.2. Products
- 11.2.1.3. SWOT Analysis
- 11.2.1.4. Recent Developments
- 11.2.1.5. Financials (Based on Availability)
- 11.2.2 Shell PLC
- 11.2.2.1. Overview
- 11.2.2.2. Products
- 11.2.2.3. SWOT Analysis
- 11.2.2.4. Recent Developments
- 11.2.2.5. Financials (Based on Availability)
- 11.2.3 ExxonMobil Corporation
- 11.2.3.1. Overview
- 11.2.3.2. Products
- 11.2.3.3. SWOT Analysis
- 11.2.3.4. Recent Developments
- 11.2.3.5. Financials (Based on Availability)
- 11.2.4 BHP Group PLC*List Not Exhaustive
- 11.2.4.1. Overview
- 11.2.4.2. Products
- 11.2.4.3. SWOT Analysis
- 11.2.4.4. Recent Developments
- 11.2.4.5. Financials (Based on Availability)
- 11.2.5 Chevron Corporation
- 11.2.5.1. Overview
- 11.2.5.2. Products
- 11.2.5.3. SWOT Analysis
- 11.2.5.4. Recent Developments
- 11.2.5.5. Financials (Based on Availability)
- 11.2.6 TotalEnergies SE
- 11.2.6.1. Overview
- 11.2.6.2. Products
- 11.2.6.3. SWOT Analysis
- 11.2.6.4. Recent Developments
- 11.2.6.5. Financials (Based on Availability)
- 11.2.7 BP PLC
- 11.2.7.1. Overview
- 11.2.7.2. Products
- 11.2.7.3. SWOT Analysis
- 11.2.7.4. Recent Developments
- 11.2.7.5. Financials (Based on Availability)
- 11.2.1 Woodside Petroleum Limited
List of Figures
- Figure 1: Global Oil and Gas Industry in Australia Revenue Breakdown (Million, %) by Region 2024 & 2032
- Figure 2: Global Oil and Gas Industry in Australia Volume Breakdown (K Tons, %) by Region 2024 & 2032
- Figure 3: Australia Oil and Gas Industry in Australia Revenue (Million), by Country 2024 & 2032
- Figure 4: Australia Oil and Gas Industry in Australia Volume (K Tons), by Country 2024 & 2032
- Figure 5: Australia Oil and Gas Industry in Australia Revenue Share (%), by Country 2024 & 2032
- Figure 6: Australia Oil and Gas Industry in Australia Volume Share (%), by Country 2024 & 2032
- Figure 7: North America Oil and Gas Industry in Australia Revenue (Million), by Upstream 2024 & 2032
- Figure 8: North America Oil and Gas Industry in Australia Volume (K Tons), by Upstream 2024 & 2032
- Figure 9: North America Oil and Gas Industry in Australia Revenue Share (%), by Upstream 2024 & 2032
- Figure 10: North America Oil and Gas Industry in Australia Volume Share (%), by Upstream 2024 & 2032
- Figure 11: North America Oil and Gas Industry in Australia Revenue (Million), by Midstream 2024 & 2032
- Figure 12: North America Oil and Gas Industry in Australia Volume (K Tons), by Midstream 2024 & 2032
- Figure 13: North America Oil and Gas Industry in Australia Revenue Share (%), by Midstream 2024 & 2032
- Figure 14: North America Oil and Gas Industry in Australia Volume Share (%), by Midstream 2024 & 2032
- Figure 15: North America Oil and Gas Industry in Australia Revenue (Million), by Downstream 2024 & 2032
- Figure 16: North America Oil and Gas Industry in Australia Volume (K Tons), by Downstream 2024 & 2032
- Figure 17: North America Oil and Gas Industry in Australia Revenue Share (%), by Downstream 2024 & 2032
- Figure 18: North America Oil and Gas Industry in Australia Volume Share (%), by Downstream 2024 & 2032
- Figure 19: North America Oil and Gas Industry in Australia Revenue (Million), by Country 2024 & 2032
- Figure 20: North America Oil and Gas Industry in Australia Volume (K Tons), by Country 2024 & 2032
- Figure 21: North America Oil and Gas Industry in Australia Revenue Share (%), by Country 2024 & 2032
- Figure 22: North America Oil and Gas Industry in Australia Volume Share (%), by Country 2024 & 2032
- Figure 23: South America Oil and Gas Industry in Australia Revenue (Million), by Upstream 2024 & 2032
- Figure 24: South America Oil and Gas Industry in Australia Volume (K Tons), by Upstream 2024 & 2032
- Figure 25: South America Oil and Gas Industry in Australia Revenue Share (%), by Upstream 2024 & 2032
- Figure 26: South America Oil and Gas Industry in Australia Volume Share (%), by Upstream 2024 & 2032
- Figure 27: South America Oil and Gas Industry in Australia Revenue (Million), by Midstream 2024 & 2032
- Figure 28: South America Oil and Gas Industry in Australia Volume (K Tons), by Midstream 2024 & 2032
- Figure 29: South America Oil and Gas Industry in Australia Revenue Share (%), by Midstream 2024 & 2032
- Figure 30: South America Oil and Gas Industry in Australia Volume Share (%), by Midstream 2024 & 2032
- Figure 31: South America Oil and Gas Industry in Australia Revenue (Million), by Downstream 2024 & 2032
- Figure 32: South America Oil and Gas Industry in Australia Volume (K Tons), by Downstream 2024 & 2032
- Figure 33: South America Oil and Gas Industry in Australia Revenue Share (%), by Downstream 2024 & 2032
- Figure 34: South America Oil and Gas Industry in Australia Volume Share (%), by Downstream 2024 & 2032
- Figure 35: South America Oil and Gas Industry in Australia Revenue (Million), by Country 2024 & 2032
- Figure 36: South America Oil and Gas Industry in Australia Volume (K Tons), by Country 2024 & 2032
- Figure 37: South America Oil and Gas Industry in Australia Revenue Share (%), by Country 2024 & 2032
- Figure 38: South America Oil and Gas Industry in Australia Volume Share (%), by Country 2024 & 2032
- Figure 39: Europe Oil and Gas Industry in Australia Revenue (Million), by Upstream 2024 & 2032
- Figure 40: Europe Oil and Gas Industry in Australia Volume (K Tons), by Upstream 2024 & 2032
- Figure 41: Europe Oil and Gas Industry in Australia Revenue Share (%), by Upstream 2024 & 2032
- Figure 42: Europe Oil and Gas Industry in Australia Volume Share (%), by Upstream 2024 & 2032
- Figure 43: Europe Oil and Gas Industry in Australia Revenue (Million), by Midstream 2024 & 2032
- Figure 44: Europe Oil and Gas Industry in Australia Volume (K Tons), by Midstream 2024 & 2032
- Figure 45: Europe Oil and Gas Industry in Australia Revenue Share (%), by Midstream 2024 & 2032
- Figure 46: Europe Oil and Gas Industry in Australia Volume Share (%), by Midstream 2024 & 2032
- Figure 47: Europe Oil and Gas Industry in Australia Revenue (Million), by Downstream 2024 & 2032
- Figure 48: Europe Oil and Gas Industry in Australia Volume (K Tons), by Downstream 2024 & 2032
- Figure 49: Europe Oil and Gas Industry in Australia Revenue Share (%), by Downstream 2024 & 2032
- Figure 50: Europe Oil and Gas Industry in Australia Volume Share (%), by Downstream 2024 & 2032
- Figure 51: Europe Oil and Gas Industry in Australia Revenue (Million), by Country 2024 & 2032
- Figure 52: Europe Oil and Gas Industry in Australia Volume (K Tons), by Country 2024 & 2032
- Figure 53: Europe Oil and Gas Industry in Australia Revenue Share (%), by Country 2024 & 2032
- Figure 54: Europe Oil and Gas Industry in Australia Volume Share (%), by Country 2024 & 2032
- Figure 55: Middle East & Africa Oil and Gas Industry in Australia Revenue (Million), by Upstream 2024 & 2032
- Figure 56: Middle East & Africa Oil and Gas Industry in Australia Volume (K Tons), by Upstream 2024 & 2032
- Figure 57: Middle East & Africa Oil and Gas Industry in Australia Revenue Share (%), by Upstream 2024 & 2032
- Figure 58: Middle East & Africa Oil and Gas Industry in Australia Volume Share (%), by Upstream 2024 & 2032
- Figure 59: Middle East & Africa Oil and Gas Industry in Australia Revenue (Million), by Midstream 2024 & 2032
- Figure 60: Middle East & Africa Oil and Gas Industry in Australia Volume (K Tons), by Midstream 2024 & 2032
- Figure 61: Middle East & Africa Oil and Gas Industry in Australia Revenue Share (%), by Midstream 2024 & 2032
- Figure 62: Middle East & Africa Oil and Gas Industry in Australia Volume Share (%), by Midstream 2024 & 2032
- Figure 63: Middle East & Africa Oil and Gas Industry in Australia Revenue (Million), by Downstream 2024 & 2032
- Figure 64: Middle East & Africa Oil and Gas Industry in Australia Volume (K Tons), by Downstream 2024 & 2032
- Figure 65: Middle East & Africa Oil and Gas Industry in Australia Revenue Share (%), by Downstream 2024 & 2032
- Figure 66: Middle East & Africa Oil and Gas Industry in Australia Volume Share (%), by Downstream 2024 & 2032
- Figure 67: Middle East & Africa Oil and Gas Industry in Australia Revenue (Million), by Country 2024 & 2032
- Figure 68: Middle East & Africa Oil and Gas Industry in Australia Volume (K Tons), by Country 2024 & 2032
- Figure 69: Middle East & Africa Oil and Gas Industry in Australia Revenue Share (%), by Country 2024 & 2032
- Figure 70: Middle East & Africa Oil and Gas Industry in Australia Volume Share (%), by Country 2024 & 2032
- Figure 71: Asia Pacific Oil and Gas Industry in Australia Revenue (Million), by Upstream 2024 & 2032
- Figure 72: Asia Pacific Oil and Gas Industry in Australia Volume (K Tons), by Upstream 2024 & 2032
- Figure 73: Asia Pacific Oil and Gas Industry in Australia Revenue Share (%), by Upstream 2024 & 2032
- Figure 74: Asia Pacific Oil and Gas Industry in Australia Volume Share (%), by Upstream 2024 & 2032
- Figure 75: Asia Pacific Oil and Gas Industry in Australia Revenue (Million), by Midstream 2024 & 2032
- Figure 76: Asia Pacific Oil and Gas Industry in Australia Volume (K Tons), by Midstream 2024 & 2032
- Figure 77: Asia Pacific Oil and Gas Industry in Australia Revenue Share (%), by Midstream 2024 & 2032
- Figure 78: Asia Pacific Oil and Gas Industry in Australia Volume Share (%), by Midstream 2024 & 2032
- Figure 79: Asia Pacific Oil and Gas Industry in Australia Revenue (Million), by Downstream 2024 & 2032
- Figure 80: Asia Pacific Oil and Gas Industry in Australia Volume (K Tons), by Downstream 2024 & 2032
- Figure 81: Asia Pacific Oil and Gas Industry in Australia Revenue Share (%), by Downstream 2024 & 2032
- Figure 82: Asia Pacific Oil and Gas Industry in Australia Volume Share (%), by Downstream 2024 & 2032
- Figure 83: Asia Pacific Oil and Gas Industry in Australia Revenue (Million), by Country 2024 & 2032
- Figure 84: Asia Pacific Oil and Gas Industry in Australia Volume (K Tons), by Country 2024 & 2032
- Figure 85: Asia Pacific Oil and Gas Industry in Australia Revenue Share (%), by Country 2024 & 2032
- Figure 86: Asia Pacific Oil and Gas Industry in Australia Volume Share (%), by Country 2024 & 2032
List of Tables
- Table 1: Global Oil and Gas Industry in Australia Revenue Million Forecast, by Region 2019 & 2032
- Table 2: Global Oil and Gas Industry in Australia Volume K Tons Forecast, by Region 2019 & 2032
- Table 3: Global Oil and Gas Industry in Australia Revenue Million Forecast, by Upstream 2019 & 2032
- Table 4: Global Oil and Gas Industry in Australia Volume K Tons Forecast, by Upstream 2019 & 2032
- Table 5: Global Oil and Gas Industry in Australia Revenue Million Forecast, by Midstream 2019 & 2032
- Table 6: Global Oil and Gas Industry in Australia Volume K Tons Forecast, by Midstream 2019 & 2032
- Table 7: Global Oil and Gas Industry in Australia Revenue Million Forecast, by Downstream 2019 & 2032
- Table 8: Global Oil and Gas Industry in Australia Volume K Tons Forecast, by Downstream 2019 & 2032
- Table 9: Global Oil and Gas Industry in Australia Revenue Million Forecast, by Region 2019 & 2032
- Table 10: Global Oil and Gas Industry in Australia Volume K Tons Forecast, by Region 2019 & 2032
- Table 11: Global Oil and Gas Industry in Australia Revenue Million Forecast, by Country 2019 & 2032
- Table 12: Global Oil and Gas Industry in Australia Volume K Tons Forecast, by Country 2019 & 2032
- Table 13: Global Oil and Gas Industry in Australia Revenue Million Forecast, by Upstream 2019 & 2032
- Table 14: Global Oil and Gas Industry in Australia Volume K Tons Forecast, by Upstream 2019 & 2032
- Table 15: Global Oil and Gas Industry in Australia Revenue Million Forecast, by Midstream 2019 & 2032
- Table 16: Global Oil and Gas Industry in Australia Volume K Tons Forecast, by Midstream 2019 & 2032
- Table 17: Global Oil and Gas Industry in Australia Revenue Million Forecast, by Downstream 2019 & 2032
- Table 18: Global Oil and Gas Industry in Australia Volume K Tons Forecast, by Downstream 2019 & 2032
- Table 19: Global Oil and Gas Industry in Australia Revenue Million Forecast, by Country 2019 & 2032
- Table 20: Global Oil and Gas Industry in Australia Volume K Tons Forecast, by Country 2019 & 2032
- Table 21: United States Oil and Gas Industry in Australia Revenue (Million) Forecast, by Application 2019 & 2032
- Table 22: United States Oil and Gas Industry in Australia Volume (K Tons) Forecast, by Application 2019 & 2032
- Table 23: Canada Oil and Gas Industry in Australia Revenue (Million) Forecast, by Application 2019 & 2032
- Table 24: Canada Oil and Gas Industry in Australia Volume (K Tons) Forecast, by Application 2019 & 2032
- Table 25: Mexico Oil and Gas Industry in Australia Revenue (Million) Forecast, by Application 2019 & 2032
- Table 26: Mexico Oil and Gas Industry in Australia Volume (K Tons) Forecast, by Application 2019 & 2032
- Table 27: Global Oil and Gas Industry in Australia Revenue Million Forecast, by Upstream 2019 & 2032
- Table 28: Global Oil and Gas Industry in Australia Volume K Tons Forecast, by Upstream 2019 & 2032
- Table 29: Global Oil and Gas Industry in Australia Revenue Million Forecast, by Midstream 2019 & 2032
- Table 30: Global Oil and Gas Industry in Australia Volume K Tons Forecast, by Midstream 2019 & 2032
- Table 31: Global Oil and Gas Industry in Australia Revenue Million Forecast, by Downstream 2019 & 2032
- Table 32: Global Oil and Gas Industry in Australia Volume K Tons Forecast, by Downstream 2019 & 2032
- Table 33: Global Oil and Gas Industry in Australia Revenue Million Forecast, by Country 2019 & 2032
- Table 34: Global Oil and Gas Industry in Australia Volume K Tons Forecast, by Country 2019 & 2032
- Table 35: Brazil Oil and Gas Industry in Australia Revenue (Million) Forecast, by Application 2019 & 2032
- Table 36: Brazil Oil and Gas Industry in Australia Volume (K Tons) Forecast, by Application 2019 & 2032
- Table 37: Argentina Oil and Gas Industry in Australia Revenue (Million) Forecast, by Application 2019 & 2032
- Table 38: Argentina Oil and Gas Industry in Australia Volume (K Tons) Forecast, by Application 2019 & 2032
- Table 39: Rest of South America Oil and Gas Industry in Australia Revenue (Million) Forecast, by Application 2019 & 2032
- Table 40: Rest of South America Oil and Gas Industry in Australia Volume (K Tons) Forecast, by Application 2019 & 2032
- Table 41: Global Oil and Gas Industry in Australia Revenue Million Forecast, by Upstream 2019 & 2032
- Table 42: Global Oil and Gas Industry in Australia Volume K Tons Forecast, by Upstream 2019 & 2032
- Table 43: Global Oil and Gas Industry in Australia Revenue Million Forecast, by Midstream 2019 & 2032
- Table 44: Global Oil and Gas Industry in Australia Volume K Tons Forecast, by Midstream 2019 & 2032
- Table 45: Global Oil and Gas Industry in Australia Revenue Million Forecast, by Downstream 2019 & 2032
- Table 46: Global Oil and Gas Industry in Australia Volume K Tons Forecast, by Downstream 2019 & 2032
- Table 47: Global Oil and Gas Industry in Australia Revenue Million Forecast, by Country 2019 & 2032
- Table 48: Global Oil and Gas Industry in Australia Volume K Tons Forecast, by Country 2019 & 2032
- Table 49: United Kingdom Oil and Gas Industry in Australia Revenue (Million) Forecast, by Application 2019 & 2032
- Table 50: United Kingdom Oil and Gas Industry in Australia Volume (K Tons) Forecast, by Application 2019 & 2032
- Table 51: Germany Oil and Gas Industry in Australia Revenue (Million) Forecast, by Application 2019 & 2032
- Table 52: Germany Oil and Gas Industry in Australia Volume (K Tons) Forecast, by Application 2019 & 2032
- Table 53: France Oil and Gas Industry in Australia Revenue (Million) Forecast, by Application 2019 & 2032
- Table 54: France Oil and Gas Industry in Australia Volume (K Tons) Forecast, by Application 2019 & 2032
- Table 55: Italy Oil and Gas Industry in Australia Revenue (Million) Forecast, by Application 2019 & 2032
- Table 56: Italy Oil and Gas Industry in Australia Volume (K Tons) Forecast, by Application 2019 & 2032
- Table 57: Spain Oil and Gas Industry in Australia Revenue (Million) Forecast, by Application 2019 & 2032
- Table 58: Spain Oil and Gas Industry in Australia Volume (K Tons) Forecast, by Application 2019 & 2032
- Table 59: Russia Oil and Gas Industry in Australia Revenue (Million) Forecast, by Application 2019 & 2032
- Table 60: Russia Oil and Gas Industry in Australia Volume (K Tons) Forecast, by Application 2019 & 2032
- Table 61: Benelux Oil and Gas Industry in Australia Revenue (Million) Forecast, by Application 2019 & 2032
- Table 62: Benelux Oil and Gas Industry in Australia Volume (K Tons) Forecast, by Application 2019 & 2032
- Table 63: Nordics Oil and Gas Industry in Australia Revenue (Million) Forecast, by Application 2019 & 2032
- Table 64: Nordics Oil and Gas Industry in Australia Volume (K Tons) Forecast, by Application 2019 & 2032
- Table 65: Rest of Europe Oil and Gas Industry in Australia Revenue (Million) Forecast, by Application 2019 & 2032
- Table 66: Rest of Europe Oil and Gas Industry in Australia Volume (K Tons) Forecast, by Application 2019 & 2032
- Table 67: Global Oil and Gas Industry in Australia Revenue Million Forecast, by Upstream 2019 & 2032
- Table 68: Global Oil and Gas Industry in Australia Volume K Tons Forecast, by Upstream 2019 & 2032
- Table 69: Global Oil and Gas Industry in Australia Revenue Million Forecast, by Midstream 2019 & 2032
- Table 70: Global Oil and Gas Industry in Australia Volume K Tons Forecast, by Midstream 2019 & 2032
- Table 71: Global Oil and Gas Industry in Australia Revenue Million Forecast, by Downstream 2019 & 2032
- Table 72: Global Oil and Gas Industry in Australia Volume K Tons Forecast, by Downstream 2019 & 2032
- Table 73: Global Oil and Gas Industry in Australia Revenue Million Forecast, by Country 2019 & 2032
- Table 74: Global Oil and Gas Industry in Australia Volume K Tons Forecast, by Country 2019 & 2032
- Table 75: Turkey Oil and Gas Industry in Australia Revenue (Million) Forecast, by Application 2019 & 2032
- Table 76: Turkey Oil and Gas Industry in Australia Volume (K Tons) Forecast, by Application 2019 & 2032
- Table 77: Israel Oil and Gas Industry in Australia Revenue (Million) Forecast, by Application 2019 & 2032
- Table 78: Israel Oil and Gas Industry in Australia Volume (K Tons) Forecast, by Application 2019 & 2032
- Table 79: GCC Oil and Gas Industry in Australia Revenue (Million) Forecast, by Application 2019 & 2032
- Table 80: GCC Oil and Gas Industry in Australia Volume (K Tons) Forecast, by Application 2019 & 2032
- Table 81: North Africa Oil and Gas Industry in Australia Revenue (Million) Forecast, by Application 2019 & 2032
- Table 82: North Africa Oil and Gas Industry in Australia Volume (K Tons) Forecast, by Application 2019 & 2032
- Table 83: South Africa Oil and Gas Industry in Australia Revenue (Million) Forecast, by Application 2019 & 2032
- Table 84: South Africa Oil and Gas Industry in Australia Volume (K Tons) Forecast, by Application 2019 & 2032
- Table 85: Rest of Middle East & Africa Oil and Gas Industry in Australia Revenue (Million) Forecast, by Application 2019 & 2032
- Table 86: Rest of Middle East & Africa Oil and Gas Industry in Australia Volume (K Tons) Forecast, by Application 2019 & 2032
- Table 87: Global Oil and Gas Industry in Australia Revenue Million Forecast, by Upstream 2019 & 2032
- Table 88: Global Oil and Gas Industry in Australia Volume K Tons Forecast, by Upstream 2019 & 2032
- Table 89: Global Oil and Gas Industry in Australia Revenue Million Forecast, by Midstream 2019 & 2032
- Table 90: Global Oil and Gas Industry in Australia Volume K Tons Forecast, by Midstream 2019 & 2032
- Table 91: Global Oil and Gas Industry in Australia Revenue Million Forecast, by Downstream 2019 & 2032
- Table 92: Global Oil and Gas Industry in Australia Volume K Tons Forecast, by Downstream 2019 & 2032
- Table 93: Global Oil and Gas Industry in Australia Revenue Million Forecast, by Country 2019 & 2032
- Table 94: Global Oil and Gas Industry in Australia Volume K Tons Forecast, by Country 2019 & 2032
- Table 95: China Oil and Gas Industry in Australia Revenue (Million) Forecast, by Application 2019 & 2032
- Table 96: China Oil and Gas Industry in Australia Volume (K Tons) Forecast, by Application 2019 & 2032
- Table 97: India Oil and Gas Industry in Australia Revenue (Million) Forecast, by Application 2019 & 2032
- Table 98: India Oil and Gas Industry in Australia Volume (K Tons) Forecast, by Application 2019 & 2032
- Table 99: Japan Oil and Gas Industry in Australia Revenue (Million) Forecast, by Application 2019 & 2032
- Table 100: Japan Oil and Gas Industry in Australia Volume (K Tons) Forecast, by Application 2019 & 2032
- Table 101: South Korea Oil and Gas Industry in Australia Revenue (Million) Forecast, by Application 2019 & 2032
- Table 102: South Korea Oil and Gas Industry in Australia Volume (K Tons) Forecast, by Application 2019 & 2032
- Table 103: ASEAN Oil and Gas Industry in Australia Revenue (Million) Forecast, by Application 2019 & 2032
- Table 104: ASEAN Oil and Gas Industry in Australia Volume (K Tons) Forecast, by Application 2019 & 2032
- Table 105: Oceania Oil and Gas Industry in Australia Revenue (Million) Forecast, by Application 2019 & 2032
- Table 106: Oceania Oil and Gas Industry in Australia Volume (K Tons) Forecast, by Application 2019 & 2032
- Table 107: Rest of Asia Pacific Oil and Gas Industry in Australia Revenue (Million) Forecast, by Application 2019 & 2032
- Table 108: Rest of Asia Pacific Oil and Gas Industry in Australia Volume (K Tons) Forecast, by Application 2019 & 2032
Frequently Asked Questions
1. What is the projected Compound Annual Growth Rate (CAGR) of the Oil and Gas Industry in Australia?
The projected CAGR is approximately -4.19%.
2. Which companies are prominent players in the Oil and Gas Industry in Australia?
Key companies in the market include Woodside Petroleum Limited, Shell PLC, ExxonMobil Corporation, BHP Group PLC*List Not Exhaustive, Chevron Corporation, TotalEnergies SE, BP PLC.
3. What are the main segments of the Oil and Gas Industry in Australia?
The market segments include Upstream, Midstream, Downstream.
4. Can you provide details about the market size?
The market size is estimated to be USD XX Million as of 2022.
5. What are some drivers contributing to market growth?
4.; Increasing Natural Gas Demand4.; Rising Pipeline Network and Associated Infrastructure Development.
6. What are the notable trends driving market growth?
Midstream Segment Expected to Witness Significant Demand.
7. Are there any restraints impacting market growth?
4.; Rising Shift toward Renewable Energy.
8. Can you provide examples of recent developments in the market?
September 2022: Santos Ltd. sanctioned a USD 300 million pipeline project that would create an additional connection to its Darwin liquefied natural gas facility in Northern Australia.
9. What pricing options are available for accessing the report?
Pricing options include single-user, multi-user, and enterprise licenses priced at USD 3800, USD 4500, and USD 5800 respectively.
10. Is the market size provided in terms of value or volume?
The market size is provided in terms of value, measured in Million and volume, measured in K Tons.
11. Are there any specific market keywords associated with the report?
Yes, the market keyword associated with the report is "Oil and Gas Industry in Australia," which aids in identifying and referencing the specific market segment covered.
12. How do I determine which pricing option suits my needs best?
The pricing options vary based on user requirements and access needs. Individual users may opt for single-user licenses, while businesses requiring broader access may choose multi-user or enterprise licenses for cost-effective access to the report.
13. Are there any additional resources or data provided in the Oil and Gas Industry in Australia report?
While the report offers comprehensive insights, it's advisable to review the specific contents or supplementary materials provided to ascertain if additional resources or data are available.
14. How can I stay updated on further developments or reports in the Oil and Gas Industry in Australia?
To stay informed about further developments, trends, and reports in the Oil and Gas Industry in Australia, consider subscribing to industry newsletters, following relevant companies and organizations, or regularly checking reputable industry news sources and publications.
Methodology
Step 1 - Identification of Relevant Samples Size from Population Database


Step 2 - Approaches for Defining Global Market Size (Value, Volume* & Price*)

Note*: In applicable scenarios
Step 3 - Data Sources
Primary Research
- Web Analytics
- Survey Reports
- Research Institute
- Latest Research Reports
- Opinion Leaders
Secondary Research
- Annual Reports
- White Paper
- Latest Press Release
- Industry Association
- Paid Database
- Investor Presentations

Step 4 - Data Triangulation
Involves using different sources of information in order to increase the validity of a study
These sources are likely to be stakeholders in a program - participants, other researchers, program staff, other community members, and so on.
Then we put all data in single framework & apply various statistical tools to find out the dynamic on the market.
During the analysis stage, feedback from the stakeholder groups would be compared to determine areas of agreement as well as areas of divergence


