
Key Insights
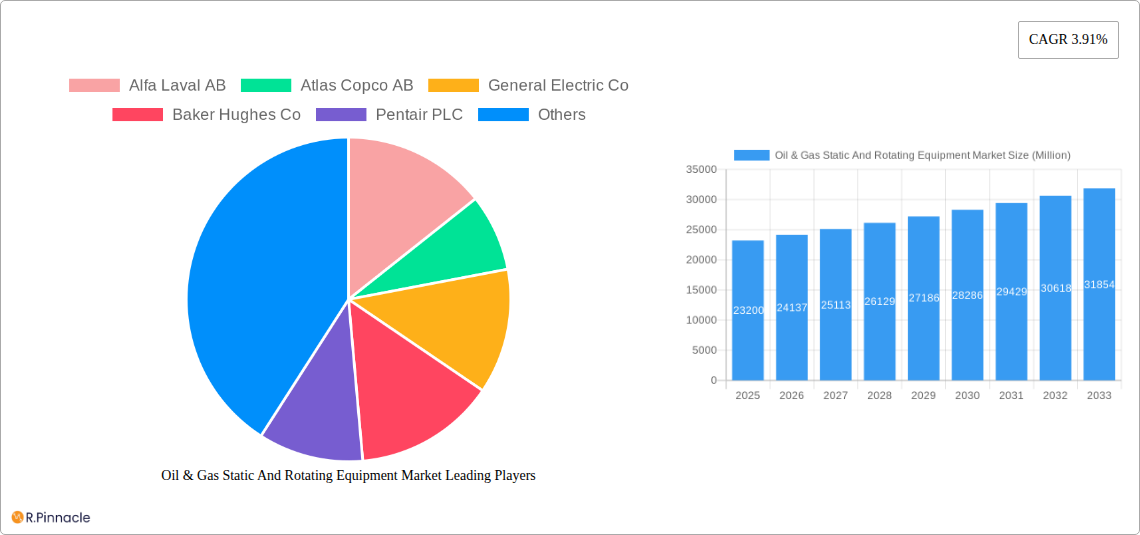
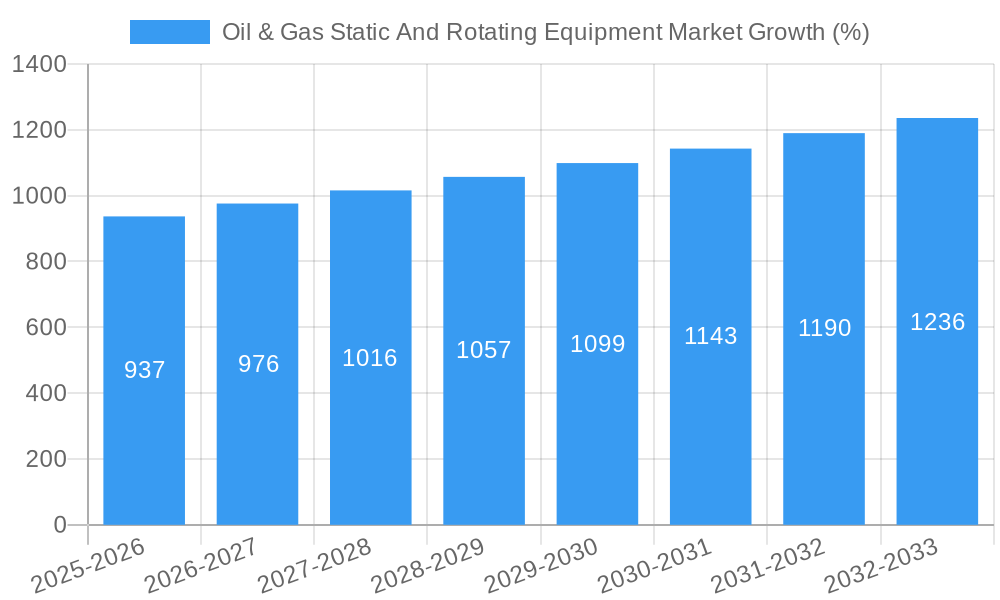
The Oil & Gas Static and Rotating Equipment market, valued at $23.20 billion in 2025, is projected to experience steady growth, driven by increasing global energy demand and ongoing investments in oil and gas exploration and production. A Compound Annual Growth Rate (CAGR) of 3.91% from 2025 to 2033 indicates a substantial market expansion over the forecast period. Key drivers include the rising need for efficient equipment upgrades in existing infrastructure, the exploration of new oil and gas reserves in challenging environments (requiring advanced equipment), and the increasing adoption of digitalization and automation technologies to enhance operational efficiency and reduce downtime. The market's growth is further fueled by stringent government regulations focusing on emissions reduction, prompting the adoption of cleaner and more efficient equipment. However, fluctuating oil and gas prices, along with geopolitical uncertainties, pose significant restraints to market expansion. The market is segmented by equipment type (pumps, compressors, valves, turbines, etc.), application (upstream, midstream, downstream), and region. Leading players like Alfa Laval AB, Atlas Copco AB, General Electric Co, and Baker Hughes Co are actively involved in technological advancements and strategic partnerships to maintain their market share amidst growing competition.
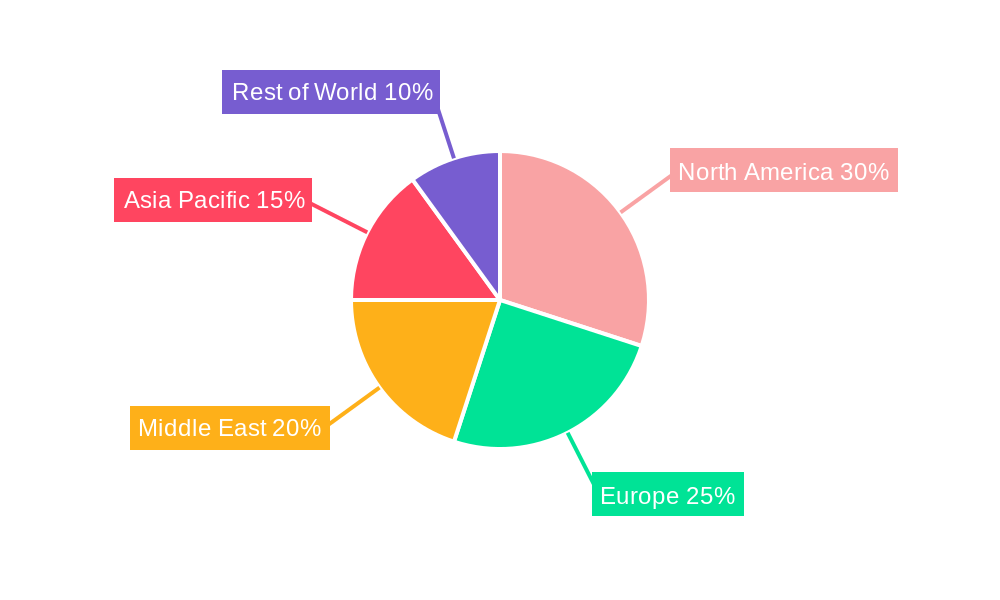
The competitive landscape is characterized by both established industry giants and emerging technology providers. Companies are focusing on developing innovative solutions, such as advanced materials and smart sensors, to improve equipment performance, reliability, and longevity. The market is witnessing a gradual shift towards sustainable practices, with manufacturers emphasizing energy-efficient and environmentally friendly equipment. Furthermore, the increasing adoption of predictive maintenance techniques, utilizing data analytics and IoT capabilities, will play a crucial role in optimizing operational efficiency and reducing maintenance costs throughout the forecast period. Regional growth will vary depending on factors like exploration and production activities and the rate of infrastructure development in each area. North America and the Middle East are expected to be key contributors to the overall market growth due to substantial investments in their oil and gas sectors.
Oil & Gas Static and Rotating Equipment Market Report: 2019-2033
This comprehensive report provides an in-depth analysis of the Oil & Gas Static and Rotating Equipment market, offering invaluable insights for industry professionals, investors, and strategic decision-makers. Covering the period from 2019 to 2033 (Base Year: 2025, Forecast Period: 2025-2033), this report meticulously examines market dynamics, technological advancements, and competitive landscapes, presenting a robust forecast for future growth. The report value is xx Million.
Oil & Gas Static And Rotating Equipment Market Market Structure & Innovation Trends
This section analyzes the market structure, highlighting key trends shaping the industry. We examine market concentration, identifying dominant players and their respective market shares. The report quantifies the impact of M&A activities, providing insights into deal values and their influence on market dynamics. Furthermore, we delve into the regulatory landscape, examining its impact on innovation and product development. Substitute products and their market penetration are also assessed. Finally, end-user demographics and their evolving needs are analyzed to provide a comprehensive understanding of the market landscape.
- Market Concentration: Analysis includes xx% market share for top 5 players. (Specific market share data for each leading company will be included in the full report).
- M&A Activities: The report details significant mergers and acquisitions, including deal values (e.g., xx Million for a specific deal mentioned in the report) and their impact on market consolidation.
- Innovation Drivers: Technological advancements, such as the development of more efficient and durable equipment, are analyzed as drivers of market growth.
- Regulatory Frameworks: The influence of government regulations on safety standards and environmental protection is thoroughly examined.
- Product Substitutes: This section assesses the threat posed by substitute products, including their market share and potential impact on the industry.
- End-User Demographics: The report analyses the evolving needs and preferences of different end-user segments within the oil and gas industry.
Oil & Gas Static And Rotating Equipment Market Market Dynamics & Trends
This section explores the key dynamics driving market growth, including technological disruptions, consumer preferences, and competitive dynamics. We present a detailed analysis of market growth drivers, projecting a Compound Annual Growth Rate (CAGR) of xx% during the forecast period. Market penetration rates for key product segments will be detailed, providing a clear picture of market evolution.
Dominant Regions & Segments in Oil & Gas Static And Rotating Equipment Market
This section identifies the leading regions and segments within the Oil & Gas Static and Rotating Equipment market. A detailed analysis of market dominance across different geographical regions will be provided, including leading countries. Key drivers for regional growth will be highlighted using bullet points, focusing on economic policies, infrastructure development, and industry-specific factors.
- Leading Region: [Name of leading region will be inserted here] – Detailed analysis including factors driving its dominance.
- Key Drivers:
- Economic Policies: [Specific policies impacting growth will be detailed here]
- Infrastructure: [Infrastructure details driving regional dominance will be detailed here]
- [Other factors specific to the dominant region will be included]
Oil & Gas Static And Rotating Equipment Market Product Innovations
This section summarizes recent product developments, highlighting their applications and competitive advantages. We will examine technological trends driving innovation and discuss the market fit of new products.
Report Scope & Segmentation Analysis
This report segments the market across various parameters. [Detailed segmentations with their growth projections, market sizes, and competitive dynamics will be included. Examples include segmentation by equipment type, application, and geography.]
Key Drivers of Oil & Gas Static And Rotating Equipment Market Growth
This section outlines the key factors driving the growth of the Oil & Gas Static and Rotating Equipment market. We focus on technological advancements, economic factors (e.g., increasing oil and gas production), and regulatory changes. Specific examples illustrating these drivers will be provided.
Challenges in the Oil & Gas Static And Rotating Equipment Market Sector
This section identifies and quantifies the challenges hindering market growth. We will examine regulatory hurdles, supply chain disruptions, and competitive pressures. The impact of these factors on market expansion will be assessed.
Emerging Opportunities in Oil & Gas Static And Rotating Equipment Market
This section highlights emerging opportunities for market expansion. We focus on new markets, technological advancements, and evolving consumer preferences, with specific examples.
Leading Players in the Oil & Gas Static And Rotating Equipment Market Market
- Alfa Laval AB
- Atlas Copco AB
- General Electric Co
- Baker Hughes Co
- Pentair PLC
- Siemens AG
- Sulzer Limited
- FMC Technologies Inc
- Flowserve Corporation
- Mitsubishi Heavy Industries Ltd
- Doosan Group
- [List of other prominent companies will be provided]
Market ranking analysis will be included in this section.
Key Developments in Oil & Gas Static And Rotating Equipment Market Industry
- January 2023: Baker Hughes supplied forged duplex stainless steel valves to the Mero-3 FPSO in Brazil. These API-6A compliant valves are capable of withstanding pressures up to 15,000 psi, showcasing advancements in valve technology.
- August 2023: Vitherm received an order for a C276 heat exchanger from a major US oil and gas company. This highlights the demand for compact, efficient heat exchangers in the industry.
Future Outlook for Oil & Gas Static And Rotating Equipment Market Market
This section summarizes the growth accelerators and strategic opportunities expected to shape the future of the Oil & Gas Static and Rotating Equipment market. The forecast period will be detailed and discussed. The potential for market expansion and strategic partnerships will be highlighted.
Oil & Gas Static And Rotating Equipment Market Segmentation
-
1. Application
- 1.1. Upstream
- 1.2. Midstream
- 1.3. Downstream
-
2. Type
- 2.1. Static
- 2.2. Rotating
Oil & Gas Static And Rotating Equipment Market Segmentation By Geography
-
1. North America
- 1.1. United States
- 1.2. Canada
- 1.3. Rest of North America
-
2. Europe
- 2.1. Germany
- 2.2. France
- 2.3. United Kingdom
- 2.4. Spain
- 2.5. Russia
- 2.6. NORDIC
- 2.7. Italy
- 2.8. Rest of Europe
-
3. Asia Pacific
- 3.1. China
- 3.2. India
- 3.3. Australia
- 3.4. Japan
- 3.5. Malaysia
- 3.6. Thailand
- 3.7. Indonesia
- 3.8. Vietnam
- 3.9. Rest of Asia Pacific
-
4. Middle East and Africa
- 4.1. Saudi Arabia
- 4.2. United Arab Emirates
- 4.3. Egypt
- 4.4. Qatar
- 4.5. Nigeria
- 4.6. South Africa
- 4.7. Rest of Middle East and Africa
-
5. South America
- 5.1. Brazil
- 5.2. Argentina
- 5.3. Colombia
- 5.4. Rest of South America
Oil & Gas Static And Rotating Equipment Market REPORT HIGHLIGHTS
| Aspects | Details |
|---|---|
| Study Period | 2019-2033 |
| Base Year | 2024 |
| Estimated Year | 2025 |
| Forecast Period | 2025-2033 |
| Historical Period | 2019-2024 |
| Growth Rate | CAGR of 3.91% from 2019-2033 |
| Segmentation |
|
Table of Contents
- 1. Introduction
- 1.1. Research Scope
- 1.2. Market Segmentation
- 1.3. Research Methodology
- 1.4. Definitions and Assumptions
- 2. Executive Summary
- 2.1. Introduction
- 3. Market Dynamics
- 3.1. Introduction
- 3.2. Market Drivers
- 3.2.1. 4.; Increasing Energy Demand4.; More Offshore Exploration Activities
- 3.3. Market Restrains
- 3.3.1. 4.; Increasing Energy Demand4.; More Offshore Exploration Activities
- 3.4. Market Trends
- 3.4.1. The Rotating Equipment Segment is Expected to Have a Significant Demand
- 4. Market Factor Analysis
- 4.1. Porters Five Forces
- 4.2. Supply/Value Chain
- 4.3. PESTEL analysis
- 4.4. Market Entropy
- 4.5. Patent/Trademark Analysis
- 5. Global Oil & Gas Static And Rotating Equipment Market Analysis, Insights and Forecast, 2019-2031
- 5.1. Market Analysis, Insights and Forecast - by Application
- 5.1.1. Upstream
- 5.1.2. Midstream
- 5.1.3. Downstream
- 5.2. Market Analysis, Insights and Forecast - by Type
- 5.2.1. Static
- 5.2.2. Rotating
- 5.3. Market Analysis, Insights and Forecast - by Region
- 5.3.1. North America
- 5.3.2. Europe
- 5.3.3. Asia Pacific
- 5.3.4. Middle East and Africa
- 5.3.5. South America
- 5.1. Market Analysis, Insights and Forecast - by Application
- 6. North America Oil & Gas Static And Rotating Equipment Market Analysis, Insights and Forecast, 2019-2031
- 6.1. Market Analysis, Insights and Forecast - by Application
- 6.1.1. Upstream
- 6.1.2. Midstream
- 6.1.3. Downstream
- 6.2. Market Analysis, Insights and Forecast - by Type
- 6.2.1. Static
- 6.2.2. Rotating
- 6.1. Market Analysis, Insights and Forecast - by Application
- 7. Europe Oil & Gas Static And Rotating Equipment Market Analysis, Insights and Forecast, 2019-2031
- 7.1. Market Analysis, Insights and Forecast - by Application
- 7.1.1. Upstream
- 7.1.2. Midstream
- 7.1.3. Downstream
- 7.2. Market Analysis, Insights and Forecast - by Type
- 7.2.1. Static
- 7.2.2. Rotating
- 7.1. Market Analysis, Insights and Forecast - by Application
- 8. Asia Pacific Oil & Gas Static And Rotating Equipment Market Analysis, Insights and Forecast, 2019-2031
- 8.1. Market Analysis, Insights and Forecast - by Application
- 8.1.1. Upstream
- 8.1.2. Midstream
- 8.1.3. Downstream
- 8.2. Market Analysis, Insights and Forecast - by Type
- 8.2.1. Static
- 8.2.2. Rotating
- 8.1. Market Analysis, Insights and Forecast - by Application
- 9. Middle East and Africa Oil & Gas Static And Rotating Equipment Market Analysis, Insights and Forecast, 2019-2031
- 9.1. Market Analysis, Insights and Forecast - by Application
- 9.1.1. Upstream
- 9.1.2. Midstream
- 9.1.3. Downstream
- 9.2. Market Analysis, Insights and Forecast - by Type
- 9.2.1. Static
- 9.2.2. Rotating
- 9.1. Market Analysis, Insights and Forecast - by Application
- 10. South America Oil & Gas Static And Rotating Equipment Market Analysis, Insights and Forecast, 2019-2031
- 10.1. Market Analysis, Insights and Forecast - by Application
- 10.1.1. Upstream
- 10.1.2. Midstream
- 10.1.3. Downstream
- 10.2. Market Analysis, Insights and Forecast - by Type
- 10.2.1. Static
- 10.2.2. Rotating
- 10.1. Market Analysis, Insights and Forecast - by Application
- 11. Competitive Analysis
- 11.1. Global Market Share Analysis 2024
- 11.2. Company Profiles
- 11.2.1 Alfa Laval AB
- 11.2.1.1. Overview
- 11.2.1.2. Products
- 11.2.1.3. SWOT Analysis
- 11.2.1.4. Recent Developments
- 11.2.1.5. Financials (Based on Availability)
- 11.2.2 Atlas Copco AB
- 11.2.2.1. Overview
- 11.2.2.2. Products
- 11.2.2.3. SWOT Analysis
- 11.2.2.4. Recent Developments
- 11.2.2.5. Financials (Based on Availability)
- 11.2.3 General Electric Co
- 11.2.3.1. Overview
- 11.2.3.2. Products
- 11.2.3.3. SWOT Analysis
- 11.2.3.4. Recent Developments
- 11.2.3.5. Financials (Based on Availability)
- 11.2.4 Baker Hughes Co
- 11.2.4.1. Overview
- 11.2.4.2. Products
- 11.2.4.3. SWOT Analysis
- 11.2.4.4. Recent Developments
- 11.2.4.5. Financials (Based on Availability)
- 11.2.5 Pentair PLC
- 11.2.5.1. Overview
- 11.2.5.2. Products
- 11.2.5.3. SWOT Analysis
- 11.2.5.4. Recent Developments
- 11.2.5.5. Financials (Based on Availability)
- 11.2.6 Siemens AG
- 11.2.6.1. Overview
- 11.2.6.2. Products
- 11.2.6.3. SWOT Analysis
- 11.2.6.4. Recent Developments
- 11.2.6.5. Financials (Based on Availability)
- 11.2.7 Sulzer Limited
- 11.2.7.1. Overview
- 11.2.7.2. Products
- 11.2.7.3. SWOT Analysis
- 11.2.7.4. Recent Developments
- 11.2.7.5. Financials (Based on Availability)
- 11.2.8 FMC Technologies Inc
- 11.2.8.1. Overview
- 11.2.8.2. Products
- 11.2.8.3. SWOT Analysis
- 11.2.8.4. Recent Developments
- 11.2.8.5. Financials (Based on Availability)
- 11.2.9 Flowserve Corporation
- 11.2.9.1. Overview
- 11.2.9.2. Products
- 11.2.9.3. SWOT Analysis
- 11.2.9.4. Recent Developments
- 11.2.9.5. Financials (Based on Availability)
- 11.2.10 Mitsubishi heavy Industries Ltd
- 11.2.10.1. Overview
- 11.2.10.2. Products
- 11.2.10.3. SWOT Analysis
- 11.2.10.4. Recent Developments
- 11.2.10.5. Financials (Based on Availability)
- 11.2.11 Doosan Group*List Not Exhaustive 6 4 List of Other Prominent Companies6 5 Market RankingAnalysi
- 11.2.11.1. Overview
- 11.2.11.2. Products
- 11.2.11.3. SWOT Analysis
- 11.2.11.4. Recent Developments
- 11.2.11.5. Financials (Based on Availability)
- 11.2.1 Alfa Laval AB
List of Figures
- Figure 1: Global Oil & Gas Static And Rotating Equipment Market Revenue Breakdown (Million, %) by Region 2024 & 2032
- Figure 2: Global Oil & Gas Static And Rotating Equipment Market Volume Breakdown (Billion, %) by Region 2024 & 2032
- Figure 3: North America Oil & Gas Static And Rotating Equipment Market Revenue (Million), by Application 2024 & 2032
- Figure 4: North America Oil & Gas Static And Rotating Equipment Market Volume (Billion), by Application 2024 & 2032
- Figure 5: North America Oil & Gas Static And Rotating Equipment Market Revenue Share (%), by Application 2024 & 2032
- Figure 6: North America Oil & Gas Static And Rotating Equipment Market Volume Share (%), by Application 2024 & 2032
- Figure 7: North America Oil & Gas Static And Rotating Equipment Market Revenue (Million), by Type 2024 & 2032
- Figure 8: North America Oil & Gas Static And Rotating Equipment Market Volume (Billion), by Type 2024 & 2032
- Figure 9: North America Oil & Gas Static And Rotating Equipment Market Revenue Share (%), by Type 2024 & 2032
- Figure 10: North America Oil & Gas Static And Rotating Equipment Market Volume Share (%), by Type 2024 & 2032
- Figure 11: North America Oil & Gas Static And Rotating Equipment Market Revenue (Million), by Country 2024 & 2032
- Figure 12: North America Oil & Gas Static And Rotating Equipment Market Volume (Billion), by Country 2024 & 2032
- Figure 13: North America Oil & Gas Static And Rotating Equipment Market Revenue Share (%), by Country 2024 & 2032
- Figure 14: North America Oil & Gas Static And Rotating Equipment Market Volume Share (%), by Country 2024 & 2032
- Figure 15: Europe Oil & Gas Static And Rotating Equipment Market Revenue (Million), by Application 2024 & 2032
- Figure 16: Europe Oil & Gas Static And Rotating Equipment Market Volume (Billion), by Application 2024 & 2032
- Figure 17: Europe Oil & Gas Static And Rotating Equipment Market Revenue Share (%), by Application 2024 & 2032
- Figure 18: Europe Oil & Gas Static And Rotating Equipment Market Volume Share (%), by Application 2024 & 2032
- Figure 19: Europe Oil & Gas Static And Rotating Equipment Market Revenue (Million), by Type 2024 & 2032
- Figure 20: Europe Oil & Gas Static And Rotating Equipment Market Volume (Billion), by Type 2024 & 2032
- Figure 21: Europe Oil & Gas Static And Rotating Equipment Market Revenue Share (%), by Type 2024 & 2032
- Figure 22: Europe Oil & Gas Static And Rotating Equipment Market Volume Share (%), by Type 2024 & 2032
- Figure 23: Europe Oil & Gas Static And Rotating Equipment Market Revenue (Million), by Country 2024 & 2032
- Figure 24: Europe Oil & Gas Static And Rotating Equipment Market Volume (Billion), by Country 2024 & 2032
- Figure 25: Europe Oil & Gas Static And Rotating Equipment Market Revenue Share (%), by Country 2024 & 2032
- Figure 26: Europe Oil & Gas Static And Rotating Equipment Market Volume Share (%), by Country 2024 & 2032
- Figure 27: Asia Pacific Oil & Gas Static And Rotating Equipment Market Revenue (Million), by Application 2024 & 2032
- Figure 28: Asia Pacific Oil & Gas Static And Rotating Equipment Market Volume (Billion), by Application 2024 & 2032
- Figure 29: Asia Pacific Oil & Gas Static And Rotating Equipment Market Revenue Share (%), by Application 2024 & 2032
- Figure 30: Asia Pacific Oil & Gas Static And Rotating Equipment Market Volume Share (%), by Application 2024 & 2032
- Figure 31: Asia Pacific Oil & Gas Static And Rotating Equipment Market Revenue (Million), by Type 2024 & 2032
- Figure 32: Asia Pacific Oil & Gas Static And Rotating Equipment Market Volume (Billion), by Type 2024 & 2032
- Figure 33: Asia Pacific Oil & Gas Static And Rotating Equipment Market Revenue Share (%), by Type 2024 & 2032
- Figure 34: Asia Pacific Oil & Gas Static And Rotating Equipment Market Volume Share (%), by Type 2024 & 2032
- Figure 35: Asia Pacific Oil & Gas Static And Rotating Equipment Market Revenue (Million), by Country 2024 & 2032
- Figure 36: Asia Pacific Oil & Gas Static And Rotating Equipment Market Volume (Billion), by Country 2024 & 2032
- Figure 37: Asia Pacific Oil & Gas Static And Rotating Equipment Market Revenue Share (%), by Country 2024 & 2032
- Figure 38: Asia Pacific Oil & Gas Static And Rotating Equipment Market Volume Share (%), by Country 2024 & 2032
- Figure 39: Middle East and Africa Oil & Gas Static And Rotating Equipment Market Revenue (Million), by Application 2024 & 2032
- Figure 40: Middle East and Africa Oil & Gas Static And Rotating Equipment Market Volume (Billion), by Application 2024 & 2032
- Figure 41: Middle East and Africa Oil & Gas Static And Rotating Equipment Market Revenue Share (%), by Application 2024 & 2032
- Figure 42: Middle East and Africa Oil & Gas Static And Rotating Equipment Market Volume Share (%), by Application 2024 & 2032
- Figure 43: Middle East and Africa Oil & Gas Static And Rotating Equipment Market Revenue (Million), by Type 2024 & 2032
- Figure 44: Middle East and Africa Oil & Gas Static And Rotating Equipment Market Volume (Billion), by Type 2024 & 2032
- Figure 45: Middle East and Africa Oil & Gas Static And Rotating Equipment Market Revenue Share (%), by Type 2024 & 2032
- Figure 46: Middle East and Africa Oil & Gas Static And Rotating Equipment Market Volume Share (%), by Type 2024 & 2032
- Figure 47: Middle East and Africa Oil & Gas Static And Rotating Equipment Market Revenue (Million), by Country 2024 & 2032
- Figure 48: Middle East and Africa Oil & Gas Static And Rotating Equipment Market Volume (Billion), by Country 2024 & 2032
- Figure 49: Middle East and Africa Oil & Gas Static And Rotating Equipment Market Revenue Share (%), by Country 2024 & 2032
- Figure 50: Middle East and Africa Oil & Gas Static And Rotating Equipment Market Volume Share (%), by Country 2024 & 2032
- Figure 51: South America Oil & Gas Static And Rotating Equipment Market Revenue (Million), by Application 2024 & 2032
- Figure 52: South America Oil & Gas Static And Rotating Equipment Market Volume (Billion), by Application 2024 & 2032
- Figure 53: South America Oil & Gas Static And Rotating Equipment Market Revenue Share (%), by Application 2024 & 2032
- Figure 54: South America Oil & Gas Static And Rotating Equipment Market Volume Share (%), by Application 2024 & 2032
- Figure 55: South America Oil & Gas Static And Rotating Equipment Market Revenue (Million), by Type 2024 & 2032
- Figure 56: South America Oil & Gas Static And Rotating Equipment Market Volume (Billion), by Type 2024 & 2032
- Figure 57: South America Oil & Gas Static And Rotating Equipment Market Revenue Share (%), by Type 2024 & 2032
- Figure 58: South America Oil & Gas Static And Rotating Equipment Market Volume Share (%), by Type 2024 & 2032
- Figure 59: South America Oil & Gas Static And Rotating Equipment Market Revenue (Million), by Country 2024 & 2032
- Figure 60: South America Oil & Gas Static And Rotating Equipment Market Volume (Billion), by Country 2024 & 2032
- Figure 61: South America Oil & Gas Static And Rotating Equipment Market Revenue Share (%), by Country 2024 & 2032
- Figure 62: South America Oil & Gas Static And Rotating Equipment Market Volume Share (%), by Country 2024 & 2032
List of Tables
- Table 1: Global Oil & Gas Static And Rotating Equipment Market Revenue Million Forecast, by Region 2019 & 2032
- Table 2: Global Oil & Gas Static And Rotating Equipment Market Volume Billion Forecast, by Region 2019 & 2032
- Table 3: Global Oil & Gas Static And Rotating Equipment Market Revenue Million Forecast, by Application 2019 & 2032
- Table 4: Global Oil & Gas Static And Rotating Equipment Market Volume Billion Forecast, by Application 2019 & 2032
- Table 5: Global Oil & Gas Static And Rotating Equipment Market Revenue Million Forecast, by Type 2019 & 2032
- Table 6: Global Oil & Gas Static And Rotating Equipment Market Volume Billion Forecast, by Type 2019 & 2032
- Table 7: Global Oil & Gas Static And Rotating Equipment Market Revenue Million Forecast, by Region 2019 & 2032
- Table 8: Global Oil & Gas Static And Rotating Equipment Market Volume Billion Forecast, by Region 2019 & 2032
- Table 9: Global Oil & Gas Static And Rotating Equipment Market Revenue Million Forecast, by Application 2019 & 2032
- Table 10: Global Oil & Gas Static And Rotating Equipment Market Volume Billion Forecast, by Application 2019 & 2032
- Table 11: Global Oil & Gas Static And Rotating Equipment Market Revenue Million Forecast, by Type 2019 & 2032
- Table 12: Global Oil & Gas Static And Rotating Equipment Market Volume Billion Forecast, by Type 2019 & 2032
- Table 13: Global Oil & Gas Static And Rotating Equipment Market Revenue Million Forecast, by Country 2019 & 2032
- Table 14: Global Oil & Gas Static And Rotating Equipment Market Volume Billion Forecast, by Country 2019 & 2032
- Table 15: United States Oil & Gas Static And Rotating Equipment Market Revenue (Million) Forecast, by Application 2019 & 2032
- Table 16: United States Oil & Gas Static And Rotating Equipment Market Volume (Billion) Forecast, by Application 2019 & 2032
- Table 17: Canada Oil & Gas Static And Rotating Equipment Market Revenue (Million) Forecast, by Application 2019 & 2032
- Table 18: Canada Oil & Gas Static And Rotating Equipment Market Volume (Billion) Forecast, by Application 2019 & 2032
- Table 19: Rest of North America Oil & Gas Static And Rotating Equipment Market Revenue (Million) Forecast, by Application 2019 & 2032
- Table 20: Rest of North America Oil & Gas Static And Rotating Equipment Market Volume (Billion) Forecast, by Application 2019 & 2032
- Table 21: Global Oil & Gas Static And Rotating Equipment Market Revenue Million Forecast, by Application 2019 & 2032
- Table 22: Global Oil & Gas Static And Rotating Equipment Market Volume Billion Forecast, by Application 2019 & 2032
- Table 23: Global Oil & Gas Static And Rotating Equipment Market Revenue Million Forecast, by Type 2019 & 2032
- Table 24: Global Oil & Gas Static And Rotating Equipment Market Volume Billion Forecast, by Type 2019 & 2032
- Table 25: Global Oil & Gas Static And Rotating Equipment Market Revenue Million Forecast, by Country 2019 & 2032
- Table 26: Global Oil & Gas Static And Rotating Equipment Market Volume Billion Forecast, by Country 2019 & 2032
- Table 27: Germany Oil & Gas Static And Rotating Equipment Market Revenue (Million) Forecast, by Application 2019 & 2032
- Table 28: Germany Oil & Gas Static And Rotating Equipment Market Volume (Billion) Forecast, by Application 2019 & 2032
- Table 29: France Oil & Gas Static And Rotating Equipment Market Revenue (Million) Forecast, by Application 2019 & 2032
- Table 30: France Oil & Gas Static And Rotating Equipment Market Volume (Billion) Forecast, by Application 2019 & 2032
- Table 31: United Kingdom Oil & Gas Static And Rotating Equipment Market Revenue (Million) Forecast, by Application 2019 & 2032
- Table 32: United Kingdom Oil & Gas Static And Rotating Equipment Market Volume (Billion) Forecast, by Application 2019 & 2032
- Table 33: Spain Oil & Gas Static And Rotating Equipment Market Revenue (Million) Forecast, by Application 2019 & 2032
- Table 34: Spain Oil & Gas Static And Rotating Equipment Market Volume (Billion) Forecast, by Application 2019 & 2032
- Table 35: Russia Oil & Gas Static And Rotating Equipment Market Revenue (Million) Forecast, by Application 2019 & 2032
- Table 36: Russia Oil & Gas Static And Rotating Equipment Market Volume (Billion) Forecast, by Application 2019 & 2032
- Table 37: NORDIC Oil & Gas Static And Rotating Equipment Market Revenue (Million) Forecast, by Application 2019 & 2032
- Table 38: NORDIC Oil & Gas Static And Rotating Equipment Market Volume (Billion) Forecast, by Application 2019 & 2032
- Table 39: Italy Oil & Gas Static And Rotating Equipment Market Revenue (Million) Forecast, by Application 2019 & 2032
- Table 40: Italy Oil & Gas Static And Rotating Equipment Market Volume (Billion) Forecast, by Application 2019 & 2032
- Table 41: Rest of Europe Oil & Gas Static And Rotating Equipment Market Revenue (Million) Forecast, by Application 2019 & 2032
- Table 42: Rest of Europe Oil & Gas Static And Rotating Equipment Market Volume (Billion) Forecast, by Application 2019 & 2032
- Table 43: Global Oil & Gas Static And Rotating Equipment Market Revenue Million Forecast, by Application 2019 & 2032
- Table 44: Global Oil & Gas Static And Rotating Equipment Market Volume Billion Forecast, by Application 2019 & 2032
- Table 45: Global Oil & Gas Static And Rotating Equipment Market Revenue Million Forecast, by Type 2019 & 2032
- Table 46: Global Oil & Gas Static And Rotating Equipment Market Volume Billion Forecast, by Type 2019 & 2032
- Table 47: Global Oil & Gas Static And Rotating Equipment Market Revenue Million Forecast, by Country 2019 & 2032
- Table 48: Global Oil & Gas Static And Rotating Equipment Market Volume Billion Forecast, by Country 2019 & 2032
- Table 49: China Oil & Gas Static And Rotating Equipment Market Revenue (Million) Forecast, by Application 2019 & 2032
- Table 50: China Oil & Gas Static And Rotating Equipment Market Volume (Billion) Forecast, by Application 2019 & 2032
- Table 51: India Oil & Gas Static And Rotating Equipment Market Revenue (Million) Forecast, by Application 2019 & 2032
- Table 52: India Oil & Gas Static And Rotating Equipment Market Volume (Billion) Forecast, by Application 2019 & 2032
- Table 53: Australia Oil & Gas Static And Rotating Equipment Market Revenue (Million) Forecast, by Application 2019 & 2032
- Table 54: Australia Oil & Gas Static And Rotating Equipment Market Volume (Billion) Forecast, by Application 2019 & 2032
- Table 55: Japan Oil & Gas Static And Rotating Equipment Market Revenue (Million) Forecast, by Application 2019 & 2032
- Table 56: Japan Oil & Gas Static And Rotating Equipment Market Volume (Billion) Forecast, by Application 2019 & 2032
- Table 57: Malaysia Oil & Gas Static And Rotating Equipment Market Revenue (Million) Forecast, by Application 2019 & 2032
- Table 58: Malaysia Oil & Gas Static And Rotating Equipment Market Volume (Billion) Forecast, by Application 2019 & 2032
- Table 59: Thailand Oil & Gas Static And Rotating Equipment Market Revenue (Million) Forecast, by Application 2019 & 2032
- Table 60: Thailand Oil & Gas Static And Rotating Equipment Market Volume (Billion) Forecast, by Application 2019 & 2032
- Table 61: Indonesia Oil & Gas Static And Rotating Equipment Market Revenue (Million) Forecast, by Application 2019 & 2032
- Table 62: Indonesia Oil & Gas Static And Rotating Equipment Market Volume (Billion) Forecast, by Application 2019 & 2032
- Table 63: Vietnam Oil & Gas Static And Rotating Equipment Market Revenue (Million) Forecast, by Application 2019 & 2032
- Table 64: Vietnam Oil & Gas Static And Rotating Equipment Market Volume (Billion) Forecast, by Application 2019 & 2032
- Table 65: Rest of Asia Pacific Oil & Gas Static And Rotating Equipment Market Revenue (Million) Forecast, by Application 2019 & 2032
- Table 66: Rest of Asia Pacific Oil & Gas Static And Rotating Equipment Market Volume (Billion) Forecast, by Application 2019 & 2032
- Table 67: Global Oil & Gas Static And Rotating Equipment Market Revenue Million Forecast, by Application 2019 & 2032
- Table 68: Global Oil & Gas Static And Rotating Equipment Market Volume Billion Forecast, by Application 2019 & 2032
- Table 69: Global Oil & Gas Static And Rotating Equipment Market Revenue Million Forecast, by Type 2019 & 2032
- Table 70: Global Oil & Gas Static And Rotating Equipment Market Volume Billion Forecast, by Type 2019 & 2032
- Table 71: Global Oil & Gas Static And Rotating Equipment Market Revenue Million Forecast, by Country 2019 & 2032
- Table 72: Global Oil & Gas Static And Rotating Equipment Market Volume Billion Forecast, by Country 2019 & 2032
- Table 73: Saudi Arabia Oil & Gas Static And Rotating Equipment Market Revenue (Million) Forecast, by Application 2019 & 2032
- Table 74: Saudi Arabia Oil & Gas Static And Rotating Equipment Market Volume (Billion) Forecast, by Application 2019 & 2032
- Table 75: United Arab Emirates Oil & Gas Static And Rotating Equipment Market Revenue (Million) Forecast, by Application 2019 & 2032
- Table 76: United Arab Emirates Oil & Gas Static And Rotating Equipment Market Volume (Billion) Forecast, by Application 2019 & 2032
- Table 77: Egypt Oil & Gas Static And Rotating Equipment Market Revenue (Million) Forecast, by Application 2019 & 2032
- Table 78: Egypt Oil & Gas Static And Rotating Equipment Market Volume (Billion) Forecast, by Application 2019 & 2032
- Table 79: Qatar Oil & Gas Static And Rotating Equipment Market Revenue (Million) Forecast, by Application 2019 & 2032
- Table 80: Qatar Oil & Gas Static And Rotating Equipment Market Volume (Billion) Forecast, by Application 2019 & 2032
- Table 81: Nigeria Oil & Gas Static And Rotating Equipment Market Revenue (Million) Forecast, by Application 2019 & 2032
- Table 82: Nigeria Oil & Gas Static And Rotating Equipment Market Volume (Billion) Forecast, by Application 2019 & 2032
- Table 83: South Africa Oil & Gas Static And Rotating Equipment Market Revenue (Million) Forecast, by Application 2019 & 2032
- Table 84: South Africa Oil & Gas Static And Rotating Equipment Market Volume (Billion) Forecast, by Application 2019 & 2032
- Table 85: Rest of Middle East and Africa Oil & Gas Static And Rotating Equipment Market Revenue (Million) Forecast, by Application 2019 & 2032
- Table 86: Rest of Middle East and Africa Oil & Gas Static And Rotating Equipment Market Volume (Billion) Forecast, by Application 2019 & 2032
- Table 87: Global Oil & Gas Static And Rotating Equipment Market Revenue Million Forecast, by Application 2019 & 2032
- Table 88: Global Oil & Gas Static And Rotating Equipment Market Volume Billion Forecast, by Application 2019 & 2032
- Table 89: Global Oil & Gas Static And Rotating Equipment Market Revenue Million Forecast, by Type 2019 & 2032
- Table 90: Global Oil & Gas Static And Rotating Equipment Market Volume Billion Forecast, by Type 2019 & 2032
- Table 91: Global Oil & Gas Static And Rotating Equipment Market Revenue Million Forecast, by Country 2019 & 2032
- Table 92: Global Oil & Gas Static And Rotating Equipment Market Volume Billion Forecast, by Country 2019 & 2032
- Table 93: Brazil Oil & Gas Static And Rotating Equipment Market Revenue (Million) Forecast, by Application 2019 & 2032
- Table 94: Brazil Oil & Gas Static And Rotating Equipment Market Volume (Billion) Forecast, by Application 2019 & 2032
- Table 95: Argentina Oil & Gas Static And Rotating Equipment Market Revenue (Million) Forecast, by Application 2019 & 2032
- Table 96: Argentina Oil & Gas Static And Rotating Equipment Market Volume (Billion) Forecast, by Application 2019 & 2032
- Table 97: Colombia Oil & Gas Static And Rotating Equipment Market Revenue (Million) Forecast, by Application 2019 & 2032
- Table 98: Colombia Oil & Gas Static And Rotating Equipment Market Volume (Billion) Forecast, by Application 2019 & 2032
- Table 99: Rest of South America Oil & Gas Static And Rotating Equipment Market Revenue (Million) Forecast, by Application 2019 & 2032
- Table 100: Rest of South America Oil & Gas Static And Rotating Equipment Market Volume (Billion) Forecast, by Application 2019 & 2032
Frequently Asked Questions
1. What is the projected Compound Annual Growth Rate (CAGR) of the Oil & Gas Static And Rotating Equipment Market?
The projected CAGR is approximately 3.91%.
2. Which companies are prominent players in the Oil & Gas Static And Rotating Equipment Market?
Key companies in the market include Alfa Laval AB, Atlas Copco AB, General Electric Co, Baker Hughes Co, Pentair PLC, Siemens AG, Sulzer Limited, FMC Technologies Inc, Flowserve Corporation, Mitsubishi heavy Industries Ltd, Doosan Group*List Not Exhaustive 6 4 List of Other Prominent Companies6 5 Market RankingAnalysi.
3. What are the main segments of the Oil & Gas Static And Rotating Equipment Market?
The market segments include Application, Type.
4. Can you provide details about the market size?
The market size is estimated to be USD 23.20 Million as of 2022.
5. What are some drivers contributing to market growth?
4.; Increasing Energy Demand4.; More Offshore Exploration Activities.
6. What are the notable trends driving market growth?
The Rotating Equipment Segment is Expected to Have a Significant Demand.
7. Are there any restraints impacting market growth?
4.; Increasing Energy Demand4.; More Offshore Exploration Activities.
8. Can you provide examples of recent developments in the market?
January 2023: Baker Hughes provided forged duplex stainless steel valves to Mero-3 FPSO in Brazil. The supply equipment is API-6A compliant and capable of working pressures up to 15,000 psi. The company provided these valves after they were designed, manufactured, and tested with successful first-pass yield.August 2023: Vitherm got an order from a renowned oil and gas company in the United States for the supply of a C276 heat exchanger. The company's heat exchangers are compact, highly efficient, and provide good heat transfer capabilities while minimizing the required footprint.
9. What pricing options are available for accessing the report?
Pricing options include single-user, multi-user, and enterprise licenses priced at USD 4750, USD 5250, and USD 8750 respectively.
10. Is the market size provided in terms of value or volume?
The market size is provided in terms of value, measured in Million and volume, measured in Billion.
11. Are there any specific market keywords associated with the report?
Yes, the market keyword associated with the report is "Oil & Gas Static And Rotating Equipment Market," which aids in identifying and referencing the specific market segment covered.
12. How do I determine which pricing option suits my needs best?
The pricing options vary based on user requirements and access needs. Individual users may opt for single-user licenses, while businesses requiring broader access may choose multi-user or enterprise licenses for cost-effective access to the report.
13. Are there any additional resources or data provided in the Oil & Gas Static And Rotating Equipment Market report?
While the report offers comprehensive insights, it's advisable to review the specific contents or supplementary materials provided to ascertain if additional resources or data are available.
14. How can I stay updated on further developments or reports in the Oil & Gas Static And Rotating Equipment Market?
To stay informed about further developments, trends, and reports in the Oil & Gas Static And Rotating Equipment Market, consider subscribing to industry newsletters, following relevant companies and organizations, or regularly checking reputable industry news sources and publications.
Methodology
Step 1 - Identification of Relevant Samples Size from Population Database


Step 2 - Approaches for Defining Global Market Size (Value, Volume* & Price*)

Note*: In applicable scenarios
Step 3 - Data Sources
Primary Research
- Web Analytics
- Survey Reports
- Research Institute
- Latest Research Reports
- Opinion Leaders
Secondary Research
- Annual Reports
- White Paper
- Latest Press Release
- Industry Association
- Paid Database
- Investor Presentations

Step 4 - Data Triangulation
Involves using different sources of information in order to increase the validity of a study
These sources are likely to be stakeholders in a program - participants, other researchers, program staff, other community members, and so on.
Then we put all data in single framework & apply various statistical tools to find out the dynamic on the market.
During the analysis stage, feedback from the stakeholder groups would be compared to determine areas of agreement as well as areas of divergence


