
Key Insights
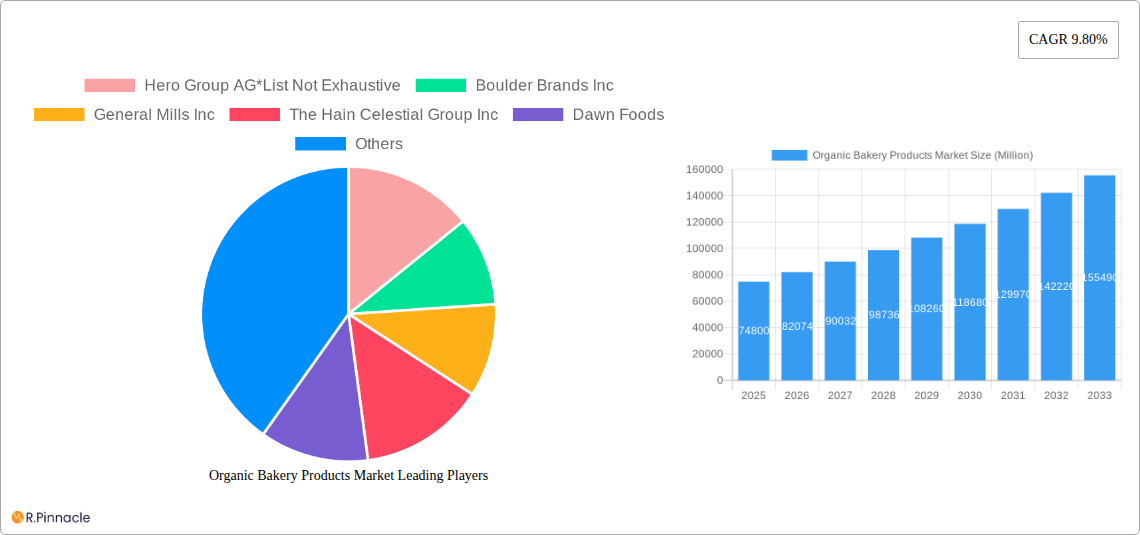
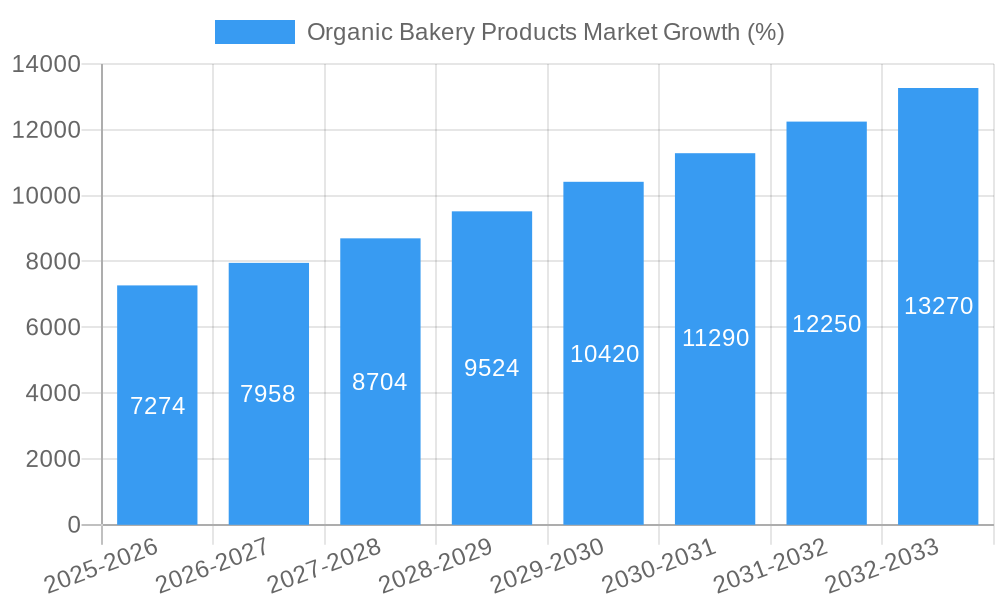
The global organic bakery products market, valued at $74.8 billion in 2025, is projected to experience robust growth, driven by increasing consumer awareness of health and wellness, a rising preference for natural and minimally processed foods, and the growing popularity of vegan and gluten-free diets. The market's Compound Annual Growth Rate (CAGR) of 9.8% from 2025 to 2033 indicates a significant expansion, with substantial opportunities across various product segments and distribution channels. Bread remains a dominant product type, followed by biscuits, cakes, and pastries, reflecting established consumer preferences. However, the demand for innovative organic bakery products, such as gluten-free options and those catering to specific dietary needs, is fueling significant growth within the "Other Product Types" segment. Supermarkets and hypermarkets currently hold the largest market share in terms of distribution, but online channels are rapidly gaining traction, driven by e-commerce expansion and convenience. Key players like Hero Group AG, General Mills Inc., and The Hain Celestial Group Inc. are actively shaping the market landscape through product innovation and strategic partnerships. Regional variations exist, with North America and Europe currently leading the market, but the Asia-Pacific region is anticipated to experience significant growth in the coming years due to increasing disposable incomes and changing dietary habits. Growth restraints include higher production costs associated with organic ingredients and potential price sensitivity among some consumer segments.
The market's future growth is expected to be significantly influenced by factors such as government initiatives promoting sustainable and healthy food choices, technological advancements in organic baking processes, and the expanding availability of organic ingredients. The increasing availability of specialized organic bakeries and dedicated online platforms is also expected to boost market growth. Furthermore, the development of new product lines focusing on specific dietary requirements, such as low-sugar, high-fiber, and allergen-free options, will play a crucial role in shaping the market trajectory. Competitive landscape analysis reveals that larger players are consolidating their market positions through acquisitions and product diversification, while smaller, specialized players are thriving by catering to niche demands and emphasizing sustainable practices. Future market analysis should consider the evolving consumer preferences, economic fluctuations, and regulatory changes impacting the organic food industry to gain a more comprehensive understanding of the market's dynamic nature.
Organic Bakery Products Market: A Comprehensive Report (2019-2033)
This in-depth report provides a comprehensive analysis of the Organic Bakery Products Market, offering valuable insights for industry professionals, investors, and stakeholders. With a study period spanning 2019-2033, a base year of 2025, and a forecast period of 2025-2033, this report delivers actionable intelligence for strategic decision-making. The market is segmented by product type (Bread, Biscuits, Cakes and Pastries, Other Product Types) and distribution channel (Supermarkets/Hypermarkets, Convenience Stores, Specialist Stores, Online Channels, Other Distribution Channels). The report projects a market size of xx Million in 2025 and a CAGR of xx% during the forecast period.
Organic Bakery Products Market Structure & Innovation Trends
The organic bakery products market exhibits a moderately consolidated structure, with key players such as Hero Group AG, Boulder Brands Inc, General Mills Inc, The Hain Celestial Group Inc, and Dawn Foods holding significant market share. However, the presence of numerous smaller, specialized organic bakeries indicates a dynamic competitive landscape. Market share data for 2024 reveals that the top five players collectively account for approximately xx% of the market. Innovation is driven by consumer demand for healthier, more sustainable options, leading to the development of gluten-free, vegan, and other specialized products. Regulatory frameworks, including labeling regulations and organic certification standards, significantly influence market dynamics. Product substitutes, such as conventional bakery products and other snack foods, exert competitive pressure. The market witnesses frequent M&A activities, with deal values averaging xx Million in recent years. Examples include (but are not limited to) strategic acquisitions aimed at expanding product portfolios and market reach. End-user demographics are predominantly health-conscious consumers with higher disposable incomes, concentrated in developed economies.
Organic Bakery Products Market Market Dynamics & Trends
The organic bakery products market is experiencing robust growth, propelled by several key factors. The increasing awareness of health and wellness among consumers is a primary driver, fueling the demand for organic and healthier alternatives to conventional baked goods. Rising disposable incomes, especially in developing economies, further contribute to market expansion. Technological advancements in production processes, such as automation and improved ingredient sourcing, enhance efficiency and product quality. Consumer preferences are shifting towards convenient, on-the-go options, driving growth in the ready-to-eat and frozen segments. Competitive dynamics are characterized by product differentiation, innovation, and branding strategies. The market penetration of organic bakery products varies significantly across regions, with developed markets exhibiting higher penetration rates compared to emerging economies. The CAGR for the forecast period is estimated at xx%, reflecting the positive market outlook.
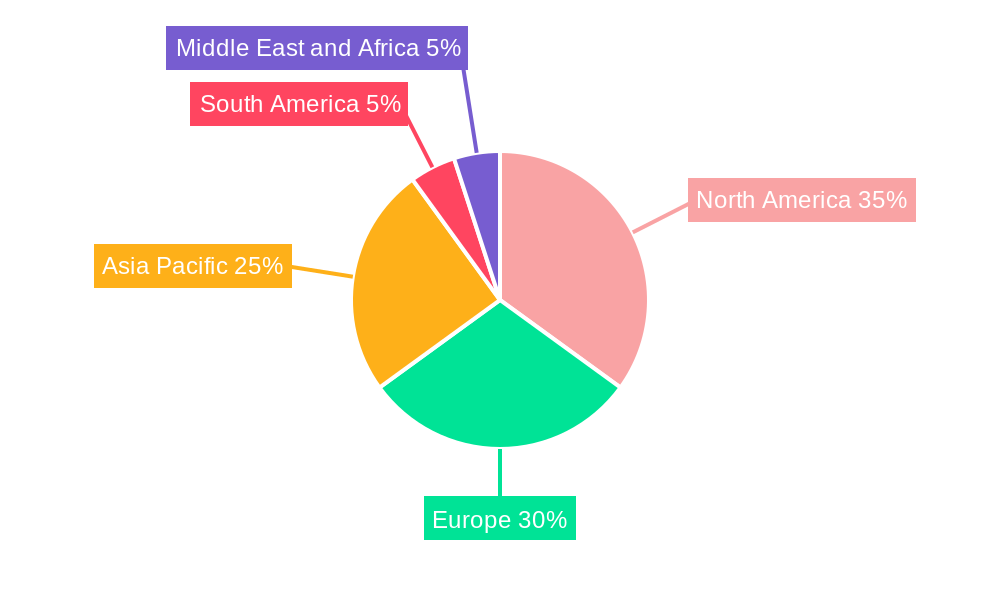
Dominant Regions & Segments in Organic Bakery Products Market
The North American region currently dominates the organic bakery products market, driven by factors such as high consumer awareness of health and wellness, strong regulatory support for organic products, and well-established distribution networks. Within North America, the United States holds the largest market share.
Key Drivers in North America:
- Strong consumer demand for organic and healthy food options.
- Well-developed retail infrastructure supporting organic product distribution.
- Favorable regulatory environment promoting organic agriculture and food production.
Product Type: Bread holds the largest market share among product types, followed by cakes and pastries. The demand for gluten-free and other specialized bread varieties is notably strong.
Distribution Channel: Supermarkets/Hypermarkets represent the dominant distribution channel, providing wide accessibility to organic bakery products. Online channels are also growing rapidly, driven by increasing e-commerce penetration.
The European market exhibits significant growth potential, driven by increasing health consciousness and a strong preference for organic products. Other regions, such as Asia-Pacific, are also witnessing increasing demand, although at a slower pace compared to North America and Europe.
Organic Bakery Products Market Product Innovations
Recent product innovations focus on addressing consumer demand for healthier, more convenient, and sustainable options. Gluten-free, vegan, and low-sugar products are gaining popularity. Technological advancements are leading to improved production processes, resulting in enhanced product quality, shelf life, and sustainability. The development of innovative packaging solutions, such as recyclable and compostable materials, is also gaining traction. These innovations are crucial for maintaining a competitive advantage in the increasingly crowded market.
Report Scope & Segmentation Analysis
This report segments the organic bakery products market based on product type and distribution channel.
Product Type: Bread, Biscuits, Cakes and Pastries, Other Product Types. Each segment's growth projection and market size are analyzed, considering its specific competitive dynamics.
Distribution Channel: Supermarkets/Hypermarkets, Convenience Stores, Specialist Stores, Online Channels, Other Distribution Channels. The analysis covers the market size, growth potential, and competitive landscape for each distribution channel.
Key Drivers of Organic Bakery Products Market Growth
The organic bakery products market is driven by several key factors, including rising consumer awareness of health and wellness, increasing demand for healthier food options, growing disposable incomes in developing economies, and the expanding availability of organic ingredients. Government regulations and initiatives promoting organic farming and food production further bolster the market. Technological advancements, such as automation and improved production techniques, are enhancing efficiency and reducing costs.
Challenges in the Organic Bakery Products Market Sector
Challenges in the organic bakery products market include the higher production costs associated with organic ingredients, the stringent regulatory requirements for organic certification, potential supply chain disruptions impacting ingredient availability, and intense competition from both established and emerging players. Fluctuations in raw material prices also present significant challenges.
Emerging Opportunities in Organic Bakery Products Market
Emerging opportunities lie in expanding into new markets, particularly in developing economies with a growing middle class. The development of innovative products catering to specific dietary needs, such as allergen-free or functional foods, presents significant growth potential. Leveraging e-commerce platforms and direct-to-consumer sales strategies can further expand market reach and improve customer engagement.
Leading Players in the Organic Bakery Products Market Market
- Hero Group AG
- Boulder Brands Inc
- General Mills Inc
- The Hain Celestial Group Inc
- Dawn Foods
- Enjoy Life Natural Brands LLC
- Amy's Kitchen Inc
- Dr Schar AG/SpA
- Bob's Red Mill
- Kraft Heinz Company
Key Developments in Organic Bakery Products Market Industry
October 2021: Dr. Schär partnered with Niederwieser Spa to launch sustainable, certified circular plastic packaging for gluten-free bread, highlighting a commitment to environmental sustainability.
June 2021: Dawn Foods launched frozen indulgent gluten-free sweet bakery products, expanding its product portfolio and catering to growing consumer demand.
April 2021: Bob's Red Mill introduced a new line of oat crackers, capitalizing on the growing popularity of plant-based and gluten-free snacks.
Future Outlook for Organic Bakery Products Market Market
The organic bakery products market is poised for continued growth, driven by sustained consumer demand for healthier and more sustainable food options. Strategic investments in research and development, product innovation, and sustainable supply chains will be crucial for maintaining a competitive edge. Expansion into new markets and leveraging e-commerce channels will further contribute to market growth and expansion.
Organic Bakery Products Market Segmentation
-
1. Product Type
- 1.1. Bread
- 1.2. Biscuits
- 1.3. Cakes and Pastries
- 1.4. Other Product Types
-
2. Distribution Channel
- 2.1. Supermarkets/Hypermarkets
- 2.2. Convenience Stores
- 2.3. Specialist Stores
- 2.4. Online Channels
- 2.5. Other Distribution Channels
Organic Bakery Products Market Segmentation By Geography
-
1. North America
- 1.1. United States
- 1.2. Canada
- 1.3. Mexico
- 1.4. Rest of North America
-
2. Europe
- 2.1. United Kingdom
- 2.2. Germany
- 2.3. France
- 2.4. Russia
- 2.5. Italy
- 2.6. Spain
- 2.7. Rest of Europe
-
3. Asia Pacific
- 3.1. India
- 3.2. China
- 3.3. Japan
- 3.4. Australia
- 3.5. Rest of Asia Pacific
-
4. South America
- 4.1. Brazil
- 4.2. Argentina
- 4.3. Rest of South America
-
5. Middle East and Africa
- 5.1. South Africa
- 5.2. United Arab Emirates
- 5.3. Rest of Middle East and Africa
Organic Bakery Products Market REPORT HIGHLIGHTS
| Aspects | Details |
|---|---|
| Study Period | 2019-2033 |
| Base Year | 2024 |
| Estimated Year | 2025 |
| Forecast Period | 2025-2033 |
| Historical Period | 2019-2024 |
| Growth Rate | CAGR of 9.80% from 2019-2033 |
| Segmentation |
|
Table of Contents
- 1. Introduction
- 1.1. Research Scope
- 1.2. Market Segmentation
- 1.3. Research Methodology
- 1.4. Definitions and Assumptions
- 2. Executive Summary
- 2.1. Introduction
- 3. Market Dynamics
- 3.1. Introduction
- 3.2. Market Drivers
- 3.2.1. Growing Demand for Nutricosmetics Among Millennials; Growing Beauty and Wellness Trend
- 3.3. Market Restrains
- 3.3.1. Stringent Government Regulations and Product Guidelines
- 3.4. Market Trends
- 3.4.1. Rising demand for Clean-label and Organic Gluten Free Bakery Products
- 4. Market Factor Analysis
- 4.1. Porters Five Forces
- 4.2. Supply/Value Chain
- 4.3. PESTEL analysis
- 4.4. Market Entropy
- 4.5. Patent/Trademark Analysis
- 5. Global Organic Bakery Products Market Analysis, Insights and Forecast, 2019-2031
- 5.1. Market Analysis, Insights and Forecast - by Product Type
- 5.1.1. Bread
- 5.1.2. Biscuits
- 5.1.3. Cakes and Pastries
- 5.1.4. Other Product Types
- 5.2. Market Analysis, Insights and Forecast - by Distribution Channel
- 5.2.1. Supermarkets/Hypermarkets
- 5.2.2. Convenience Stores
- 5.2.3. Specialist Stores
- 5.2.4. Online Channels
- 5.2.5. Other Distribution Channels
- 5.3. Market Analysis, Insights and Forecast - by Region
- 5.3.1. North America
- 5.3.2. Europe
- 5.3.3. Asia Pacific
- 5.3.4. South America
- 5.3.5. Middle East and Africa
- 5.1. Market Analysis, Insights and Forecast - by Product Type
- 6. North America Organic Bakery Products Market Analysis, Insights and Forecast, 2019-2031
- 6.1. Market Analysis, Insights and Forecast - by Product Type
- 6.1.1. Bread
- 6.1.2. Biscuits
- 6.1.3. Cakes and Pastries
- 6.1.4. Other Product Types
- 6.2. Market Analysis, Insights and Forecast - by Distribution Channel
- 6.2.1. Supermarkets/Hypermarkets
- 6.2.2. Convenience Stores
- 6.2.3. Specialist Stores
- 6.2.4. Online Channels
- 6.2.5. Other Distribution Channels
- 6.1. Market Analysis, Insights and Forecast - by Product Type
- 7. Europe Organic Bakery Products Market Analysis, Insights and Forecast, 2019-2031
- 7.1. Market Analysis, Insights and Forecast - by Product Type
- 7.1.1. Bread
- 7.1.2. Biscuits
- 7.1.3. Cakes and Pastries
- 7.1.4. Other Product Types
- 7.2. Market Analysis, Insights and Forecast - by Distribution Channel
- 7.2.1. Supermarkets/Hypermarkets
- 7.2.2. Convenience Stores
- 7.2.3. Specialist Stores
- 7.2.4. Online Channels
- 7.2.5. Other Distribution Channels
- 7.1. Market Analysis, Insights and Forecast - by Product Type
- 8. Asia Pacific Organic Bakery Products Market Analysis, Insights and Forecast, 2019-2031
- 8.1. Market Analysis, Insights and Forecast - by Product Type
- 8.1.1. Bread
- 8.1.2. Biscuits
- 8.1.3. Cakes and Pastries
- 8.1.4. Other Product Types
- 8.2. Market Analysis, Insights and Forecast - by Distribution Channel
- 8.2.1. Supermarkets/Hypermarkets
- 8.2.2. Convenience Stores
- 8.2.3. Specialist Stores
- 8.2.4. Online Channels
- 8.2.5. Other Distribution Channels
- 8.1. Market Analysis, Insights and Forecast - by Product Type
- 9. South America Organic Bakery Products Market Analysis, Insights and Forecast, 2019-2031
- 9.1. Market Analysis, Insights and Forecast - by Product Type
- 9.1.1. Bread
- 9.1.2. Biscuits
- 9.1.3. Cakes and Pastries
- 9.1.4. Other Product Types
- 9.2. Market Analysis, Insights and Forecast - by Distribution Channel
- 9.2.1. Supermarkets/Hypermarkets
- 9.2.2. Convenience Stores
- 9.2.3. Specialist Stores
- 9.2.4. Online Channels
- 9.2.5. Other Distribution Channels
- 9.1. Market Analysis, Insights and Forecast - by Product Type
- 10. Middle East and Africa Organic Bakery Products Market Analysis, Insights and Forecast, 2019-2031
- 10.1. Market Analysis, Insights and Forecast - by Product Type
- 10.1.1. Bread
- 10.1.2. Biscuits
- 10.1.3. Cakes and Pastries
- 10.1.4. Other Product Types
- 10.2. Market Analysis, Insights and Forecast - by Distribution Channel
- 10.2.1. Supermarkets/Hypermarkets
- 10.2.2. Convenience Stores
- 10.2.3. Specialist Stores
- 10.2.4. Online Channels
- 10.2.5. Other Distribution Channels
- 10.1. Market Analysis, Insights and Forecast - by Product Type
- 11. North America Organic Bakery Products Market Analysis, Insights and Forecast, 2019-2031
- 11.1. Market Analysis, Insights and Forecast - By Country/Sub-region
- 11.1.1 United States
- 11.1.2 Canada
- 11.1.3 Mexico
- 11.1.4 Rest of North America
- 12. Europe Organic Bakery Products Market Analysis, Insights and Forecast, 2019-2031
- 12.1. Market Analysis, Insights and Forecast - By Country/Sub-region
- 12.1.1 United Kingdom
- 12.1.2 Germany
- 12.1.3 France
- 12.1.4 Russia
- 12.1.5 Italy
- 12.1.6 Spain
- 12.1.7 Rest of Europe
- 13. Asia Pacific Organic Bakery Products Market Analysis, Insights and Forecast, 2019-2031
- 13.1. Market Analysis, Insights and Forecast - By Country/Sub-region
- 13.1.1 India
- 13.1.2 China
- 13.1.3 Japan
- 13.1.4 Australia
- 13.1.5 Rest of Asia Pacific
- 14. South America Organic Bakery Products Market Analysis, Insights and Forecast, 2019-2031
- 14.1. Market Analysis, Insights and Forecast - By Country/Sub-region
- 14.1.1 Brazil
- 14.1.2 Argentina
- 14.1.3 Rest of South America
- 15. Middle East and Africa Organic Bakery Products Market Analysis, Insights and Forecast, 2019-2031
- 15.1. Market Analysis, Insights and Forecast - By Country/Sub-region
- 15.1.1 South Africa
- 15.1.2 United Arab Emirates
- 15.1.3 Rest of Middle East and Africa
- 16. Competitive Analysis
- 16.1. Global Market Share Analysis 2024
- 16.2. Company Profiles
- 16.2.1 Hero Group AG*List Not Exhaustive
- 16.2.1.1. Overview
- 16.2.1.2. Products
- 16.2.1.3. SWOT Analysis
- 16.2.1.4. Recent Developments
- 16.2.1.5. Financials (Based on Availability)
- 16.2.2 Boulder Brands Inc
- 16.2.2.1. Overview
- 16.2.2.2. Products
- 16.2.2.3. SWOT Analysis
- 16.2.2.4. Recent Developments
- 16.2.2.5. Financials (Based on Availability)
- 16.2.3 General Mills Inc
- 16.2.3.1. Overview
- 16.2.3.2. Products
- 16.2.3.3. SWOT Analysis
- 16.2.3.4. Recent Developments
- 16.2.3.5. Financials (Based on Availability)
- 16.2.4 The Hain Celestial Group Inc
- 16.2.4.1. Overview
- 16.2.4.2. Products
- 16.2.4.3. SWOT Analysis
- 16.2.4.4. Recent Developments
- 16.2.4.5. Financials (Based on Availability)
- 16.2.5 Dawn Foods
- 16.2.5.1. Overview
- 16.2.5.2. Products
- 16.2.5.3. SWOT Analysis
- 16.2.5.4. Recent Developments
- 16.2.5.5. Financials (Based on Availability)
- 16.2.6 Enjoy Life Natural Brands LLC
- 16.2.6.1. Overview
- 16.2.6.2. Products
- 16.2.6.3. SWOT Analysis
- 16.2.6.4. Recent Developments
- 16.2.6.5. Financials (Based on Availability)
- 16.2.7 Amy's Kitchen Inc
- 16.2.7.1. Overview
- 16.2.7.2. Products
- 16.2.7.3. SWOT Analysis
- 16.2.7.4. Recent Developments
- 16.2.7.5. Financials (Based on Availability)
- 16.2.8 Dr Schar AG/SpA
- 16.2.8.1. Overview
- 16.2.8.2. Products
- 16.2.8.3. SWOT Analysis
- 16.2.8.4. Recent Developments
- 16.2.8.5. Financials (Based on Availability)
- 16.2.9 Bobs Red Mill
- 16.2.9.1. Overview
- 16.2.9.2. Products
- 16.2.9.3. SWOT Analysis
- 16.2.9.4. Recent Developments
- 16.2.9.5. Financials (Based on Availability)
- 16.2.10 Kraft Heinz Company
- 16.2.10.1. Overview
- 16.2.10.2. Products
- 16.2.10.3. SWOT Analysis
- 16.2.10.4. Recent Developments
- 16.2.10.5. Financials (Based on Availability)
- 16.2.1 Hero Group AG*List Not Exhaustive
List of Figures
- Figure 1: Global Organic Bakery Products Market Revenue Breakdown (Million, %) by Region 2024 & 2032
- Figure 2: Global Organic Bakery Products Market Volume Breakdown (k Tons, %) by Region 2024 & 2032
- Figure 3: North America Organic Bakery Products Market Revenue (Million), by Country 2024 & 2032
- Figure 4: North America Organic Bakery Products Market Volume (k Tons), by Country 2024 & 2032
- Figure 5: North America Organic Bakery Products Market Revenue Share (%), by Country 2024 & 2032
- Figure 6: North America Organic Bakery Products Market Volume Share (%), by Country 2024 & 2032
- Figure 7: Europe Organic Bakery Products Market Revenue (Million), by Country 2024 & 2032
- Figure 8: Europe Organic Bakery Products Market Volume (k Tons), by Country 2024 & 2032
- Figure 9: Europe Organic Bakery Products Market Revenue Share (%), by Country 2024 & 2032
- Figure 10: Europe Organic Bakery Products Market Volume Share (%), by Country 2024 & 2032
- Figure 11: Asia Pacific Organic Bakery Products Market Revenue (Million), by Country 2024 & 2032
- Figure 12: Asia Pacific Organic Bakery Products Market Volume (k Tons), by Country 2024 & 2032
- Figure 13: Asia Pacific Organic Bakery Products Market Revenue Share (%), by Country 2024 & 2032
- Figure 14: Asia Pacific Organic Bakery Products Market Volume Share (%), by Country 2024 & 2032
- Figure 15: South America Organic Bakery Products Market Revenue (Million), by Country 2024 & 2032
- Figure 16: South America Organic Bakery Products Market Volume (k Tons), by Country 2024 & 2032
- Figure 17: South America Organic Bakery Products Market Revenue Share (%), by Country 2024 & 2032
- Figure 18: South America Organic Bakery Products Market Volume Share (%), by Country 2024 & 2032
- Figure 19: Middle East and Africa Organic Bakery Products Market Revenue (Million), by Country 2024 & 2032
- Figure 20: Middle East and Africa Organic Bakery Products Market Volume (k Tons), by Country 2024 & 2032
- Figure 21: Middle East and Africa Organic Bakery Products Market Revenue Share (%), by Country 2024 & 2032
- Figure 22: Middle East and Africa Organic Bakery Products Market Volume Share (%), by Country 2024 & 2032
- Figure 23: North America Organic Bakery Products Market Revenue (Million), by Product Type 2024 & 2032
- Figure 24: North America Organic Bakery Products Market Volume (k Tons), by Product Type 2024 & 2032
- Figure 25: North America Organic Bakery Products Market Revenue Share (%), by Product Type 2024 & 2032
- Figure 26: North America Organic Bakery Products Market Volume Share (%), by Product Type 2024 & 2032
- Figure 27: North America Organic Bakery Products Market Revenue (Million), by Distribution Channel 2024 & 2032
- Figure 28: North America Organic Bakery Products Market Volume (k Tons), by Distribution Channel 2024 & 2032
- Figure 29: North America Organic Bakery Products Market Revenue Share (%), by Distribution Channel 2024 & 2032
- Figure 30: North America Organic Bakery Products Market Volume Share (%), by Distribution Channel 2024 & 2032
- Figure 31: North America Organic Bakery Products Market Revenue (Million), by Country 2024 & 2032
- Figure 32: North America Organic Bakery Products Market Volume (k Tons), by Country 2024 & 2032
- Figure 33: North America Organic Bakery Products Market Revenue Share (%), by Country 2024 & 2032
- Figure 34: North America Organic Bakery Products Market Volume Share (%), by Country 2024 & 2032
- Figure 35: Europe Organic Bakery Products Market Revenue (Million), by Product Type 2024 & 2032
- Figure 36: Europe Organic Bakery Products Market Volume (k Tons), by Product Type 2024 & 2032
- Figure 37: Europe Organic Bakery Products Market Revenue Share (%), by Product Type 2024 & 2032
- Figure 38: Europe Organic Bakery Products Market Volume Share (%), by Product Type 2024 & 2032
- Figure 39: Europe Organic Bakery Products Market Revenue (Million), by Distribution Channel 2024 & 2032
- Figure 40: Europe Organic Bakery Products Market Volume (k Tons), by Distribution Channel 2024 & 2032
- Figure 41: Europe Organic Bakery Products Market Revenue Share (%), by Distribution Channel 2024 & 2032
- Figure 42: Europe Organic Bakery Products Market Volume Share (%), by Distribution Channel 2024 & 2032
- Figure 43: Europe Organic Bakery Products Market Revenue (Million), by Country 2024 & 2032
- Figure 44: Europe Organic Bakery Products Market Volume (k Tons), by Country 2024 & 2032
- Figure 45: Europe Organic Bakery Products Market Revenue Share (%), by Country 2024 & 2032
- Figure 46: Europe Organic Bakery Products Market Volume Share (%), by Country 2024 & 2032
- Figure 47: Asia Pacific Organic Bakery Products Market Revenue (Million), by Product Type 2024 & 2032
- Figure 48: Asia Pacific Organic Bakery Products Market Volume (k Tons), by Product Type 2024 & 2032
- Figure 49: Asia Pacific Organic Bakery Products Market Revenue Share (%), by Product Type 2024 & 2032
- Figure 50: Asia Pacific Organic Bakery Products Market Volume Share (%), by Product Type 2024 & 2032
- Figure 51: Asia Pacific Organic Bakery Products Market Revenue (Million), by Distribution Channel 2024 & 2032
- Figure 52: Asia Pacific Organic Bakery Products Market Volume (k Tons), by Distribution Channel 2024 & 2032
- Figure 53: Asia Pacific Organic Bakery Products Market Revenue Share (%), by Distribution Channel 2024 & 2032
- Figure 54: Asia Pacific Organic Bakery Products Market Volume Share (%), by Distribution Channel 2024 & 2032
- Figure 55: Asia Pacific Organic Bakery Products Market Revenue (Million), by Country 2024 & 2032
- Figure 56: Asia Pacific Organic Bakery Products Market Volume (k Tons), by Country 2024 & 2032
- Figure 57: Asia Pacific Organic Bakery Products Market Revenue Share (%), by Country 2024 & 2032
- Figure 58: Asia Pacific Organic Bakery Products Market Volume Share (%), by Country 2024 & 2032
- Figure 59: South America Organic Bakery Products Market Revenue (Million), by Product Type 2024 & 2032
- Figure 60: South America Organic Bakery Products Market Volume (k Tons), by Product Type 2024 & 2032
- Figure 61: South America Organic Bakery Products Market Revenue Share (%), by Product Type 2024 & 2032
- Figure 62: South America Organic Bakery Products Market Volume Share (%), by Product Type 2024 & 2032
- Figure 63: South America Organic Bakery Products Market Revenue (Million), by Distribution Channel 2024 & 2032
- Figure 64: South America Organic Bakery Products Market Volume (k Tons), by Distribution Channel 2024 & 2032
- Figure 65: South America Organic Bakery Products Market Revenue Share (%), by Distribution Channel 2024 & 2032
- Figure 66: South America Organic Bakery Products Market Volume Share (%), by Distribution Channel 2024 & 2032
- Figure 67: South America Organic Bakery Products Market Revenue (Million), by Country 2024 & 2032
- Figure 68: South America Organic Bakery Products Market Volume (k Tons), by Country 2024 & 2032
- Figure 69: South America Organic Bakery Products Market Revenue Share (%), by Country 2024 & 2032
- Figure 70: South America Organic Bakery Products Market Volume Share (%), by Country 2024 & 2032
- Figure 71: Middle East and Africa Organic Bakery Products Market Revenue (Million), by Product Type 2024 & 2032
- Figure 72: Middle East and Africa Organic Bakery Products Market Volume (k Tons), by Product Type 2024 & 2032
- Figure 73: Middle East and Africa Organic Bakery Products Market Revenue Share (%), by Product Type 2024 & 2032
- Figure 74: Middle East and Africa Organic Bakery Products Market Volume Share (%), by Product Type 2024 & 2032
- Figure 75: Middle East and Africa Organic Bakery Products Market Revenue (Million), by Distribution Channel 2024 & 2032
- Figure 76: Middle East and Africa Organic Bakery Products Market Volume (k Tons), by Distribution Channel 2024 & 2032
- Figure 77: Middle East and Africa Organic Bakery Products Market Revenue Share (%), by Distribution Channel 2024 & 2032
- Figure 78: Middle East and Africa Organic Bakery Products Market Volume Share (%), by Distribution Channel 2024 & 2032
- Figure 79: Middle East and Africa Organic Bakery Products Market Revenue (Million), by Country 2024 & 2032
- Figure 80: Middle East and Africa Organic Bakery Products Market Volume (k Tons), by Country 2024 & 2032
- Figure 81: Middle East and Africa Organic Bakery Products Market Revenue Share (%), by Country 2024 & 2032
- Figure 82: Middle East and Africa Organic Bakery Products Market Volume Share (%), by Country 2024 & 2032
List of Tables
- Table 1: Global Organic Bakery Products Market Revenue Million Forecast, by Region 2019 & 2032
- Table 2: Global Organic Bakery Products Market Volume k Tons Forecast, by Region 2019 & 2032
- Table 3: Global Organic Bakery Products Market Revenue Million Forecast, by Product Type 2019 & 2032
- Table 4: Global Organic Bakery Products Market Volume k Tons Forecast, by Product Type 2019 & 2032
- Table 5: Global Organic Bakery Products Market Revenue Million Forecast, by Distribution Channel 2019 & 2032
- Table 6: Global Organic Bakery Products Market Volume k Tons Forecast, by Distribution Channel 2019 & 2032
- Table 7: Global Organic Bakery Products Market Revenue Million Forecast, by Region 2019 & 2032
- Table 8: Global Organic Bakery Products Market Volume k Tons Forecast, by Region 2019 & 2032
- Table 9: Global Organic Bakery Products Market Revenue Million Forecast, by Country 2019 & 2032
- Table 10: Global Organic Bakery Products Market Volume k Tons Forecast, by Country 2019 & 2032
- Table 11: United States Organic Bakery Products Market Revenue (Million) Forecast, by Application 2019 & 2032
- Table 12: United States Organic Bakery Products Market Volume (k Tons) Forecast, by Application 2019 & 2032
- Table 13: Canada Organic Bakery Products Market Revenue (Million) Forecast, by Application 2019 & 2032
- Table 14: Canada Organic Bakery Products Market Volume (k Tons) Forecast, by Application 2019 & 2032
- Table 15: Mexico Organic Bakery Products Market Revenue (Million) Forecast, by Application 2019 & 2032
- Table 16: Mexico Organic Bakery Products Market Volume (k Tons) Forecast, by Application 2019 & 2032
- Table 17: Rest of North America Organic Bakery Products Market Revenue (Million) Forecast, by Application 2019 & 2032
- Table 18: Rest of North America Organic Bakery Products Market Volume (k Tons) Forecast, by Application 2019 & 2032
- Table 19: Global Organic Bakery Products Market Revenue Million Forecast, by Country 2019 & 2032
- Table 20: Global Organic Bakery Products Market Volume k Tons Forecast, by Country 2019 & 2032
- Table 21: United Kingdom Organic Bakery Products Market Revenue (Million) Forecast, by Application 2019 & 2032
- Table 22: United Kingdom Organic Bakery Products Market Volume (k Tons) Forecast, by Application 2019 & 2032
- Table 23: Germany Organic Bakery Products Market Revenue (Million) Forecast, by Application 2019 & 2032
- Table 24: Germany Organic Bakery Products Market Volume (k Tons) Forecast, by Application 2019 & 2032
- Table 25: France Organic Bakery Products Market Revenue (Million) Forecast, by Application 2019 & 2032
- Table 26: France Organic Bakery Products Market Volume (k Tons) Forecast, by Application 2019 & 2032
- Table 27: Russia Organic Bakery Products Market Revenue (Million) Forecast, by Application 2019 & 2032
- Table 28: Russia Organic Bakery Products Market Volume (k Tons) Forecast, by Application 2019 & 2032
- Table 29: Italy Organic Bakery Products Market Revenue (Million) Forecast, by Application 2019 & 2032
- Table 30: Italy Organic Bakery Products Market Volume (k Tons) Forecast, by Application 2019 & 2032
- Table 31: Spain Organic Bakery Products Market Revenue (Million) Forecast, by Application 2019 & 2032
- Table 32: Spain Organic Bakery Products Market Volume (k Tons) Forecast, by Application 2019 & 2032
- Table 33: Rest of Europe Organic Bakery Products Market Revenue (Million) Forecast, by Application 2019 & 2032
- Table 34: Rest of Europe Organic Bakery Products Market Volume (k Tons) Forecast, by Application 2019 & 2032
- Table 35: Global Organic Bakery Products Market Revenue Million Forecast, by Country 2019 & 2032
- Table 36: Global Organic Bakery Products Market Volume k Tons Forecast, by Country 2019 & 2032
- Table 37: India Organic Bakery Products Market Revenue (Million) Forecast, by Application 2019 & 2032
- Table 38: India Organic Bakery Products Market Volume (k Tons) Forecast, by Application 2019 & 2032
- Table 39: China Organic Bakery Products Market Revenue (Million) Forecast, by Application 2019 & 2032
- Table 40: China Organic Bakery Products Market Volume (k Tons) Forecast, by Application 2019 & 2032
- Table 41: Japan Organic Bakery Products Market Revenue (Million) Forecast, by Application 2019 & 2032
- Table 42: Japan Organic Bakery Products Market Volume (k Tons) Forecast, by Application 2019 & 2032
- Table 43: Australia Organic Bakery Products Market Revenue (Million) Forecast, by Application 2019 & 2032
- Table 44: Australia Organic Bakery Products Market Volume (k Tons) Forecast, by Application 2019 & 2032
- Table 45: Rest of Asia Pacific Organic Bakery Products Market Revenue (Million) Forecast, by Application 2019 & 2032
- Table 46: Rest of Asia Pacific Organic Bakery Products Market Volume (k Tons) Forecast, by Application 2019 & 2032
- Table 47: Global Organic Bakery Products Market Revenue Million Forecast, by Country 2019 & 2032
- Table 48: Global Organic Bakery Products Market Volume k Tons Forecast, by Country 2019 & 2032
- Table 49: Brazil Organic Bakery Products Market Revenue (Million) Forecast, by Application 2019 & 2032
- Table 50: Brazil Organic Bakery Products Market Volume (k Tons) Forecast, by Application 2019 & 2032
- Table 51: Argentina Organic Bakery Products Market Revenue (Million) Forecast, by Application 2019 & 2032
- Table 52: Argentina Organic Bakery Products Market Volume (k Tons) Forecast, by Application 2019 & 2032
- Table 53: Rest of South America Organic Bakery Products Market Revenue (Million) Forecast, by Application 2019 & 2032
- Table 54: Rest of South America Organic Bakery Products Market Volume (k Tons) Forecast, by Application 2019 & 2032
- Table 55: Global Organic Bakery Products Market Revenue Million Forecast, by Country 2019 & 2032
- Table 56: Global Organic Bakery Products Market Volume k Tons Forecast, by Country 2019 & 2032
- Table 57: South Africa Organic Bakery Products Market Revenue (Million) Forecast, by Application 2019 & 2032
- Table 58: South Africa Organic Bakery Products Market Volume (k Tons) Forecast, by Application 2019 & 2032
- Table 59: United Arab Emirates Organic Bakery Products Market Revenue (Million) Forecast, by Application 2019 & 2032
- Table 60: United Arab Emirates Organic Bakery Products Market Volume (k Tons) Forecast, by Application 2019 & 2032
- Table 61: Rest of Middle East and Africa Organic Bakery Products Market Revenue (Million) Forecast, by Application 2019 & 2032
- Table 62: Rest of Middle East and Africa Organic Bakery Products Market Volume (k Tons) Forecast, by Application 2019 & 2032
- Table 63: Global Organic Bakery Products Market Revenue Million Forecast, by Product Type 2019 & 2032
- Table 64: Global Organic Bakery Products Market Volume k Tons Forecast, by Product Type 2019 & 2032
- Table 65: Global Organic Bakery Products Market Revenue Million Forecast, by Distribution Channel 2019 & 2032
- Table 66: Global Organic Bakery Products Market Volume k Tons Forecast, by Distribution Channel 2019 & 2032
- Table 67: Global Organic Bakery Products Market Revenue Million Forecast, by Country 2019 & 2032
- Table 68: Global Organic Bakery Products Market Volume k Tons Forecast, by Country 2019 & 2032
- Table 69: United States Organic Bakery Products Market Revenue (Million) Forecast, by Application 2019 & 2032
- Table 70: United States Organic Bakery Products Market Volume (k Tons) Forecast, by Application 2019 & 2032
- Table 71: Canada Organic Bakery Products Market Revenue (Million) Forecast, by Application 2019 & 2032
- Table 72: Canada Organic Bakery Products Market Volume (k Tons) Forecast, by Application 2019 & 2032
- Table 73: Mexico Organic Bakery Products Market Revenue (Million) Forecast, by Application 2019 & 2032
- Table 74: Mexico Organic Bakery Products Market Volume (k Tons) Forecast, by Application 2019 & 2032
- Table 75: Rest of North America Organic Bakery Products Market Revenue (Million) Forecast, by Application 2019 & 2032
- Table 76: Rest of North America Organic Bakery Products Market Volume (k Tons) Forecast, by Application 2019 & 2032
- Table 77: Global Organic Bakery Products Market Revenue Million Forecast, by Product Type 2019 & 2032
- Table 78: Global Organic Bakery Products Market Volume k Tons Forecast, by Product Type 2019 & 2032
- Table 79: Global Organic Bakery Products Market Revenue Million Forecast, by Distribution Channel 2019 & 2032
- Table 80: Global Organic Bakery Products Market Volume k Tons Forecast, by Distribution Channel 2019 & 2032
- Table 81: Global Organic Bakery Products Market Revenue Million Forecast, by Country 2019 & 2032
- Table 82: Global Organic Bakery Products Market Volume k Tons Forecast, by Country 2019 & 2032
- Table 83: United Kingdom Organic Bakery Products Market Revenue (Million) Forecast, by Application 2019 & 2032
- Table 84: United Kingdom Organic Bakery Products Market Volume (k Tons) Forecast, by Application 2019 & 2032
- Table 85: Germany Organic Bakery Products Market Revenue (Million) Forecast, by Application 2019 & 2032
- Table 86: Germany Organic Bakery Products Market Volume (k Tons) Forecast, by Application 2019 & 2032
- Table 87: France Organic Bakery Products Market Revenue (Million) Forecast, by Application 2019 & 2032
- Table 88: France Organic Bakery Products Market Volume (k Tons) Forecast, by Application 2019 & 2032
- Table 89: Russia Organic Bakery Products Market Revenue (Million) Forecast, by Application 2019 & 2032
- Table 90: Russia Organic Bakery Products Market Volume (k Tons) Forecast, by Application 2019 & 2032
- Table 91: Italy Organic Bakery Products Market Revenue (Million) Forecast, by Application 2019 & 2032
- Table 92: Italy Organic Bakery Products Market Volume (k Tons) Forecast, by Application 2019 & 2032
- Table 93: Spain Organic Bakery Products Market Revenue (Million) Forecast, by Application 2019 & 2032
- Table 94: Spain Organic Bakery Products Market Volume (k Tons) Forecast, by Application 2019 & 2032
- Table 95: Rest of Europe Organic Bakery Products Market Revenue (Million) Forecast, by Application 2019 & 2032
- Table 96: Rest of Europe Organic Bakery Products Market Volume (k Tons) Forecast, by Application 2019 & 2032
- Table 97: Global Organic Bakery Products Market Revenue Million Forecast, by Product Type 2019 & 2032
- Table 98: Global Organic Bakery Products Market Volume k Tons Forecast, by Product Type 2019 & 2032
- Table 99: Global Organic Bakery Products Market Revenue Million Forecast, by Distribution Channel 2019 & 2032
- Table 100: Global Organic Bakery Products Market Volume k Tons Forecast, by Distribution Channel 2019 & 2032
- Table 101: Global Organic Bakery Products Market Revenue Million Forecast, by Country 2019 & 2032
- Table 102: Global Organic Bakery Products Market Volume k Tons Forecast, by Country 2019 & 2032
- Table 103: India Organic Bakery Products Market Revenue (Million) Forecast, by Application 2019 & 2032
- Table 104: India Organic Bakery Products Market Volume (k Tons) Forecast, by Application 2019 & 2032
- Table 105: China Organic Bakery Products Market Revenue (Million) Forecast, by Application 2019 & 2032
- Table 106: China Organic Bakery Products Market Volume (k Tons) Forecast, by Application 2019 & 2032
- Table 107: Japan Organic Bakery Products Market Revenue (Million) Forecast, by Application 2019 & 2032
- Table 108: Japan Organic Bakery Products Market Volume (k Tons) Forecast, by Application 2019 & 2032
- Table 109: Australia Organic Bakery Products Market Revenue (Million) Forecast, by Application 2019 & 2032
- Table 110: Australia Organic Bakery Products Market Volume (k Tons) Forecast, by Application 2019 & 2032
- Table 111: Rest of Asia Pacific Organic Bakery Products Market Revenue (Million) Forecast, by Application 2019 & 2032
- Table 112: Rest of Asia Pacific Organic Bakery Products Market Volume (k Tons) Forecast, by Application 2019 & 2032
- Table 113: Global Organic Bakery Products Market Revenue Million Forecast, by Product Type 2019 & 2032
- Table 114: Global Organic Bakery Products Market Volume k Tons Forecast, by Product Type 2019 & 2032
- Table 115: Global Organic Bakery Products Market Revenue Million Forecast, by Distribution Channel 2019 & 2032
- Table 116: Global Organic Bakery Products Market Volume k Tons Forecast, by Distribution Channel 2019 & 2032
- Table 117: Global Organic Bakery Products Market Revenue Million Forecast, by Country 2019 & 2032
- Table 118: Global Organic Bakery Products Market Volume k Tons Forecast, by Country 2019 & 2032
- Table 119: Brazil Organic Bakery Products Market Revenue (Million) Forecast, by Application 2019 & 2032
- Table 120: Brazil Organic Bakery Products Market Volume (k Tons) Forecast, by Application 2019 & 2032
- Table 121: Argentina Organic Bakery Products Market Revenue (Million) Forecast, by Application 2019 & 2032
- Table 122: Argentina Organic Bakery Products Market Volume (k Tons) Forecast, by Application 2019 & 2032
- Table 123: Rest of South America Organic Bakery Products Market Revenue (Million) Forecast, by Application 2019 & 2032
- Table 124: Rest of South America Organic Bakery Products Market Volume (k Tons) Forecast, by Application 2019 & 2032
- Table 125: Global Organic Bakery Products Market Revenue Million Forecast, by Product Type 2019 & 2032
- Table 126: Global Organic Bakery Products Market Volume k Tons Forecast, by Product Type 2019 & 2032
- Table 127: Global Organic Bakery Products Market Revenue Million Forecast, by Distribution Channel 2019 & 2032
- Table 128: Global Organic Bakery Products Market Volume k Tons Forecast, by Distribution Channel 2019 & 2032
- Table 129: Global Organic Bakery Products Market Revenue Million Forecast, by Country 2019 & 2032
- Table 130: Global Organic Bakery Products Market Volume k Tons Forecast, by Country 2019 & 2032
- Table 131: South Africa Organic Bakery Products Market Revenue (Million) Forecast, by Application 2019 & 2032
- Table 132: South Africa Organic Bakery Products Market Volume (k Tons) Forecast, by Application 2019 & 2032
- Table 133: United Arab Emirates Organic Bakery Products Market Revenue (Million) Forecast, by Application 2019 & 2032
- Table 134: United Arab Emirates Organic Bakery Products Market Volume (k Tons) Forecast, by Application 2019 & 2032
- Table 135: Rest of Middle East and Africa Organic Bakery Products Market Revenue (Million) Forecast, by Application 2019 & 2032
- Table 136: Rest of Middle East and Africa Organic Bakery Products Market Volume (k Tons) Forecast, by Application 2019 & 2032
Frequently Asked Questions
1. What is the projected Compound Annual Growth Rate (CAGR) of the Organic Bakery Products Market?
The projected CAGR is approximately 9.80%.
2. Which companies are prominent players in the Organic Bakery Products Market?
Key companies in the market include Hero Group AG*List Not Exhaustive, Boulder Brands Inc, General Mills Inc, The Hain Celestial Group Inc, Dawn Foods, Enjoy Life Natural Brands LLC, Amy's Kitchen Inc, Dr Schar AG/SpA, Bobs Red Mill, Kraft Heinz Company.
3. What are the main segments of the Organic Bakery Products Market?
The market segments include Product Type, Distribution Channel.
4. Can you provide details about the market size?
The market size is estimated to be USD 74800 Million as of 2022.
5. What are some drivers contributing to market growth?
Growing Demand for Nutricosmetics Among Millennials; Growing Beauty and Wellness Trend.
6. What are the notable trends driving market growth?
Rising demand for Clean-label and Organic Gluten Free Bakery Products.
7. Are there any restraints impacting market growth?
Stringent Government Regulations and Product Guidelines.
8. Can you provide examples of recent developments in the market?
October 2021: Dr. Schär partnered with Niederwieser Spa to develop gluten-free bread packaging with certified circular plastic. Through this collaboration, Dr. Schär offers an innovative and sustainable packaging solution while maintaining their products' taste, quality, and safety. According to the company, the new, sustainable packaging would be launched throughout Europe for their gluten-free sandwich buns, Schär Panini Rolls, producing the packaging with innovative material made from the advanced recycling of mixed post-consumer plastics.
9. What pricing options are available for accessing the report?
Pricing options include single-user, multi-user, and enterprise licenses priced at USD 4750, USD 5250, and USD 8750 respectively.
10. Is the market size provided in terms of value or volume?
The market size is provided in terms of value, measured in Million and volume, measured in k Tons.
11. Are there any specific market keywords associated with the report?
Yes, the market keyword associated with the report is "Organic Bakery Products Market," which aids in identifying and referencing the specific market segment covered.
12. How do I determine which pricing option suits my needs best?
The pricing options vary based on user requirements and access needs. Individual users may opt for single-user licenses, while businesses requiring broader access may choose multi-user or enterprise licenses for cost-effective access to the report.
13. Are there any additional resources or data provided in the Organic Bakery Products Market report?
While the report offers comprehensive insights, it's advisable to review the specific contents or supplementary materials provided to ascertain if additional resources or data are available.
14. How can I stay updated on further developments or reports in the Organic Bakery Products Market?
To stay informed about further developments, trends, and reports in the Organic Bakery Products Market, consider subscribing to industry newsletters, following relevant companies and organizations, or regularly checking reputable industry news sources and publications.
Methodology
Step 1 - Identification of Relevant Samples Size from Population Database


Step 2 - Approaches for Defining Global Market Size (Value, Volume* & Price*)

Note*: In applicable scenarios
Step 3 - Data Sources
Primary Research
- Web Analytics
- Survey Reports
- Research Institute
- Latest Research Reports
- Opinion Leaders
Secondary Research
- Annual Reports
- White Paper
- Latest Press Release
- Industry Association
- Paid Database
- Investor Presentations

Step 4 - Data Triangulation
Involves using different sources of information in order to increase the validity of a study
These sources are likely to be stakeholders in a program - participants, other researchers, program staff, other community members, and so on.
Then we put all data in single framework & apply various statistical tools to find out the dynamic on the market.
During the analysis stage, feedback from the stakeholder groups would be compared to determine areas of agreement as well as areas of divergence


