
Key Insights
The global packaged rice market, valued at approximately $XX million in 2025, is projected to experience steady growth, driven by several key factors. Rising disposable incomes, particularly in developing economies, are fueling increased demand for convenient and readily available food options like packaged rice. The expanding retail sector, including the rapid growth of online grocery platforms, offers significant distribution channels for packaged rice manufacturers. Further driving market expansion is the increasing consumer preference for healthier, functional rice varieties like brown rice and basmati rice, reflecting a growing awareness of nutritional benefits. While the market faces challenges from fluctuating rice prices and potential supply chain disruptions, the overall outlook remains positive. The diverse range of packaged rice types— encompassing white, red, brown, basmati, and others— caters to a wide array of consumer preferences and dietary needs. The market segmentation by distribution channel highlights the importance of supermarkets, hypermarkets, and online retail, indicating significant growth opportunities within these channels. Similarly, the segmentation by grain size reflects diverse consumer preferences impacting product development and marketing strategies.
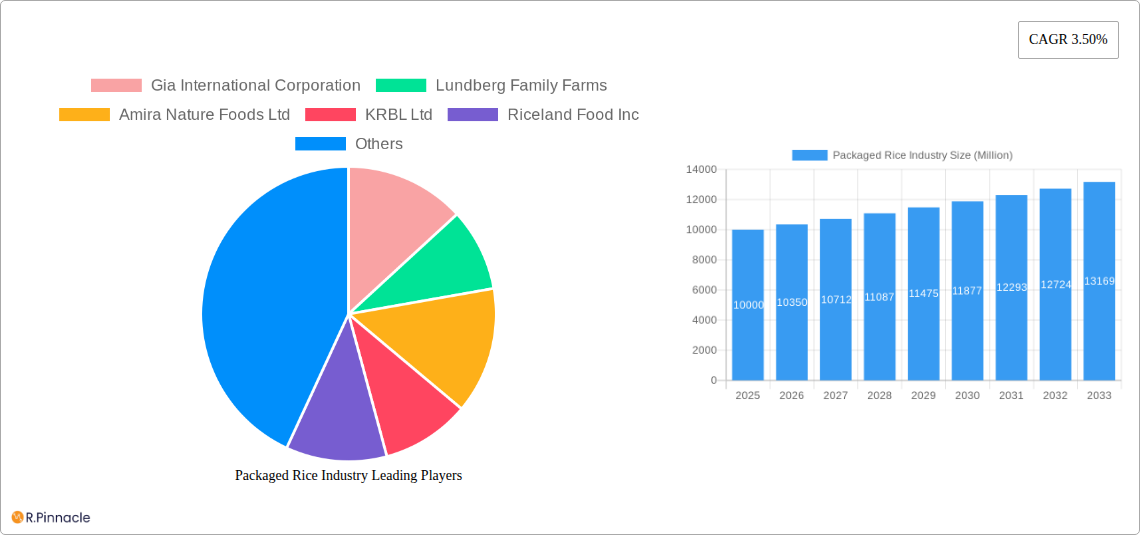
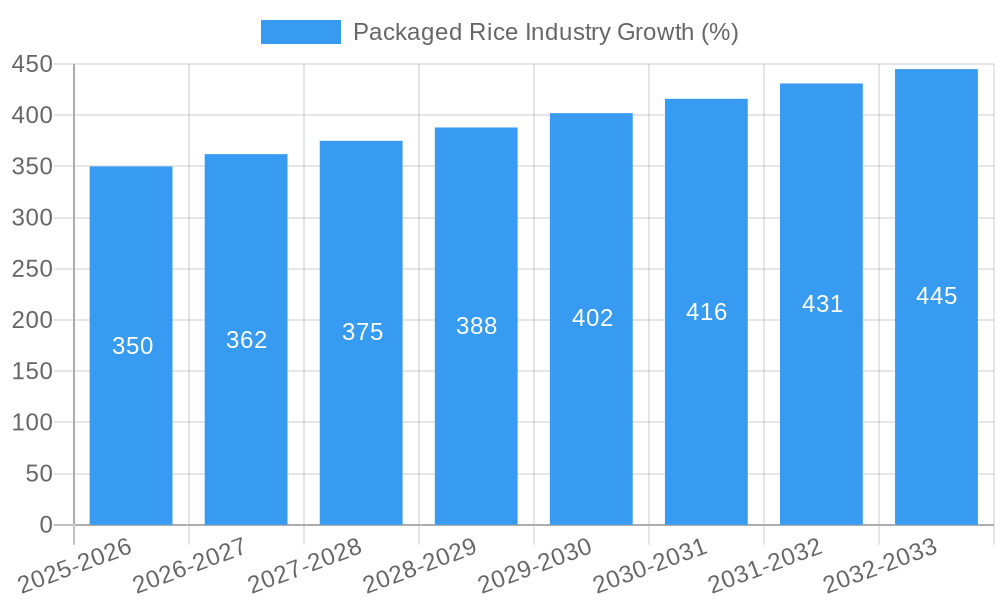
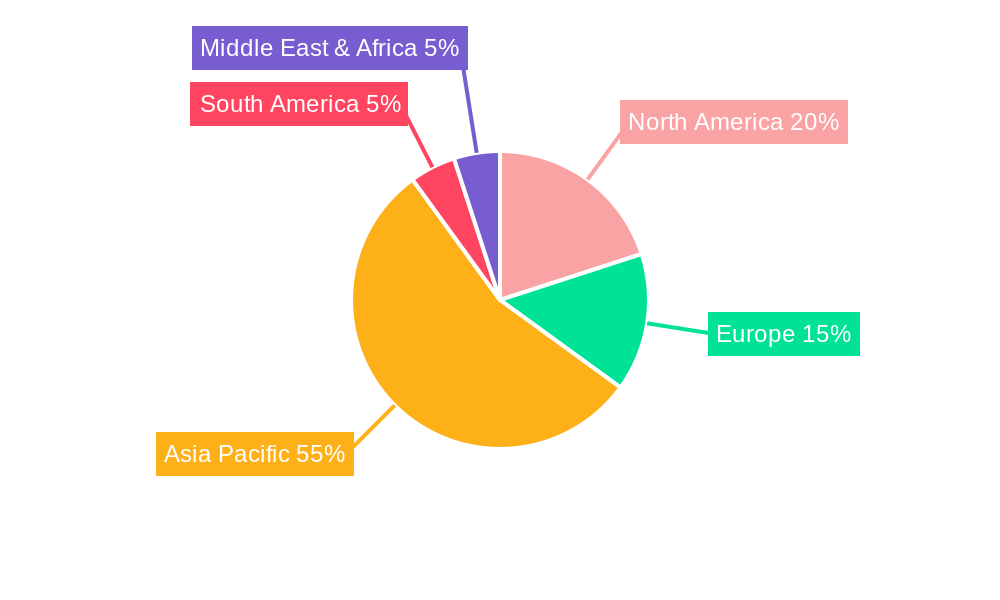
The market's projected Compound Annual Growth Rate (CAGR) of 3.50% from 2025 to 2033 indicates a consistent, albeit moderate, expansion. This growth is expected to be influenced by regional variations, with Asia Pacific likely maintaining its dominant position due to high rice consumption and a large population. North America and Europe are also expected to contribute significantly, driven by increasing demand for convenient food options and diverse rice varieties. Competitive landscape analysis shows a mix of large multinational corporations and regional players, indicating both opportunities and challenges for market entry and expansion. Key players are likely focused on strategies like product diversification, brand building, and strategic partnerships to maintain their market share and capitalize on emerging trends within the packaged rice market. The market's future trajectory will significantly depend on factors such as global economic conditions, agricultural yields, and evolving consumer preferences.
Packaged Rice Industry: A Comprehensive Market Report (2019-2033)
This comprehensive report provides a detailed analysis of the global packaged rice industry, offering invaluable insights for industry professionals, investors, and stakeholders. The report covers the period 2019-2033, with a focus on the estimated year 2025. We analyze market trends, competitive dynamics, and future growth potential, incorporating data from key players like Gia International Corporation, Lundberg Family Farms, Amira Nature Foods Ltd, KRBL Ltd, Riceland Food Inc, Tan Long Group, Adani Group, Producers Rice Mills Inc, Thai Hua Co Ltd, and Riviana Foods Inc. This is not an exhaustive list. The report uses a base year of 2025 and a forecast period of 2025-2033, with historical data spanning 2019-2024.
Packaged Rice Industry Market Structure & Innovation Trends
This section analyzes the competitive landscape of the packaged rice market, examining market concentration, innovation drivers, regulatory frameworks, product substitutes, end-user demographics, and mergers & acquisitions (M&A) activities. The market is characterized by a mix of large multinational corporations and smaller regional players. Market share data reveals that the top five players account for approximately xx% of the global market (2024). Innovation is driven by consumer demand for healthier and more convenient rice options, such as organic and ready-to-eat varieties. Regulatory frameworks vary across regions, influencing production standards and labeling requirements. Substitute products include pasta, quinoa, and other grains. End-user demographics are diverse, reflecting the global consumption of rice across various cultures and income levels. M&A activity, including the xx Million Adani Wilmar acquisition of Kohinoor Brand in 2022, shapes market consolidation and brand dominance. The average deal value for M&A activity in the packaged rice industry between 2019 and 2024 was approximately xx Million.
- Market Concentration: Highly fragmented with a few dominant players.
- Innovation Drivers: Health consciousness, convenience, and premiumization.
- Regulatory Frameworks: Vary across regions, impacting production and labeling.
- Product Substitutes: Pasta, quinoa, and other grains.
- End-User Demographics: Diverse, reflecting global rice consumption patterns.
- M&A Activities: Significant consolidation through acquisitions.
Packaged Rice Industry Market Dynamics & Trends
This section explores the key factors influencing the growth of the packaged rice industry. The market exhibits a steady growth trajectory, with a compound annual growth rate (CAGR) of xx% projected from 2025 to 2033, reaching a market size of xx Million by 2033. This growth is driven by factors like rising global population, increasing urbanization, changing dietary habits (with a shift towards convenient, ready-to-eat options), and expanding retail channels. Technological advancements such as improved milling techniques and packaging solutions enhance efficiency and product shelf life. Consumer preferences are shifting towards healthier options, such as brown rice and organic varieties, alongside more convenient formats, like pre-cooked pouches. Competitive dynamics are shaped by brand loyalty, pricing strategies, and product differentiation. Market penetration of online retail channels is steadily increasing, presenting new growth opportunities.
Dominant Regions & Segments in Packaged Rice Industry
This section identifies the leading regions and segments within the packaged rice market. Asia dominates the global market, driven by high rice consumption and large populations. Within Asia, India and China are major players. In terms of product type, white rice holds the largest market share, followed by basmati rice. Supermarkets/hypermarkets constitute the primary distribution channel, although online retail is rapidly expanding. Long grain rice is the dominant size segment.
- Key Drivers (Asia): High rice consumption, large population, and growing middle class.
- Key Drivers (White Rice): Traditional preference, affordability, and wide availability.
- Key Drivers (Supermarkets/Hypermarkets): Established distribution network and consumer preference.
- Key Drivers (Long Grain Rice): Versatility and suitability for diverse cuisines.
Packaged Rice Industry Product Innovations
The packaged rice industry is witnessing continuous product innovation, driven by consumer demand for healthier, more convenient, and premium options. New product launches include ready-to-eat rice cups, organic varieties with specific health benefits, and functional rice enhanced with added nutrients. Technological advancements in packaging extend shelf life and improve product quality. These innovations cater to evolving consumer preferences and contribute to market expansion.
Report Scope & Segmentation Analysis
This report segments the packaged rice market by type (white, red, brown, basmati, others), distribution channel (supermarkets/hypermarkets, convenience/grocery stores, online retail stores, other distribution channels), and size (short grain, medium grain, long grain). Each segment's growth projections, market size, and competitive dynamics are analyzed, showing varied growth rates across segments.
- By Type: White rice commands the largest market share, with organic rice varieties experiencing the fastest growth.
- By Distribution Channel: Supermarkets/hypermarkets are dominant, while e-commerce is a rapidly growing channel.
- By Size: Long grain rice dominates, reflecting regional culinary preferences.
Key Drivers of Packaged Rice Industry Growth
The growth of the packaged rice industry is propelled by several key factors: rising global population and increased disposable incomes boosting demand; urbanization driving consumer preference for convenient food options; health and wellness trends promoting organic and functional rice consumption; and technological advancements enabling efficient production and processing. Government policies promoting food security and agricultural development in key rice-producing regions also influence market growth.
Challenges in the Packaged Rice Industry Sector
The packaged rice industry faces challenges like fluctuating rice prices due to weather patterns and global supply chain disruptions. Regulatory compliance, food safety standards, and labeling requirements present operational complexities. Intense competition among established players and new entrants necessitates continuous innovation and differentiation to maintain market share. Supply chain disruptions and rising input costs add pressure on profit margins.
Emerging Opportunities in Packaged Rice Industry
Emerging opportunities exist in expanding into new geographic markets, especially in developing countries with growing populations and rising incomes. The development of innovative products caters to specific health needs, including gluten-free, diabetic-friendly and functional rice varieties, is a key area of potential. Strategic alliances with food retailers and online platforms enhance market reach.
Leading Players in the Packaged Rice Industry Market
- Gia International Corporation
- Lundberg Family Farms
- Amira Nature Foods Ltd
- KRBL Ltd
- Riceland Food Inc
- Tan Long Group
- Adani Group
- Producers Rice Mills Inc
- Thai Hua Co Ltd
- Riviana Foods Inc
Key Developments in Packaged Rice Industry
- October 2021: Organic India launched new organic rice products (basmati, red, black).
- May 2022: Adani Wilmar acquired Kohinoor Brand (premium and affordable basmati rice).
- July 2022: Tan Long Group shipped ST25 rice to Japan.
Future Outlook for Packaged Rice Industry Market
The packaged rice industry is poised for continued growth, driven by strong demand, evolving consumer preferences, and technological innovation. Strategic acquisitions, product diversification, and expanding into new markets present key opportunities for market players. The focus on sustainability, traceability, and ethical sourcing will shape future industry trends.
Packaged Rice Industry Segmentation
-
1. Size
- 1.1. Short Grain Rice
- 1.2. Medium Grain Rice
- 1.3. Long Grain Rice
-
2. Type
- 2.1. White Rice
- 2.2. Red Rice
- 2.3. Brown Rice
- 2.4. Basmati Rice
- 2.5. Others
-
3. Distibution Channel
- 3.1. Supermarkets/Hypermarkets
- 3.2. Convenience/ Grocery Stores
- 3.3. Online Retail Stores
- 3.4. Other Distribution Channels
Packaged Rice Industry Segmentation By Geography
-
1. North America
- 1.1. United States
- 1.2. Canada
- 1.3. Mexico
- 1.4. Rest of North America
-
2. Europe
- 2.1. United Kingdom
- 2.2. Germany
- 2.3. Spain
- 2.4. France
- 2.5. Italy
- 2.6. Russia
- 2.7. Rest of Europe
-
3. Asia Pacific
- 3.1. China
- 3.2. Japan
- 3.3. India
- 3.4. Australia
- 3.5. Rest of Asia Pacific
-
4. South America
- 4.1. Brazil
- 4.2. Argentina
- 4.3. Rest of South America
- 5. Middle East
-
6. Saudi Arabia
- 6.1. South Africa
- 6.2. Rest of Middle East
Packaged Rice Industry REPORT HIGHLIGHTS
| Aspects | Details |
|---|---|
| Study Period | 2019-2033 |
| Base Year | 2024 |
| Estimated Year | 2025 |
| Forecast Period | 2025-2033 |
| Historical Period | 2019-2024 |
| Growth Rate | CAGR of 3.50% from 2019-2033 |
| Segmentation |
|
Table of Contents
- 1. Introduction
- 1.1. Research Scope
- 1.2. Market Segmentation
- 1.3. Research Methodology
- 1.4. Definitions and Assumptions
- 2. Executive Summary
- 2.1. Introduction
- 3. Market Dynamics
- 3.1. Introduction
- 3.2. Market Drivers
- 3.2.1. Increasing Incidences of Food Allergies; Favorable Government Initiatives and Regulations for Food Safety
- 3.3. Market Restrains
- 3.3.1. Inconsistencies Involved in Food Allergen Declarations
- 3.4. Market Trends
- 3.4.1. Increasing demand for Premium Packaged Rice
- 4. Market Factor Analysis
- 4.1. Porters Five Forces
- 4.2. Supply/Value Chain
- 4.3. PESTEL analysis
- 4.4. Market Entropy
- 4.5. Patent/Trademark Analysis
- 5. Global Packaged Rice Industry Analysis, Insights and Forecast, 2019-2031
- 5.1. Market Analysis, Insights and Forecast - by Size
- 5.1.1. Short Grain Rice
- 5.1.2. Medium Grain Rice
- 5.1.3. Long Grain Rice
- 5.2. Market Analysis, Insights and Forecast - by Type
- 5.2.1. White Rice
- 5.2.2. Red Rice
- 5.2.3. Brown Rice
- 5.2.4. Basmati Rice
- 5.2.5. Others
- 5.3. Market Analysis, Insights and Forecast - by Distibution Channel
- 5.3.1. Supermarkets/Hypermarkets
- 5.3.2. Convenience/ Grocery Stores
- 5.3.3. Online Retail Stores
- 5.3.4. Other Distribution Channels
- 5.4. Market Analysis, Insights and Forecast - by Region
- 5.4.1. North America
- 5.4.2. Europe
- 5.4.3. Asia Pacific
- 5.4.4. South America
- 5.4.5. Middle East
- 5.4.6. Saudi Arabia
- 5.1. Market Analysis, Insights and Forecast - by Size
- 6. North America Packaged Rice Industry Analysis, Insights and Forecast, 2019-2031
- 6.1. Market Analysis, Insights and Forecast - by Size
- 6.1.1. Short Grain Rice
- 6.1.2. Medium Grain Rice
- 6.1.3. Long Grain Rice
- 6.2. Market Analysis, Insights and Forecast - by Type
- 6.2.1. White Rice
- 6.2.2. Red Rice
- 6.2.3. Brown Rice
- 6.2.4. Basmati Rice
- 6.2.5. Others
- 6.3. Market Analysis, Insights and Forecast - by Distibution Channel
- 6.3.1. Supermarkets/Hypermarkets
- 6.3.2. Convenience/ Grocery Stores
- 6.3.3. Online Retail Stores
- 6.3.4. Other Distribution Channels
- 6.1. Market Analysis, Insights and Forecast - by Size
- 7. Europe Packaged Rice Industry Analysis, Insights and Forecast, 2019-2031
- 7.1. Market Analysis, Insights and Forecast - by Size
- 7.1.1. Short Grain Rice
- 7.1.2. Medium Grain Rice
- 7.1.3. Long Grain Rice
- 7.2. Market Analysis, Insights and Forecast - by Type
- 7.2.1. White Rice
- 7.2.2. Red Rice
- 7.2.3. Brown Rice
- 7.2.4. Basmati Rice
- 7.2.5. Others
- 7.3. Market Analysis, Insights and Forecast - by Distibution Channel
- 7.3.1. Supermarkets/Hypermarkets
- 7.3.2. Convenience/ Grocery Stores
- 7.3.3. Online Retail Stores
- 7.3.4. Other Distribution Channels
- 7.1. Market Analysis, Insights and Forecast - by Size
- 8. Asia Pacific Packaged Rice Industry Analysis, Insights and Forecast, 2019-2031
- 8.1. Market Analysis, Insights and Forecast - by Size
- 8.1.1. Short Grain Rice
- 8.1.2. Medium Grain Rice
- 8.1.3. Long Grain Rice
- 8.2. Market Analysis, Insights and Forecast - by Type
- 8.2.1. White Rice
- 8.2.2. Red Rice
- 8.2.3. Brown Rice
- 8.2.4. Basmati Rice
- 8.2.5. Others
- 8.3. Market Analysis, Insights and Forecast - by Distibution Channel
- 8.3.1. Supermarkets/Hypermarkets
- 8.3.2. Convenience/ Grocery Stores
- 8.3.3. Online Retail Stores
- 8.3.4. Other Distribution Channels
- 8.1. Market Analysis, Insights and Forecast - by Size
- 9. South America Packaged Rice Industry Analysis, Insights and Forecast, 2019-2031
- 9.1. Market Analysis, Insights and Forecast - by Size
- 9.1.1. Short Grain Rice
- 9.1.2. Medium Grain Rice
- 9.1.3. Long Grain Rice
- 9.2. Market Analysis, Insights and Forecast - by Type
- 9.2.1. White Rice
- 9.2.2. Red Rice
- 9.2.3. Brown Rice
- 9.2.4. Basmati Rice
- 9.2.5. Others
- 9.3. Market Analysis, Insights and Forecast - by Distibution Channel
- 9.3.1. Supermarkets/Hypermarkets
- 9.3.2. Convenience/ Grocery Stores
- 9.3.3. Online Retail Stores
- 9.3.4. Other Distribution Channels
- 9.1. Market Analysis, Insights and Forecast - by Size
- 10. Middle East Packaged Rice Industry Analysis, Insights and Forecast, 2019-2031
- 10.1. Market Analysis, Insights and Forecast - by Size
- 10.1.1. Short Grain Rice
- 10.1.2. Medium Grain Rice
- 10.1.3. Long Grain Rice
- 10.2. Market Analysis, Insights and Forecast - by Type
- 10.2.1. White Rice
- 10.2.2. Red Rice
- 10.2.3. Brown Rice
- 10.2.4. Basmati Rice
- 10.2.5. Others
- 10.3. Market Analysis, Insights and Forecast - by Distibution Channel
- 10.3.1. Supermarkets/Hypermarkets
- 10.3.2. Convenience/ Grocery Stores
- 10.3.3. Online Retail Stores
- 10.3.4. Other Distribution Channels
- 10.1. Market Analysis, Insights and Forecast - by Size
- 11. Saudi Arabia Packaged Rice Industry Analysis, Insights and Forecast, 2019-2031
- 11.1. Market Analysis, Insights and Forecast - by Size
- 11.1.1. Short Grain Rice
- 11.1.2. Medium Grain Rice
- 11.1.3. Long Grain Rice
- 11.2. Market Analysis, Insights and Forecast - by Type
- 11.2.1. White Rice
- 11.2.2. Red Rice
- 11.2.3. Brown Rice
- 11.2.4. Basmati Rice
- 11.2.5. Others
- 11.3. Market Analysis, Insights and Forecast - by Distibution Channel
- 11.3.1. Supermarkets/Hypermarkets
- 11.3.2. Convenience/ Grocery Stores
- 11.3.3. Online Retail Stores
- 11.3.4. Other Distribution Channels
- 11.1. Market Analysis, Insights and Forecast - by Size
- 12. North America Packaged Rice Industry Analysis, Insights and Forecast, 2019-2031
- 12.1. Market Analysis, Insights and Forecast - By Country/Sub-region
- 12.1.1 United States
- 12.1.2 Canada
- 12.1.3 Mexico
- 12.1.4 Rest of North America
- 13. Europe Packaged Rice Industry Analysis, Insights and Forecast, 2019-2031
- 13.1. Market Analysis, Insights and Forecast - By Country/Sub-region
- 13.1.1 United Kingdom
- 13.1.2 Germany
- 13.1.3 Spain
- 13.1.4 France
- 13.1.5 Italy
- 13.1.6 Russia
- 13.1.7 Rest of Europe
- 14. Asia Pacific Packaged Rice Industry Analysis, Insights and Forecast, 2019-2031
- 14.1. Market Analysis, Insights and Forecast - By Country/Sub-region
- 14.1.1 China
- 14.1.2 Japan
- 14.1.3 India
- 14.1.4 Australia
- 14.1.5 Rest of Asia Pacific
- 15. South America Packaged Rice Industry Analysis, Insights and Forecast, 2019-2031
- 15.1. Market Analysis, Insights and Forecast - By Country/Sub-region
- 15.1.1 Brazil
- 15.1.2 Argentina
- 15.1.3 Rest of South America
- 16. Middle East & Africa Packaged Rice Industry Analysis, Insights and Forecast, 2019-2031
- 16.1. Market Analysis, Insights and Forecast - By Country/Sub-region
- 16.1.1 UAE
- 16.1.2 South Africa
- 16.1.3 Saudi Arabia
- 16.1.4 Rest of MEA
- 17. Competitive Analysis
- 17.1. Global Market Share Analysis 2024
- 17.2. Company Profiles
- 17.2.1 Gia International Corporation
- 17.2.1.1. Overview
- 17.2.1.2. Products
- 17.2.1.3. SWOT Analysis
- 17.2.1.4. Recent Developments
- 17.2.1.5. Financials (Based on Availability)
- 17.2.2 Lundberg Family Farms
- 17.2.2.1. Overview
- 17.2.2.2. Products
- 17.2.2.3. SWOT Analysis
- 17.2.2.4. Recent Developments
- 17.2.2.5. Financials (Based on Availability)
- 17.2.3 Amira Nature Foods Ltd
- 17.2.3.1. Overview
- 17.2.3.2. Products
- 17.2.3.3. SWOT Analysis
- 17.2.3.4. Recent Developments
- 17.2.3.5. Financials (Based on Availability)
- 17.2.4 KRBL Ltd
- 17.2.4.1. Overview
- 17.2.4.2. Products
- 17.2.4.3. SWOT Analysis
- 17.2.4.4. Recent Developments
- 17.2.4.5. Financials (Based on Availability)
- 17.2.5 Riceland Food Inc
- 17.2.5.1. Overview
- 17.2.5.2. Products
- 17.2.5.3. SWOT Analysis
- 17.2.5.4. Recent Developments
- 17.2.5.5. Financials (Based on Availability)
- 17.2.6 Tan Long Group*List Not Exhaustive
- 17.2.6.1. Overview
- 17.2.6.2. Products
- 17.2.6.3. SWOT Analysis
- 17.2.6.4. Recent Developments
- 17.2.6.5. Financials (Based on Availability)
- 17.2.7 Adani Group
- 17.2.7.1. Overview
- 17.2.7.2. Products
- 17.2.7.3. SWOT Analysis
- 17.2.7.4. Recent Developments
- 17.2.7.5. Financials (Based on Availability)
- 17.2.8 Producers Rice Mills Inc
- 17.2.8.1. Overview
- 17.2.8.2. Products
- 17.2.8.3. SWOT Analysis
- 17.2.8.4. Recent Developments
- 17.2.8.5. Financials (Based on Availability)
- 17.2.9 Thai Hua Co Ltd
- 17.2.9.1. Overview
- 17.2.9.2. Products
- 17.2.9.3. SWOT Analysis
- 17.2.9.4. Recent Developments
- 17.2.9.5. Financials (Based on Availability)
- 17.2.10 Riviana Foods Inc
- 17.2.10.1. Overview
- 17.2.10.2. Products
- 17.2.10.3. SWOT Analysis
- 17.2.10.4. Recent Developments
- 17.2.10.5. Financials (Based on Availability)
- 17.2.1 Gia International Corporation
List of Figures
- Figure 1: Global Packaged Rice Industry Revenue Breakdown (Million, %) by Region 2024 & 2032
- Figure 2: North America Packaged Rice Industry Revenue (Million), by Country 2024 & 2032
- Figure 3: North America Packaged Rice Industry Revenue Share (%), by Country 2024 & 2032
- Figure 4: Europe Packaged Rice Industry Revenue (Million), by Country 2024 & 2032
- Figure 5: Europe Packaged Rice Industry Revenue Share (%), by Country 2024 & 2032
- Figure 6: Asia Pacific Packaged Rice Industry Revenue (Million), by Country 2024 & 2032
- Figure 7: Asia Pacific Packaged Rice Industry Revenue Share (%), by Country 2024 & 2032
- Figure 8: South America Packaged Rice Industry Revenue (Million), by Country 2024 & 2032
- Figure 9: South America Packaged Rice Industry Revenue Share (%), by Country 2024 & 2032
- Figure 10: Middle East & Africa Packaged Rice Industry Revenue (Million), by Country 2024 & 2032
- Figure 11: Middle East & Africa Packaged Rice Industry Revenue Share (%), by Country 2024 & 2032
- Figure 12: North America Packaged Rice Industry Revenue (Million), by Size 2024 & 2032
- Figure 13: North America Packaged Rice Industry Revenue Share (%), by Size 2024 & 2032
- Figure 14: North America Packaged Rice Industry Revenue (Million), by Type 2024 & 2032
- Figure 15: North America Packaged Rice Industry Revenue Share (%), by Type 2024 & 2032
- Figure 16: North America Packaged Rice Industry Revenue (Million), by Distibution Channel 2024 & 2032
- Figure 17: North America Packaged Rice Industry Revenue Share (%), by Distibution Channel 2024 & 2032
- Figure 18: North America Packaged Rice Industry Revenue (Million), by Country 2024 & 2032
- Figure 19: North America Packaged Rice Industry Revenue Share (%), by Country 2024 & 2032
- Figure 20: Europe Packaged Rice Industry Revenue (Million), by Size 2024 & 2032
- Figure 21: Europe Packaged Rice Industry Revenue Share (%), by Size 2024 & 2032
- Figure 22: Europe Packaged Rice Industry Revenue (Million), by Type 2024 & 2032
- Figure 23: Europe Packaged Rice Industry Revenue Share (%), by Type 2024 & 2032
- Figure 24: Europe Packaged Rice Industry Revenue (Million), by Distibution Channel 2024 & 2032
- Figure 25: Europe Packaged Rice Industry Revenue Share (%), by Distibution Channel 2024 & 2032
- Figure 26: Europe Packaged Rice Industry Revenue (Million), by Country 2024 & 2032
- Figure 27: Europe Packaged Rice Industry Revenue Share (%), by Country 2024 & 2032
- Figure 28: Asia Pacific Packaged Rice Industry Revenue (Million), by Size 2024 & 2032
- Figure 29: Asia Pacific Packaged Rice Industry Revenue Share (%), by Size 2024 & 2032
- Figure 30: Asia Pacific Packaged Rice Industry Revenue (Million), by Type 2024 & 2032
- Figure 31: Asia Pacific Packaged Rice Industry Revenue Share (%), by Type 2024 & 2032
- Figure 32: Asia Pacific Packaged Rice Industry Revenue (Million), by Distibution Channel 2024 & 2032
- Figure 33: Asia Pacific Packaged Rice Industry Revenue Share (%), by Distibution Channel 2024 & 2032
- Figure 34: Asia Pacific Packaged Rice Industry Revenue (Million), by Country 2024 & 2032
- Figure 35: Asia Pacific Packaged Rice Industry Revenue Share (%), by Country 2024 & 2032
- Figure 36: South America Packaged Rice Industry Revenue (Million), by Size 2024 & 2032
- Figure 37: South America Packaged Rice Industry Revenue Share (%), by Size 2024 & 2032
- Figure 38: South America Packaged Rice Industry Revenue (Million), by Type 2024 & 2032
- Figure 39: South America Packaged Rice Industry Revenue Share (%), by Type 2024 & 2032
- Figure 40: South America Packaged Rice Industry Revenue (Million), by Distibution Channel 2024 & 2032
- Figure 41: South America Packaged Rice Industry Revenue Share (%), by Distibution Channel 2024 & 2032
- Figure 42: South America Packaged Rice Industry Revenue (Million), by Country 2024 & 2032
- Figure 43: South America Packaged Rice Industry Revenue Share (%), by Country 2024 & 2032
- Figure 44: Middle East Packaged Rice Industry Revenue (Million), by Size 2024 & 2032
- Figure 45: Middle East Packaged Rice Industry Revenue Share (%), by Size 2024 & 2032
- Figure 46: Middle East Packaged Rice Industry Revenue (Million), by Type 2024 & 2032
- Figure 47: Middle East Packaged Rice Industry Revenue Share (%), by Type 2024 & 2032
- Figure 48: Middle East Packaged Rice Industry Revenue (Million), by Distibution Channel 2024 & 2032
- Figure 49: Middle East Packaged Rice Industry Revenue Share (%), by Distibution Channel 2024 & 2032
- Figure 50: Middle East Packaged Rice Industry Revenue (Million), by Country 2024 & 2032
- Figure 51: Middle East Packaged Rice Industry Revenue Share (%), by Country 2024 & 2032
- Figure 52: Saudi Arabia Packaged Rice Industry Revenue (Million), by Size 2024 & 2032
- Figure 53: Saudi Arabia Packaged Rice Industry Revenue Share (%), by Size 2024 & 2032
- Figure 54: Saudi Arabia Packaged Rice Industry Revenue (Million), by Type 2024 & 2032
- Figure 55: Saudi Arabia Packaged Rice Industry Revenue Share (%), by Type 2024 & 2032
- Figure 56: Saudi Arabia Packaged Rice Industry Revenue (Million), by Distibution Channel 2024 & 2032
- Figure 57: Saudi Arabia Packaged Rice Industry Revenue Share (%), by Distibution Channel 2024 & 2032
- Figure 58: Saudi Arabia Packaged Rice Industry Revenue (Million), by Country 2024 & 2032
- Figure 59: Saudi Arabia Packaged Rice Industry Revenue Share (%), by Country 2024 & 2032
List of Tables
- Table 1: Global Packaged Rice Industry Revenue Million Forecast, by Region 2019 & 2032
- Table 2: Global Packaged Rice Industry Revenue Million Forecast, by Size 2019 & 2032
- Table 3: Global Packaged Rice Industry Revenue Million Forecast, by Type 2019 & 2032
- Table 4: Global Packaged Rice Industry Revenue Million Forecast, by Distibution Channel 2019 & 2032
- Table 5: Global Packaged Rice Industry Revenue Million Forecast, by Region 2019 & 2032
- Table 6: Global Packaged Rice Industry Revenue Million Forecast, by Country 2019 & 2032
- Table 7: United States Packaged Rice Industry Revenue (Million) Forecast, by Application 2019 & 2032
- Table 8: Canada Packaged Rice Industry Revenue (Million) Forecast, by Application 2019 & 2032
- Table 9: Mexico Packaged Rice Industry Revenue (Million) Forecast, by Application 2019 & 2032
- Table 10: Rest of North America Packaged Rice Industry Revenue (Million) Forecast, by Application 2019 & 2032
- Table 11: Global Packaged Rice Industry Revenue Million Forecast, by Country 2019 & 2032
- Table 12: United Kingdom Packaged Rice Industry Revenue (Million) Forecast, by Application 2019 & 2032
- Table 13: Germany Packaged Rice Industry Revenue (Million) Forecast, by Application 2019 & 2032
- Table 14: Spain Packaged Rice Industry Revenue (Million) Forecast, by Application 2019 & 2032
- Table 15: France Packaged Rice Industry Revenue (Million) Forecast, by Application 2019 & 2032
- Table 16: Italy Packaged Rice Industry Revenue (Million) Forecast, by Application 2019 & 2032
- Table 17: Russia Packaged Rice Industry Revenue (Million) Forecast, by Application 2019 & 2032
- Table 18: Rest of Europe Packaged Rice Industry Revenue (Million) Forecast, by Application 2019 & 2032
- Table 19: Global Packaged Rice Industry Revenue Million Forecast, by Country 2019 & 2032
- Table 20: China Packaged Rice Industry Revenue (Million) Forecast, by Application 2019 & 2032
- Table 21: Japan Packaged Rice Industry Revenue (Million) Forecast, by Application 2019 & 2032
- Table 22: India Packaged Rice Industry Revenue (Million) Forecast, by Application 2019 & 2032
- Table 23: Australia Packaged Rice Industry Revenue (Million) Forecast, by Application 2019 & 2032
- Table 24: Rest of Asia Pacific Packaged Rice Industry Revenue (Million) Forecast, by Application 2019 & 2032
- Table 25: Global Packaged Rice Industry Revenue Million Forecast, by Country 2019 & 2032
- Table 26: Brazil Packaged Rice Industry Revenue (Million) Forecast, by Application 2019 & 2032
- Table 27: Argentina Packaged Rice Industry Revenue (Million) Forecast, by Application 2019 & 2032
- Table 28: Rest of South America Packaged Rice Industry Revenue (Million) Forecast, by Application 2019 & 2032
- Table 29: Global Packaged Rice Industry Revenue Million Forecast, by Country 2019 & 2032
- Table 30: UAE Packaged Rice Industry Revenue (Million) Forecast, by Application 2019 & 2032
- Table 31: South Africa Packaged Rice Industry Revenue (Million) Forecast, by Application 2019 & 2032
- Table 32: Saudi Arabia Packaged Rice Industry Revenue (Million) Forecast, by Application 2019 & 2032
- Table 33: Rest of MEA Packaged Rice Industry Revenue (Million) Forecast, by Application 2019 & 2032
- Table 34: Global Packaged Rice Industry Revenue Million Forecast, by Size 2019 & 2032
- Table 35: Global Packaged Rice Industry Revenue Million Forecast, by Type 2019 & 2032
- Table 36: Global Packaged Rice Industry Revenue Million Forecast, by Distibution Channel 2019 & 2032
- Table 37: Global Packaged Rice Industry Revenue Million Forecast, by Country 2019 & 2032
- Table 38: United States Packaged Rice Industry Revenue (Million) Forecast, by Application 2019 & 2032
- Table 39: Canada Packaged Rice Industry Revenue (Million) Forecast, by Application 2019 & 2032
- Table 40: Mexico Packaged Rice Industry Revenue (Million) Forecast, by Application 2019 & 2032
- Table 41: Rest of North America Packaged Rice Industry Revenue (Million) Forecast, by Application 2019 & 2032
- Table 42: Global Packaged Rice Industry Revenue Million Forecast, by Size 2019 & 2032
- Table 43: Global Packaged Rice Industry Revenue Million Forecast, by Type 2019 & 2032
- Table 44: Global Packaged Rice Industry Revenue Million Forecast, by Distibution Channel 2019 & 2032
- Table 45: Global Packaged Rice Industry Revenue Million Forecast, by Country 2019 & 2032
- Table 46: United Kingdom Packaged Rice Industry Revenue (Million) Forecast, by Application 2019 & 2032
- Table 47: Germany Packaged Rice Industry Revenue (Million) Forecast, by Application 2019 & 2032
- Table 48: Spain Packaged Rice Industry Revenue (Million) Forecast, by Application 2019 & 2032
- Table 49: France Packaged Rice Industry Revenue (Million) Forecast, by Application 2019 & 2032
- Table 50: Italy Packaged Rice Industry Revenue (Million) Forecast, by Application 2019 & 2032
- Table 51: Russia Packaged Rice Industry Revenue (Million) Forecast, by Application 2019 & 2032
- Table 52: Rest of Europe Packaged Rice Industry Revenue (Million) Forecast, by Application 2019 & 2032
- Table 53: Global Packaged Rice Industry Revenue Million Forecast, by Size 2019 & 2032
- Table 54: Global Packaged Rice Industry Revenue Million Forecast, by Type 2019 & 2032
- Table 55: Global Packaged Rice Industry Revenue Million Forecast, by Distibution Channel 2019 & 2032
- Table 56: Global Packaged Rice Industry Revenue Million Forecast, by Country 2019 & 2032
- Table 57: China Packaged Rice Industry Revenue (Million) Forecast, by Application 2019 & 2032
- Table 58: Japan Packaged Rice Industry Revenue (Million) Forecast, by Application 2019 & 2032
- Table 59: India Packaged Rice Industry Revenue (Million) Forecast, by Application 2019 & 2032
- Table 60: Australia Packaged Rice Industry Revenue (Million) Forecast, by Application 2019 & 2032
- Table 61: Rest of Asia Pacific Packaged Rice Industry Revenue (Million) Forecast, by Application 2019 & 2032
- Table 62: Global Packaged Rice Industry Revenue Million Forecast, by Size 2019 & 2032
- Table 63: Global Packaged Rice Industry Revenue Million Forecast, by Type 2019 & 2032
- Table 64: Global Packaged Rice Industry Revenue Million Forecast, by Distibution Channel 2019 & 2032
- Table 65: Global Packaged Rice Industry Revenue Million Forecast, by Country 2019 & 2032
- Table 66: Brazil Packaged Rice Industry Revenue (Million) Forecast, by Application 2019 & 2032
- Table 67: Argentina Packaged Rice Industry Revenue (Million) Forecast, by Application 2019 & 2032
- Table 68: Rest of South America Packaged Rice Industry Revenue (Million) Forecast, by Application 2019 & 2032
- Table 69: Global Packaged Rice Industry Revenue Million Forecast, by Size 2019 & 2032
- Table 70: Global Packaged Rice Industry Revenue Million Forecast, by Type 2019 & 2032
- Table 71: Global Packaged Rice Industry Revenue Million Forecast, by Distibution Channel 2019 & 2032
- Table 72: Global Packaged Rice Industry Revenue Million Forecast, by Country 2019 & 2032
- Table 73: Global Packaged Rice Industry Revenue Million Forecast, by Size 2019 & 2032
- Table 74: Global Packaged Rice Industry Revenue Million Forecast, by Type 2019 & 2032
- Table 75: Global Packaged Rice Industry Revenue Million Forecast, by Distibution Channel 2019 & 2032
- Table 76: Global Packaged Rice Industry Revenue Million Forecast, by Country 2019 & 2032
- Table 77: South Africa Packaged Rice Industry Revenue (Million) Forecast, by Application 2019 & 2032
- Table 78: Rest of Middle East Packaged Rice Industry Revenue (Million) Forecast, by Application 2019 & 2032
Frequently Asked Questions
1. What is the projected Compound Annual Growth Rate (CAGR) of the Packaged Rice Industry?
The projected CAGR is approximately 3.50%.
2. Which companies are prominent players in the Packaged Rice Industry?
Key companies in the market include Gia International Corporation, Lundberg Family Farms, Amira Nature Foods Ltd, KRBL Ltd, Riceland Food Inc, Tan Long Group*List Not Exhaustive, Adani Group, Producers Rice Mills Inc, Thai Hua Co Ltd, Riviana Foods Inc.
3. What are the main segments of the Packaged Rice Industry?
The market segments include Size, Type, Distibution Channel.
4. Can you provide details about the market size?
The market size is estimated to be USD XX Million as of 2022.
5. What are some drivers contributing to market growth?
Increasing Incidences of Food Allergies; Favorable Government Initiatives and Regulations for Food Safety.
6. What are the notable trends driving market growth?
Increasing demand for Premium Packaged Rice.
7. Are there any restraints impacting market growth?
Inconsistencies Involved in Food Allergen Declarations.
8. Can you provide examples of recent developments in the market?
In May 2022, Adani Wilmar announced the acquisition of Kohinoor Brand in India from McCormick Switzerland GMBH. The acquisition includes the Kohinoor brand portfolio comprising of Kohinoor for premium Basmati rice and Charminar for affordable rice.
9. What pricing options are available for accessing the report?
Pricing options include single-user, multi-user, and enterprise licenses priced at USD 4750, USD 5250, and USD 8750 respectively.
10. Is the market size provided in terms of value or volume?
The market size is provided in terms of value, measured in Million.
11. Are there any specific market keywords associated with the report?
Yes, the market keyword associated with the report is "Packaged Rice Industry," which aids in identifying and referencing the specific market segment covered.
12. How do I determine which pricing option suits my needs best?
The pricing options vary based on user requirements and access needs. Individual users may opt for single-user licenses, while businesses requiring broader access may choose multi-user or enterprise licenses for cost-effective access to the report.
13. Are there any additional resources or data provided in the Packaged Rice Industry report?
While the report offers comprehensive insights, it's advisable to review the specific contents or supplementary materials provided to ascertain if additional resources or data are available.
14. How can I stay updated on further developments or reports in the Packaged Rice Industry?
To stay informed about further developments, trends, and reports in the Packaged Rice Industry, consider subscribing to industry newsletters, following relevant companies and organizations, or regularly checking reputable industry news sources and publications.
Methodology
Step 1 - Identification of Relevant Samples Size from Population Database


Step 2 - Approaches for Defining Global Market Size (Value, Volume* & Price*)

Note*: In applicable scenarios
Step 3 - Data Sources
Primary Research
- Web Analytics
- Survey Reports
- Research Institute
- Latest Research Reports
- Opinion Leaders
Secondary Research
- Annual Reports
- White Paper
- Latest Press Release
- Industry Association
- Paid Database
- Investor Presentations

Step 4 - Data Triangulation
Involves using different sources of information in order to increase the validity of a study
These sources are likely to be stakeholders in a program - participants, other researchers, program staff, other community members, and so on.
Then we put all data in single framework & apply various statistical tools to find out the dynamic on the market.
During the analysis stage, feedback from the stakeholder groups would be compared to determine areas of agreement as well as areas of divergence


