
Key Insights
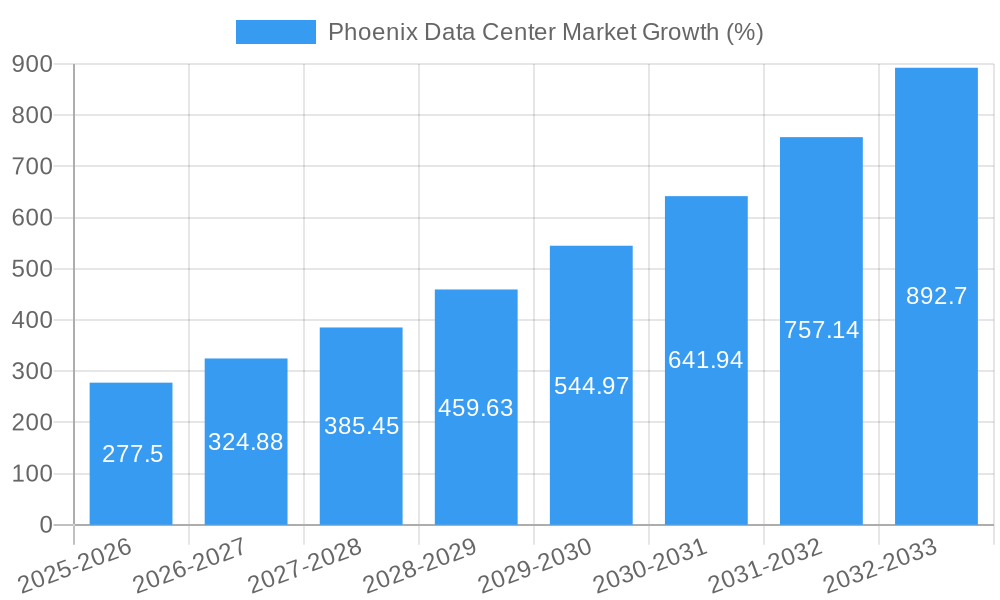
The Phoenix data center market is experiencing robust growth, fueled by a burgeoning demand for cloud services, the expansion of 5G networks, and increasing digital transformation initiatives across various sectors. The market's Compound Annual Growth Rate (CAGR) of 18.50% from 2019 to 2024 indicates a significant upward trajectory. This growth is driven by the need for low-latency connectivity, enhanced data security, and robust infrastructure to support the ever-increasing volume of data generated by businesses and consumers. The diverse segments within the Phoenix market, including hyperscale colocation facilities, retail colocation, and various end-user industries (cloud & IT, telecom, media & entertainment, etc.), contribute to this dynamic expansion. Factors like increasing energy costs and land availability constraints could act as potential restraints on market growth. However, ongoing investments in infrastructure and innovative cooling technologies are mitigating these challenges. The prevalence of Tier 1 and Tier 2 data centers in Phoenix, catering to different levels of redundancy and resilience requirements, demonstrates the market’s sophistication and capacity to handle diverse customer needs. Large and Mega data centers are likely to dominate the market share due to the economies of scale offered by these larger facilities.
The competitive landscape is marked by a mix of established players like Digital Realty Trust Inc., CyrusOne, and Iron Mountain, alongside emerging players vying for market share. This competitive environment fosters innovation and drives down prices, making data center services more accessible to a broader range of businesses. The geographical distribution of the market is likely concentrated within the Phoenix metropolitan area, leveraging its existing robust infrastructure and strategic location. Future growth will likely depend on the successful implementation of sustainable practices, advancements in edge computing, and the continued influx of technology companies into the region. A consistent supply of skilled labor will also be crucial in ensuring the continued expansion of the Phoenix data center market.
This comprehensive report provides an in-depth analysis of the Phoenix data center market, offering valuable insights for industry professionals, investors, and strategic planners. Covering the period 2019-2033, with a focus on 2025, this report unveils market dynamics, growth drivers, challenges, and future opportunities within this rapidly expanding sector. The report leverages rigorous data analysis and incorporates key industry developments to paint a clear picture of the Phoenix data center landscape.
Phoenix Data Center Market Market Structure & Innovation Trends
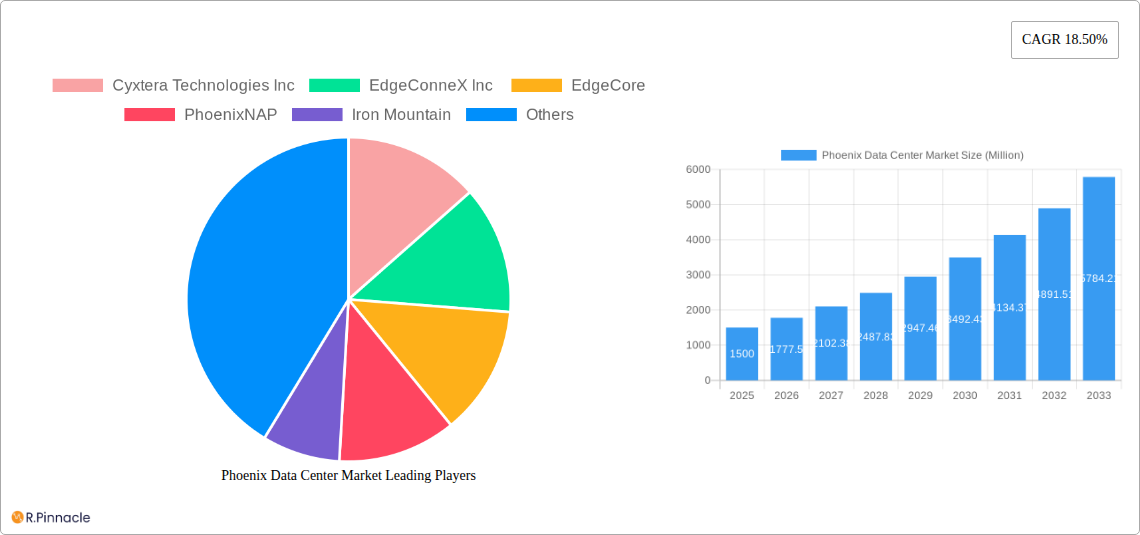
The Phoenix data center market exhibits a moderately concentrated structure, with several large players holding significant market share. Cyxtera Technologies Inc, Digital Realty Trust Inc, and others contribute to this landscape. However, the market also accommodates numerous smaller players and emerging companies. Market share data for 2024 indicates that the top 5 players hold approximately 60% of the market, with the remaining 40% distributed amongst smaller participants. The value of M&A activities in the Phoenix market from 2019 to 2024 totalled approximately $xx Million, reflecting ongoing consolidation and strategic expansion. Innovation in the Phoenix market is driven by factors like:
- Growing demand for cloud services: Driving investments in larger, more efficient data centers.
- Technological advancements: In areas like AI, IoT, and 5G are boosting data center requirements.
- Government support: Through favorable tax policies and initiatives promoting digital infrastructure.
- Sustainable practices: Increasing emphasis on energy efficiency and environmental responsibility.
Regulatory frameworks, though generally supportive, present ongoing challenges related to permitting and environmental compliance. Product substitutes, such as edge computing solutions, are influencing market dynamics and necessitating adaptation strategies among established players. The end-user demographic is diversified, with a strong representation from Cloud & IT, Telecom, and E-commerce sectors. M&A activity is expected to continue, with a projected $xx Million in deal value for 2025-2033.
Phoenix Data Center Market Market Dynamics & Trends
The Phoenix data center market is experiencing robust growth, driven primarily by the region's economic expansion, burgeoning technology sector, and strategic geographical location. The compound annual growth rate (CAGR) from 2019 to 2024 was approximately xx%, and a projected CAGR of xx% is anticipated for the period 2025-2033. Market penetration of hyperscale data centers is increasing, driven by the expanding needs of major cloud providers. Technological advancements, including increased adoption of artificial intelligence and the Internet of Things, are fueling further expansion. Consumer preferences are shifting towards energy-efficient and sustainable data center solutions, impacting provider choices and facility designs. Competitive dynamics are characterized by intense competition for market share, particularly among large players. This is leading to a focus on differentiation through innovative services, improved energy efficiency, and strategic partnerships. However, competition is also stimulating innovation and driving the development of cost-effective solutions.
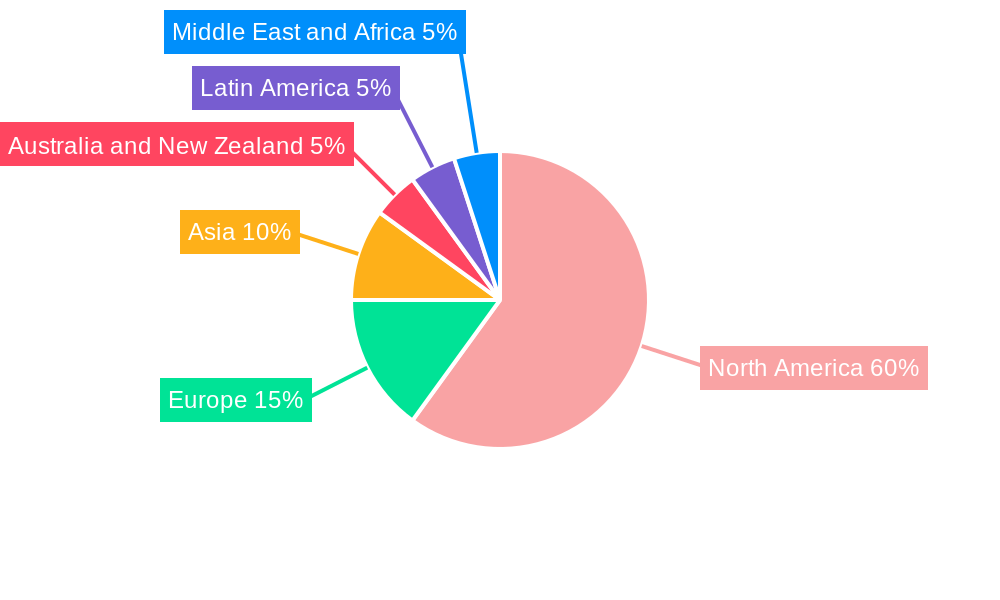
Dominant Regions & Segments in Phoenix Data Center Market
The Phoenix metropolitan area is the dominant region within the market. Key drivers include:
- Favorable business climate: Arizona's low taxes and business-friendly regulations attract investment.
- Abundant renewable energy sources: Supporting sustainable data center operations.
- Robust infrastructure: Including reliable power grids and fiber optic connectivity.
Segment Dominance:
- By DC Size: The Large and Mega segments currently dominate, driven by hyperscale cloud providers.
- By Tier Type: Tier III and Tier IV facilities are increasingly prevalent due to higher reliability requirements.
- By Absorption: Utilized capacity is high, reflecting strong market demand, though Non-Utilized capacity remains a significant percentage (xx%).
- By Colocation Type: The Wholesale segment is experiencing significant growth, with Hyperscale colocation seeing the fastest expansion rate.
- By End User: The Cloud & IT sector is the largest end-user segment, followed by Telecom and E-commerce.
Phoenix Data Center Market Product Innovations
Recent product innovations include the adoption of advanced cooling technologies, increased use of modular designs for scalability, and enhanced security features. These innovations aim to improve energy efficiency, reduce operational costs, and provide greater flexibility to meet the evolving needs of customers. The market is also witnessing the rise of edge data centers, designed to address latency concerns and support the growth of 5G and IoT applications. These innovations align closely with market demands for sustainability, higher capacity, and lower latency.
Report Scope & Segmentation Analysis
This report segments the Phoenix data center market by:
- DC Size: Small, Medium, Large, Massive, Mega. Mega data centers are projected to experience the highest growth over the forecast period.
- Tier Type: Tier 1, Tier 2, Tier 3, Tier 4. Higher-tier facilities are expected to dominate as reliability standards increase.
- Absorption: Utilized and Non-Utilized. The utilized segment is projected to grow steadily, with opportunities in the non-utilized portion for expansion.
- Colocation Type: Retail, Wholesale, Hyperscale. Hyperscale growth will be significant and dominate the market.
- End User: Cloud & IT, Telecom, Media & Entertainment, Government, BFSI, Manufacturing, E-Commerce, Other End User. Cloud & IT will maintain its position as the largest market segment.
Growth projections for each segment vary, based on individual market drivers and competitive dynamics. Market size estimations, and competitive analyses are detailed within the full report.
Key Drivers of Phoenix Data Center Market Growth
Several factors are driving the growth of the Phoenix data center market:
- Strong economic growth in Arizona: Attracting businesses and increasing demand for data center services.
- Expansion of the technology sector: Creating a need for robust data center infrastructure.
- Favorable regulatory environment: Encouraging investment in data center projects.
- Growing adoption of cloud computing: Increasing reliance on cloud-based services is driving data center demand.
- Investment in renewable energy: Fostering the development of sustainable data centers.
Challenges in the Phoenix Data Center Market Sector
The Phoenix data center market faces several challenges:
- Land scarcity and high land prices: Increasing development costs and potentially limiting expansion.
- Power availability and grid infrastructure limitations: Potential constraints on growth unless adequately addressed.
- Competition from other data center hubs: Requiring differentiation strategies to attract investment.
- Environmental concerns and regulatory compliance: The need for sustainable practices and adherence to strict environmental regulations.
These challenges require proactive strategies to mitigate their impact on market growth and sustainability.
Emerging Opportunities in Phoenix Data Center Market
Emerging opportunities in the Phoenix market include:
- Growth of edge computing: Providing opportunities for specialized data center development.
- Increasing demand for sustainable and energy-efficient data centers: Attracting environmentally conscious businesses.
- Development of advanced data center technologies: Creating competitive advantages.
- Expansion into new market segments: Exploring untapped sectors for data center services.
Leading Players in the Phoenix Data Center Market Market
- Cyxtera Technologies Inc
- EdgeConneX Inc
- EdgeCore
- PhoenixNAP
- Iron Mountain
- DataBank
- Evocative
- CyrusOne
- Expedient
- Flexential
- Cogent
- Evoque
- Vantage Data Center
- H5 Data centers
- Digital Realty Trust Inc
Key Developments in Phoenix Data Center Market Industry
- November 2022: STACK Infrastructure announces plans for a massive new 230-megawatt data center campus in downtown Phoenix, comprising 1.78 Million square feet. This signifies a significant investment in the market and will bolster its capacity to meet growing demand.
- October 2022: Aligned Data Centers expands its Arizona footprint by acquiring two additional land plots in Phoenix, highlighting commitment to sustainable development in the region and leveraging tax incentives.
Future Outlook for Phoenix Data Center Market Market
The Phoenix data center market is poised for continued strong growth over the forecast period (2025-2033). Driven by economic expansion, technological advancements, and increasing demand for cloud services, the market is expected to attract further investment and development. Strategic opportunities exist in areas such as edge computing, sustainable data center development, and the expansion into new market segments. The ongoing influx of major technology companies and a supportive business environment suggest a bright outlook for the Phoenix data center market.
Phoenix Data Center Market Segmentation
-
1. DC Size
- 1.1. Small
- 1.2. Medium
- 1.3. Large
- 1.4. Massive
- 1.5. Mega
-
2. Tier Type
- 2.1. Tier 1 & 2
- 2.2. Tier 3
- 2.3. Tier 4
-
3. Absorption
-
3.1. Utilized
-
3.1.1. By Colocation Type
- 3.1.1.1. Retail
- 3.1.1.2. Wholesale
- 3.1.1.3. Hyperscale
-
3.1.2. By End User
- 3.1.2.1. Cloud & IT
- 3.1.2.2. Telecom
- 3.1.2.3. Media & Entertainment
- 3.1.2.4. Government
- 3.1.2.5. BFSI
- 3.1.2.6. Manufacturing
- 3.1.2.7. E-Commerce
- 3.1.2.8. Other End User
-
3.1.1. By Colocation Type
- 3.2. Non-Utilized
-
3.1. Utilized
Phoenix Data Center Market Segmentation By Geography
-
1. North America
- 1.1. United States
- 1.2. Canada
- 1.3. Mexico
-
2. South America
- 2.1. Brazil
- 2.2. Argentina
- 2.3. Rest of South America
-
3. Europe
- 3.1. United Kingdom
- 3.2. Germany
- 3.3. France
- 3.4. Italy
- 3.5. Spain
- 3.6. Russia
- 3.7. Benelux
- 3.8. Nordics
- 3.9. Rest of Europe
-
4. Middle East & Africa
- 4.1. Turkey
- 4.2. Israel
- 4.3. GCC
- 4.4. North Africa
- 4.5. South Africa
- 4.6. Rest of Middle East & Africa
-
5. Asia Pacific
- 5.1. China
- 5.2. India
- 5.3. Japan
- 5.4. South Korea
- 5.5. ASEAN
- 5.6. Oceania
- 5.7. Rest of Asia Pacific
Phoenix Data Center Market REPORT HIGHLIGHTS
| Aspects | Details |
|---|---|
| Study Period | 2019-2033 |
| Base Year | 2024 |
| Estimated Year | 2025 |
| Forecast Period | 2025-2033 |
| Historical Period | 2019-2024 |
| Growth Rate | CAGR of 18.50% from 2019-2033 |
| Segmentation |
|
Table of Contents
- 1. Introduction
- 1.1. Research Scope
- 1.2. Market Segmentation
- 1.3. Research Methodology
- 1.4. Definitions and Assumptions
- 2. Executive Summary
- 2.1. Introduction
- 3. Market Dynamics
- 3.1. Introduction
- 3.2. Market Drivers
- 3.2.1. Growing Adoption of Cloud Services is expected to flourish the market; Increasing Growth in Wholesale Datacenter Multi-tenant Spaces to propel demand (albeit from a lower base); Increased Emphasis on Compliance with Data Regulations and Cost-Effective Nature of Multi-tenant Facilities to Drive Adoption among SME's
- 3.3. Market Restrains
- 3.3.1. Dependence on Regulatory Landscape & Stringent Security Requirements
- 3.4. Market Trends
- 3.4.1. Cloud computing is anticipated to hold a significant share
- 4. Market Factor Analysis
- 4.1. Porters Five Forces
- 4.2. Supply/Value Chain
- 4.3. PESTEL analysis
- 4.4. Market Entropy
- 4.5. Patent/Trademark Analysis
- 5. Global Phoenix Data Center Market Analysis, Insights and Forecast, 2019-2031
- 5.1. Market Analysis, Insights and Forecast - by DC Size
- 5.1.1. Small
- 5.1.2. Medium
- 5.1.3. Large
- 5.1.4. Massive
- 5.1.5. Mega
- 5.2. Market Analysis, Insights and Forecast - by Tier Type
- 5.2.1. Tier 1 & 2
- 5.2.2. Tier 3
- 5.2.3. Tier 4
- 5.3. Market Analysis, Insights and Forecast - by Absorption
- 5.3.1. Utilized
- 5.3.1.1. By Colocation Type
- 5.3.1.1.1. Retail
- 5.3.1.1.2. Wholesale
- 5.3.1.1.3. Hyperscale
- 5.3.1.2. By End User
- 5.3.1.2.1. Cloud & IT
- 5.3.1.2.2. Telecom
- 5.3.1.2.3. Media & Entertainment
- 5.3.1.2.4. Government
- 5.3.1.2.5. BFSI
- 5.3.1.2.6. Manufacturing
- 5.3.1.2.7. E-Commerce
- 5.3.1.2.8. Other End User
- 5.3.1.1. By Colocation Type
- 5.3.2. Non-Utilized
- 5.3.1. Utilized
- 5.4. Market Analysis, Insights and Forecast - by Region
- 5.4.1. North America
- 5.4.2. South America
- 5.4.3. Europe
- 5.4.4. Middle East & Africa
- 5.4.5. Asia Pacific
- 5.1. Market Analysis, Insights and Forecast - by DC Size
- 6. North America Phoenix Data Center Market Analysis, Insights and Forecast, 2019-2031
- 6.1. Market Analysis, Insights and Forecast - by DC Size
- 6.1.1. Small
- 6.1.2. Medium
- 6.1.3. Large
- 6.1.4. Massive
- 6.1.5. Mega
- 6.2. Market Analysis, Insights and Forecast - by Tier Type
- 6.2.1. Tier 1 & 2
- 6.2.2. Tier 3
- 6.2.3. Tier 4
- 6.3. Market Analysis, Insights and Forecast - by Absorption
- 6.3.1. Utilized
- 6.3.1.1. By Colocation Type
- 6.3.1.1.1. Retail
- 6.3.1.1.2. Wholesale
- 6.3.1.1.3. Hyperscale
- 6.3.1.2. By End User
- 6.3.1.2.1. Cloud & IT
- 6.3.1.2.2. Telecom
- 6.3.1.2.3. Media & Entertainment
- 6.3.1.2.4. Government
- 6.3.1.2.5. BFSI
- 6.3.1.2.6. Manufacturing
- 6.3.1.2.7. E-Commerce
- 6.3.1.2.8. Other End User
- 6.3.1.1. By Colocation Type
- 6.3.2. Non-Utilized
- 6.3.1. Utilized
- 6.1. Market Analysis, Insights and Forecast - by DC Size
- 7. South America Phoenix Data Center Market Analysis, Insights and Forecast, 2019-2031
- 7.1. Market Analysis, Insights and Forecast - by DC Size
- 7.1.1. Small
- 7.1.2. Medium
- 7.1.3. Large
- 7.1.4. Massive
- 7.1.5. Mega
- 7.2. Market Analysis, Insights and Forecast - by Tier Type
- 7.2.1. Tier 1 & 2
- 7.2.2. Tier 3
- 7.2.3. Tier 4
- 7.3. Market Analysis, Insights and Forecast - by Absorption
- 7.3.1. Utilized
- 7.3.1.1. By Colocation Type
- 7.3.1.1.1. Retail
- 7.3.1.1.2. Wholesale
- 7.3.1.1.3. Hyperscale
- 7.3.1.2. By End User
- 7.3.1.2.1. Cloud & IT
- 7.3.1.2.2. Telecom
- 7.3.1.2.3. Media & Entertainment
- 7.3.1.2.4. Government
- 7.3.1.2.5. BFSI
- 7.3.1.2.6. Manufacturing
- 7.3.1.2.7. E-Commerce
- 7.3.1.2.8. Other End User
- 7.3.1.1. By Colocation Type
- 7.3.2. Non-Utilized
- 7.3.1. Utilized
- 7.1. Market Analysis, Insights and Forecast - by DC Size
- 8. Europe Phoenix Data Center Market Analysis, Insights and Forecast, 2019-2031
- 8.1. Market Analysis, Insights and Forecast - by DC Size
- 8.1.1. Small
- 8.1.2. Medium
- 8.1.3. Large
- 8.1.4. Massive
- 8.1.5. Mega
- 8.2. Market Analysis, Insights and Forecast - by Tier Type
- 8.2.1. Tier 1 & 2
- 8.2.2. Tier 3
- 8.2.3. Tier 4
- 8.3. Market Analysis, Insights and Forecast - by Absorption
- 8.3.1. Utilized
- 8.3.1.1. By Colocation Type
- 8.3.1.1.1. Retail
- 8.3.1.1.2. Wholesale
- 8.3.1.1.3. Hyperscale
- 8.3.1.2. By End User
- 8.3.1.2.1. Cloud & IT
- 8.3.1.2.2. Telecom
- 8.3.1.2.3. Media & Entertainment
- 8.3.1.2.4. Government
- 8.3.1.2.5. BFSI
- 8.3.1.2.6. Manufacturing
- 8.3.1.2.7. E-Commerce
- 8.3.1.2.8. Other End User
- 8.3.1.1. By Colocation Type
- 8.3.2. Non-Utilized
- 8.3.1. Utilized
- 8.1. Market Analysis, Insights and Forecast - by DC Size
- 9. Middle East & Africa Phoenix Data Center Market Analysis, Insights and Forecast, 2019-2031
- 9.1. Market Analysis, Insights and Forecast - by DC Size
- 9.1.1. Small
- 9.1.2. Medium
- 9.1.3. Large
- 9.1.4. Massive
- 9.1.5. Mega
- 9.2. Market Analysis, Insights and Forecast - by Tier Type
- 9.2.1. Tier 1 & 2
- 9.2.2. Tier 3
- 9.2.3. Tier 4
- 9.3. Market Analysis, Insights and Forecast - by Absorption
- 9.3.1. Utilized
- 9.3.1.1. By Colocation Type
- 9.3.1.1.1. Retail
- 9.3.1.1.2. Wholesale
- 9.3.1.1.3. Hyperscale
- 9.3.1.2. By End User
- 9.3.1.2.1. Cloud & IT
- 9.3.1.2.2. Telecom
- 9.3.1.2.3. Media & Entertainment
- 9.3.1.2.4. Government
- 9.3.1.2.5. BFSI
- 9.3.1.2.6. Manufacturing
- 9.3.1.2.7. E-Commerce
- 9.3.1.2.8. Other End User
- 9.3.1.1. By Colocation Type
- 9.3.2. Non-Utilized
- 9.3.1. Utilized
- 9.1. Market Analysis, Insights and Forecast - by DC Size
- 10. Asia Pacific Phoenix Data Center Market Analysis, Insights and Forecast, 2019-2031
- 10.1. Market Analysis, Insights and Forecast - by DC Size
- 10.1.1. Small
- 10.1.2. Medium
- 10.1.3. Large
- 10.1.4. Massive
- 10.1.5. Mega
- 10.2. Market Analysis, Insights and Forecast - by Tier Type
- 10.2.1. Tier 1 & 2
- 10.2.2. Tier 3
- 10.2.3. Tier 4
- 10.3. Market Analysis, Insights and Forecast - by Absorption
- 10.3.1. Utilized
- 10.3.1.1. By Colocation Type
- 10.3.1.1.1. Retail
- 10.3.1.1.2. Wholesale
- 10.3.1.1.3. Hyperscale
- 10.3.1.2. By End User
- 10.3.1.2.1. Cloud & IT
- 10.3.1.2.2. Telecom
- 10.3.1.2.3. Media & Entertainment
- 10.3.1.2.4. Government
- 10.3.1.2.5. BFSI
- 10.3.1.2.6. Manufacturing
- 10.3.1.2.7. E-Commerce
- 10.3.1.2.8. Other End User
- 10.3.1.1. By Colocation Type
- 10.3.2. Non-Utilized
- 10.3.1. Utilized
- 10.1. Market Analysis, Insights and Forecast - by DC Size
- 11. North America Phoenix Data Center Market Analysis, Insights and Forecast, 2019-2031
- 11.1. Market Analysis, Insights and Forecast - By Country/Sub-region
- 11.1.1.
- 12. Europe Phoenix Data Center Market Analysis, Insights and Forecast, 2019-2031
- 12.1. Market Analysis, Insights and Forecast - By Country/Sub-region
- 12.1.1.
- 13. Asia Phoenix Data Center Market Analysis, Insights and Forecast, 2019-2031
- 13.1. Market Analysis, Insights and Forecast - By Country/Sub-region
- 13.1.1.
- 14. Australia and New Zealand Phoenix Data Center Market Analysis, Insights and Forecast, 2019-2031
- 14.1. Market Analysis, Insights and Forecast - By Country/Sub-region
- 14.1.1.
- 15. Latin America Phoenix Data Center Market Analysis, Insights and Forecast, 2019-2031
- 15.1. Market Analysis, Insights and Forecast - By Country/Sub-region
- 15.1.1.
- 16. Middle East and Africa Phoenix Data Center Market Analysis, Insights and Forecast, 2019-2031
- 16.1. Market Analysis, Insights and Forecast - By Country/Sub-region
- 16.1.1.
- 17. Competitive Analysis
- 17.1. Global Market Share Analysis 2024
- 17.2. Company Profiles
- 17.2.1 Cyxtera Technologies Inc
- 17.2.1.1. Overview
- 17.2.1.2. Products
- 17.2.1.3. SWOT Analysis
- 17.2.1.4. Recent Developments
- 17.2.1.5. Financials (Based on Availability)
- 17.2.2 EdgeConneX Inc
- 17.2.2.1. Overview
- 17.2.2.2. Products
- 17.2.2.3. SWOT Analysis
- 17.2.2.4. Recent Developments
- 17.2.2.5. Financials (Based on Availability)
- 17.2.3 EdgeCore
- 17.2.3.1. Overview
- 17.2.3.2. Products
- 17.2.3.3. SWOT Analysis
- 17.2.3.4. Recent Developments
- 17.2.3.5. Financials (Based on Availability)
- 17.2.4 PhoenixNAP
- 17.2.4.1. Overview
- 17.2.4.2. Products
- 17.2.4.3. SWOT Analysis
- 17.2.4.4. Recent Developments
- 17.2.4.5. Financials (Based on Availability)
- 17.2.5 Iron Mountain
- 17.2.5.1. Overview
- 17.2.5.2. Products
- 17.2.5.3. SWOT Analysis
- 17.2.5.4. Recent Developments
- 17.2.5.5. Financials (Based on Availability)
- 17.2.6 DataBank
- 17.2.6.1. Overview
- 17.2.6.2. Products
- 17.2.6.3. SWOT Analysis
- 17.2.6.4. Recent Developments
- 17.2.6.5. Financials (Based on Availability)
- 17.2.7 Evocative
- 17.2.7.1. Overview
- 17.2.7.2. Products
- 17.2.7.3. SWOT Analysis
- 17.2.7.4. Recent Developments
- 17.2.7.5. Financials (Based on Availability)
- 17.2.8 CyrusOne
- 17.2.8.1. Overview
- 17.2.8.2. Products
- 17.2.8.3. SWOT Analysis
- 17.2.8.4. Recent Developments
- 17.2.8.5. Financials (Based on Availability)
- 17.2.9 Expedient
- 17.2.9.1. Overview
- 17.2.9.2. Products
- 17.2.9.3. SWOT Analysis
- 17.2.9.4. Recent Developments
- 17.2.9.5. Financials (Based on Availability)
- 17.2.10 Flexential
- 17.2.10.1. Overview
- 17.2.10.2. Products
- 17.2.10.3. SWOT Analysis
- 17.2.10.4. Recent Developments
- 17.2.10.5. Financials (Based on Availability)
- 17.2.11 Cogent
- 17.2.11.1. Overview
- 17.2.11.2. Products
- 17.2.11.3. SWOT Analysis
- 17.2.11.4. Recent Developments
- 17.2.11.5. Financials (Based on Availability)
- 17.2.12 Evoque
- 17.2.12.1. Overview
- 17.2.12.2. Products
- 17.2.12.3. SWOT Analysis
- 17.2.12.4. Recent Developments
- 17.2.12.5. Financials (Based on Availability)
- 17.2.13 Vantage Data Center
- 17.2.13.1. Overview
- 17.2.13.2. Products
- 17.2.13.3. SWOT Analysis
- 17.2.13.4. Recent Developments
- 17.2.13.5. Financials (Based on Availability)
- 17.2.14 H5 Data centers
- 17.2.14.1. Overview
- 17.2.14.2. Products
- 17.2.14.3. SWOT Analysis
- 17.2.14.4. Recent Developments
- 17.2.14.5. Financials (Based on Availability)
- 17.2.15 Digital Realty Trust Inc
- 17.2.15.1. Overview
- 17.2.15.2. Products
- 17.2.15.3. SWOT Analysis
- 17.2.15.4. Recent Developments
- 17.2.15.5. Financials (Based on Availability)
- 17.2.1 Cyxtera Technologies Inc
List of Figures
- Figure 1: Global Phoenix Data Center Market Revenue Breakdown (Million, %) by Region 2024 & 2032
- Figure 2: North America Phoenix Data Center Market Revenue (Million), by Country 2024 & 2032
- Figure 3: North America Phoenix Data Center Market Revenue Share (%), by Country 2024 & 2032
- Figure 4: Europe Phoenix Data Center Market Revenue (Million), by Country 2024 & 2032
- Figure 5: Europe Phoenix Data Center Market Revenue Share (%), by Country 2024 & 2032
- Figure 6: Asia Phoenix Data Center Market Revenue (Million), by Country 2024 & 2032
- Figure 7: Asia Phoenix Data Center Market Revenue Share (%), by Country 2024 & 2032
- Figure 8: Australia and New Zealand Phoenix Data Center Market Revenue (Million), by Country 2024 & 2032
- Figure 9: Australia and New Zealand Phoenix Data Center Market Revenue Share (%), by Country 2024 & 2032
- Figure 10: Latin America Phoenix Data Center Market Revenue (Million), by Country 2024 & 2032
- Figure 11: Latin America Phoenix Data Center Market Revenue Share (%), by Country 2024 & 2032
- Figure 12: Middle East and Africa Phoenix Data Center Market Revenue (Million), by Country 2024 & 2032
- Figure 13: Middle East and Africa Phoenix Data Center Market Revenue Share (%), by Country 2024 & 2032
- Figure 14: North America Phoenix Data Center Market Revenue (Million), by DC Size 2024 & 2032
- Figure 15: North America Phoenix Data Center Market Revenue Share (%), by DC Size 2024 & 2032
- Figure 16: North America Phoenix Data Center Market Revenue (Million), by Tier Type 2024 & 2032
- Figure 17: North America Phoenix Data Center Market Revenue Share (%), by Tier Type 2024 & 2032
- Figure 18: North America Phoenix Data Center Market Revenue (Million), by Absorption 2024 & 2032
- Figure 19: North America Phoenix Data Center Market Revenue Share (%), by Absorption 2024 & 2032
- Figure 20: North America Phoenix Data Center Market Revenue (Million), by Country 2024 & 2032
- Figure 21: North America Phoenix Data Center Market Revenue Share (%), by Country 2024 & 2032
- Figure 22: South America Phoenix Data Center Market Revenue (Million), by DC Size 2024 & 2032
- Figure 23: South America Phoenix Data Center Market Revenue Share (%), by DC Size 2024 & 2032
- Figure 24: South America Phoenix Data Center Market Revenue (Million), by Tier Type 2024 & 2032
- Figure 25: South America Phoenix Data Center Market Revenue Share (%), by Tier Type 2024 & 2032
- Figure 26: South America Phoenix Data Center Market Revenue (Million), by Absorption 2024 & 2032
- Figure 27: South America Phoenix Data Center Market Revenue Share (%), by Absorption 2024 & 2032
- Figure 28: South America Phoenix Data Center Market Revenue (Million), by Country 2024 & 2032
- Figure 29: South America Phoenix Data Center Market Revenue Share (%), by Country 2024 & 2032
- Figure 30: Europe Phoenix Data Center Market Revenue (Million), by DC Size 2024 & 2032
- Figure 31: Europe Phoenix Data Center Market Revenue Share (%), by DC Size 2024 & 2032
- Figure 32: Europe Phoenix Data Center Market Revenue (Million), by Tier Type 2024 & 2032
- Figure 33: Europe Phoenix Data Center Market Revenue Share (%), by Tier Type 2024 & 2032
- Figure 34: Europe Phoenix Data Center Market Revenue (Million), by Absorption 2024 & 2032
- Figure 35: Europe Phoenix Data Center Market Revenue Share (%), by Absorption 2024 & 2032
- Figure 36: Europe Phoenix Data Center Market Revenue (Million), by Country 2024 & 2032
- Figure 37: Europe Phoenix Data Center Market Revenue Share (%), by Country 2024 & 2032
- Figure 38: Middle East & Africa Phoenix Data Center Market Revenue (Million), by DC Size 2024 & 2032
- Figure 39: Middle East & Africa Phoenix Data Center Market Revenue Share (%), by DC Size 2024 & 2032
- Figure 40: Middle East & Africa Phoenix Data Center Market Revenue (Million), by Tier Type 2024 & 2032
- Figure 41: Middle East & Africa Phoenix Data Center Market Revenue Share (%), by Tier Type 2024 & 2032
- Figure 42: Middle East & Africa Phoenix Data Center Market Revenue (Million), by Absorption 2024 & 2032
- Figure 43: Middle East & Africa Phoenix Data Center Market Revenue Share (%), by Absorption 2024 & 2032
- Figure 44: Middle East & Africa Phoenix Data Center Market Revenue (Million), by Country 2024 & 2032
- Figure 45: Middle East & Africa Phoenix Data Center Market Revenue Share (%), by Country 2024 & 2032
- Figure 46: Asia Pacific Phoenix Data Center Market Revenue (Million), by DC Size 2024 & 2032
- Figure 47: Asia Pacific Phoenix Data Center Market Revenue Share (%), by DC Size 2024 & 2032
- Figure 48: Asia Pacific Phoenix Data Center Market Revenue (Million), by Tier Type 2024 & 2032
- Figure 49: Asia Pacific Phoenix Data Center Market Revenue Share (%), by Tier Type 2024 & 2032
- Figure 50: Asia Pacific Phoenix Data Center Market Revenue (Million), by Absorption 2024 & 2032
- Figure 51: Asia Pacific Phoenix Data Center Market Revenue Share (%), by Absorption 2024 & 2032
- Figure 52: Asia Pacific Phoenix Data Center Market Revenue (Million), by Country 2024 & 2032
- Figure 53: Asia Pacific Phoenix Data Center Market Revenue Share (%), by Country 2024 & 2032
List of Tables
- Table 1: Global Phoenix Data Center Market Revenue Million Forecast, by Region 2019 & 2032
- Table 2: Global Phoenix Data Center Market Revenue Million Forecast, by DC Size 2019 & 2032
- Table 3: Global Phoenix Data Center Market Revenue Million Forecast, by Tier Type 2019 & 2032
- Table 4: Global Phoenix Data Center Market Revenue Million Forecast, by Absorption 2019 & 2032
- Table 5: Global Phoenix Data Center Market Revenue Million Forecast, by Region 2019 & 2032
- Table 6: Global Phoenix Data Center Market Revenue Million Forecast, by Country 2019 & 2032
- Table 7: Phoenix Data Center Market Revenue (Million) Forecast, by Application 2019 & 2032
- Table 8: Global Phoenix Data Center Market Revenue Million Forecast, by Country 2019 & 2032
- Table 9: Phoenix Data Center Market Revenue (Million) Forecast, by Application 2019 & 2032
- Table 10: Global Phoenix Data Center Market Revenue Million Forecast, by Country 2019 & 2032
- Table 11: Phoenix Data Center Market Revenue (Million) Forecast, by Application 2019 & 2032
- Table 12: Global Phoenix Data Center Market Revenue Million Forecast, by Country 2019 & 2032
- Table 13: Phoenix Data Center Market Revenue (Million) Forecast, by Application 2019 & 2032
- Table 14: Global Phoenix Data Center Market Revenue Million Forecast, by Country 2019 & 2032
- Table 15: Phoenix Data Center Market Revenue (Million) Forecast, by Application 2019 & 2032
- Table 16: Global Phoenix Data Center Market Revenue Million Forecast, by Country 2019 & 2032
- Table 17: Phoenix Data Center Market Revenue (Million) Forecast, by Application 2019 & 2032
- Table 18: Global Phoenix Data Center Market Revenue Million Forecast, by DC Size 2019 & 2032
- Table 19: Global Phoenix Data Center Market Revenue Million Forecast, by Tier Type 2019 & 2032
- Table 20: Global Phoenix Data Center Market Revenue Million Forecast, by Absorption 2019 & 2032
- Table 21: Global Phoenix Data Center Market Revenue Million Forecast, by Country 2019 & 2032
- Table 22: United States Phoenix Data Center Market Revenue (Million) Forecast, by Application 2019 & 2032
- Table 23: Canada Phoenix Data Center Market Revenue (Million) Forecast, by Application 2019 & 2032
- Table 24: Mexico Phoenix Data Center Market Revenue (Million) Forecast, by Application 2019 & 2032
- Table 25: Global Phoenix Data Center Market Revenue Million Forecast, by DC Size 2019 & 2032
- Table 26: Global Phoenix Data Center Market Revenue Million Forecast, by Tier Type 2019 & 2032
- Table 27: Global Phoenix Data Center Market Revenue Million Forecast, by Absorption 2019 & 2032
- Table 28: Global Phoenix Data Center Market Revenue Million Forecast, by Country 2019 & 2032
- Table 29: Brazil Phoenix Data Center Market Revenue (Million) Forecast, by Application 2019 & 2032
- Table 30: Argentina Phoenix Data Center Market Revenue (Million) Forecast, by Application 2019 & 2032
- Table 31: Rest of South America Phoenix Data Center Market Revenue (Million) Forecast, by Application 2019 & 2032
- Table 32: Global Phoenix Data Center Market Revenue Million Forecast, by DC Size 2019 & 2032
- Table 33: Global Phoenix Data Center Market Revenue Million Forecast, by Tier Type 2019 & 2032
- Table 34: Global Phoenix Data Center Market Revenue Million Forecast, by Absorption 2019 & 2032
- Table 35: Global Phoenix Data Center Market Revenue Million Forecast, by Country 2019 & 2032
- Table 36: United Kingdom Phoenix Data Center Market Revenue (Million) Forecast, by Application 2019 & 2032
- Table 37: Germany Phoenix Data Center Market Revenue (Million) Forecast, by Application 2019 & 2032
- Table 38: France Phoenix Data Center Market Revenue (Million) Forecast, by Application 2019 & 2032
- Table 39: Italy Phoenix Data Center Market Revenue (Million) Forecast, by Application 2019 & 2032
- Table 40: Spain Phoenix Data Center Market Revenue (Million) Forecast, by Application 2019 & 2032
- Table 41: Russia Phoenix Data Center Market Revenue (Million) Forecast, by Application 2019 & 2032
- Table 42: Benelux Phoenix Data Center Market Revenue (Million) Forecast, by Application 2019 & 2032
- Table 43: Nordics Phoenix Data Center Market Revenue (Million) Forecast, by Application 2019 & 2032
- Table 44: Rest of Europe Phoenix Data Center Market Revenue (Million) Forecast, by Application 2019 & 2032
- Table 45: Global Phoenix Data Center Market Revenue Million Forecast, by DC Size 2019 & 2032
- Table 46: Global Phoenix Data Center Market Revenue Million Forecast, by Tier Type 2019 & 2032
- Table 47: Global Phoenix Data Center Market Revenue Million Forecast, by Absorption 2019 & 2032
- Table 48: Global Phoenix Data Center Market Revenue Million Forecast, by Country 2019 & 2032
- Table 49: Turkey Phoenix Data Center Market Revenue (Million) Forecast, by Application 2019 & 2032
- Table 50: Israel Phoenix Data Center Market Revenue (Million) Forecast, by Application 2019 & 2032
- Table 51: GCC Phoenix Data Center Market Revenue (Million) Forecast, by Application 2019 & 2032
- Table 52: North Africa Phoenix Data Center Market Revenue (Million) Forecast, by Application 2019 & 2032
- Table 53: South Africa Phoenix Data Center Market Revenue (Million) Forecast, by Application 2019 & 2032
- Table 54: Rest of Middle East & Africa Phoenix Data Center Market Revenue (Million) Forecast, by Application 2019 & 2032
- Table 55: Global Phoenix Data Center Market Revenue Million Forecast, by DC Size 2019 & 2032
- Table 56: Global Phoenix Data Center Market Revenue Million Forecast, by Tier Type 2019 & 2032
- Table 57: Global Phoenix Data Center Market Revenue Million Forecast, by Absorption 2019 & 2032
- Table 58: Global Phoenix Data Center Market Revenue Million Forecast, by Country 2019 & 2032
- Table 59: China Phoenix Data Center Market Revenue (Million) Forecast, by Application 2019 & 2032
- Table 60: India Phoenix Data Center Market Revenue (Million) Forecast, by Application 2019 & 2032
- Table 61: Japan Phoenix Data Center Market Revenue (Million) Forecast, by Application 2019 & 2032
- Table 62: South Korea Phoenix Data Center Market Revenue (Million) Forecast, by Application 2019 & 2032
- Table 63: ASEAN Phoenix Data Center Market Revenue (Million) Forecast, by Application 2019 & 2032
- Table 64: Oceania Phoenix Data Center Market Revenue (Million) Forecast, by Application 2019 & 2032
- Table 65: Rest of Asia Pacific Phoenix Data Center Market Revenue (Million) Forecast, by Application 2019 & 2032
Frequently Asked Questions
1. What is the projected Compound Annual Growth Rate (CAGR) of the Phoenix Data Center Market?
The projected CAGR is approximately 18.50%.
2. Which companies are prominent players in the Phoenix Data Center Market?
Key companies in the market include Cyxtera Technologies Inc, EdgeConneX Inc , EdgeCore, PhoenixNAP, Iron Mountain, DataBank, Evocative, CyrusOne, Expedient, Flexential, Cogent, Evoque, Vantage Data Center, H5 Data centers, Digital Realty Trust Inc.
3. What are the main segments of the Phoenix Data Center Market?
The market segments include DC Size, Tier Type, Absorption.
4. Can you provide details about the market size?
The market size is estimated to be USD XX Million as of 2022.
5. What are some drivers contributing to market growth?
Growing Adoption of Cloud Services is expected to flourish the market; Increasing Growth in Wholesale Datacenter Multi-tenant Spaces to propel demand (albeit from a lower base); Increased Emphasis on Compliance with Data Regulations and Cost-Effective Nature of Multi-tenant Facilities to Drive Adoption among SME's.
6. What are the notable trends driving market growth?
Cloud computing is anticipated to hold a significant share.
7. Are there any restraints impacting market growth?
Dependence on Regulatory Landscape & Stringent Security Requirements.
8. Can you provide examples of recent developments in the market?
November 2022: STACK Infrastructure Plans Massive New Data Centre Campus in Downtown Phoenix. STACK Infrastructure will build a 230-megawatt campus with 1.78 million square feet of data centers, continuing the developer's global expansion. This 50-acre campus will help meet the demand for cloud capacity in the rapidly growing Phoenix market.
9. What pricing options are available for accessing the report?
Pricing options include single-user, multi-user, and enterprise licenses priced at USD 3800, USD 4500, and USD 5800 respectively.
10. Is the market size provided in terms of value or volume?
The market size is provided in terms of value, measured in Million.
11. Are there any specific market keywords associated with the report?
Yes, the market keyword associated with the report is "Phoenix Data Center Market," which aids in identifying and referencing the specific market segment covered.
12. How do I determine which pricing option suits my needs best?
The pricing options vary based on user requirements and access needs. Individual users may opt for single-user licenses, while businesses requiring broader access may choose multi-user or enterprise licenses for cost-effective access to the report.
13. Are there any additional resources or data provided in the Phoenix Data Center Market report?
While the report offers comprehensive insights, it's advisable to review the specific contents or supplementary materials provided to ascertain if additional resources or data are available.
14. How can I stay updated on further developments or reports in the Phoenix Data Center Market?
To stay informed about further developments, trends, and reports in the Phoenix Data Center Market, consider subscribing to industry newsletters, following relevant companies and organizations, or regularly checking reputable industry news sources and publications.
Methodology
Step 1 - Identification of Relevant Samples Size from Population Database


Step 2 - Approaches for Defining Global Market Size (Value, Volume* & Price*)

Note*: In applicable scenarios
Step 3 - Data Sources
Primary Research
- Web Analytics
- Survey Reports
- Research Institute
- Latest Research Reports
- Opinion Leaders
Secondary Research
- Annual Reports
- White Paper
- Latest Press Release
- Industry Association
- Paid Database
- Investor Presentations

Step 4 - Data Triangulation
Involves using different sources of information in order to increase the validity of a study
These sources are likely to be stakeholders in a program - participants, other researchers, program staff, other community members, and so on.
Then we put all data in single framework & apply various statistical tools to find out the dynamic on the market.
During the analysis stage, feedback from the stakeholder groups would be compared to determine areas of agreement as well as areas of divergence


