
Key Insights
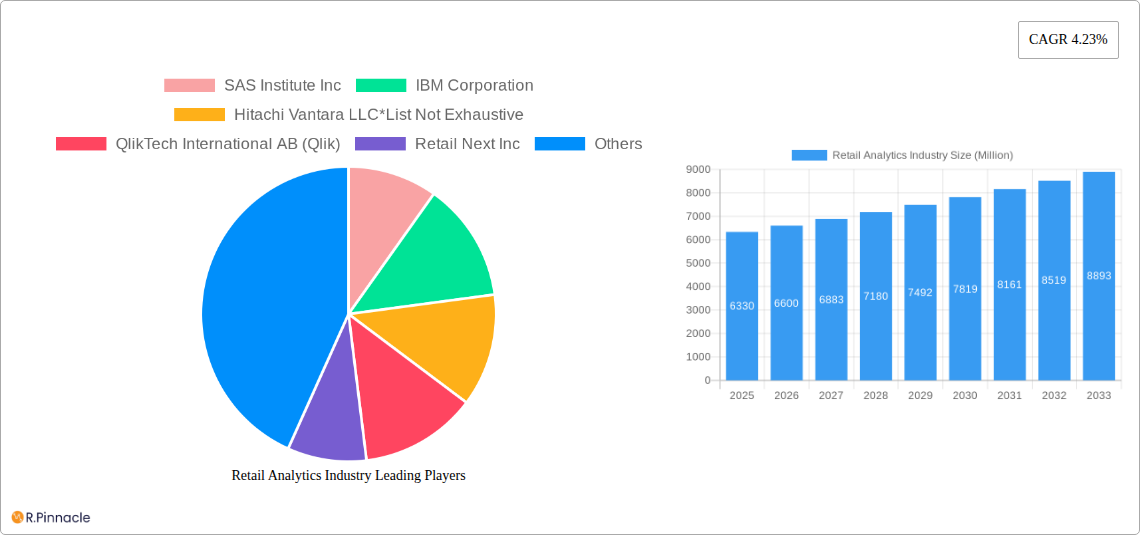
The retail analytics market, valued at $6.33 billion in 2025, is projected to experience robust growth, driven by the increasing need for data-driven decision-making within the retail sector. A compound annual growth rate (CAGR) of 4.23% from 2025 to 2033 indicates a significant expansion in market size over the forecast period. This growth is fueled by several key factors. The adoption of cloud-based solutions is accelerating, offering retailers enhanced scalability, flexibility, and cost-effectiveness in data analysis. Simultaneously, the increasing sophistication of analytics techniques, such as predictive modeling and AI-powered insights, allows retailers to optimize pricing strategies, enhance customer experiences, and streamline supply chain operations. Furthermore, the rise of omnichannel retailing necessitates robust analytics capabilities to integrate and analyze data from diverse sources, improving inventory management, personalized marketing, and overall operational efficiency. The market segmentation reveals a strong demand across various functions, with customer management, in-store operations (inventory and performance management), and supply chain management leading the way.
The competitive landscape is characterized by a mix of established technology providers and specialized retail analytics companies. Major players like SAS, IBM, and Oracle compete alongside more focused vendors offering niche solutions. While North America currently holds a significant market share, regions like Asia-Pacific are poised for accelerated growth, driven by the expansion of e-commerce and rising digital adoption. The continued emphasis on personalized customer experiences, optimized pricing strategies, and efficient supply chain management will further propel market expansion. Challenges such as data security concerns, the need for skilled analytical talent, and the complexity of integrating diverse data sources present opportunities for innovative solutions and specialized service providers to emerge and capture market share. The overall outlook for the retail analytics market remains positive, suggesting sustained growth and innovation in the coming years.
Retail Analytics Industry Market Report: 2019-2033
This comprehensive report provides a detailed analysis of the Retail Analytics Industry, covering market size, growth drivers, competitive landscape, and future outlook. The study period spans from 2019 to 2033, with 2025 serving as the base and estimated year. The forecast period is 2025-2033, and the historical period encompasses 2019-2024. This report is essential for industry professionals, investors, and businesses seeking to understand and capitalize on opportunities within this rapidly evolving market. The global market size is projected to reach xx Million by 2033.
Retail Analytics Industry Market Structure & Innovation Trends
The Retail Analytics market is characterized by a moderately concentrated structure, with key players like SAS Institute Inc, IBM Corporation, Hitachi Vantara LLC, QlikTech International AB (Qlik), Retail Next Inc, Altair Engineering Inc, Alteryx Inc, Oracle Corporation, Salesforce com Inc (Tableau Software Inc), and SAP SE holding significant market share. However, the market also exhibits considerable fragmentation due to the emergence of numerous niche players and startups.
- Market Concentration: The top 5 players collectively hold an estimated xx% market share in 2025, indicating a moderately consolidated market.
- Innovation Drivers: Advancements in AI, machine learning, big data analytics, and cloud computing are driving significant innovation within the industry. The increasing adoption of omnichannel strategies by retailers is also fueling demand for sophisticated analytics solutions.
- Regulatory Frameworks: Data privacy regulations like GDPR and CCPA are significantly influencing the development and deployment of retail analytics solutions. Compliance requirements are driving investments in secure and ethical data handling practices.
- Product Substitutes: While specialized retail analytics solutions offer unique advantages, businesses might use generic business intelligence tools as substitutes, albeit with limitations. This competitive pressure drives innovation in specialized solutions.
- End-User Demographics: The primary end-users include large retailers, e-commerce businesses, and mid-sized retail chains across various sectors. The adoption rate is highest among larger companies with extensive data needs.
- M&A Activities: The industry has witnessed several significant mergers and acquisitions in recent years, with deal values ranging from xx Million to xx Million. These activities reflect the increasing consolidation and strategic expansion within the sector. For example, the xx Million acquisition of Company X by Company Y in 2024 reshaped the competitive landscape.
Retail Analytics Industry Market Dynamics & Trends
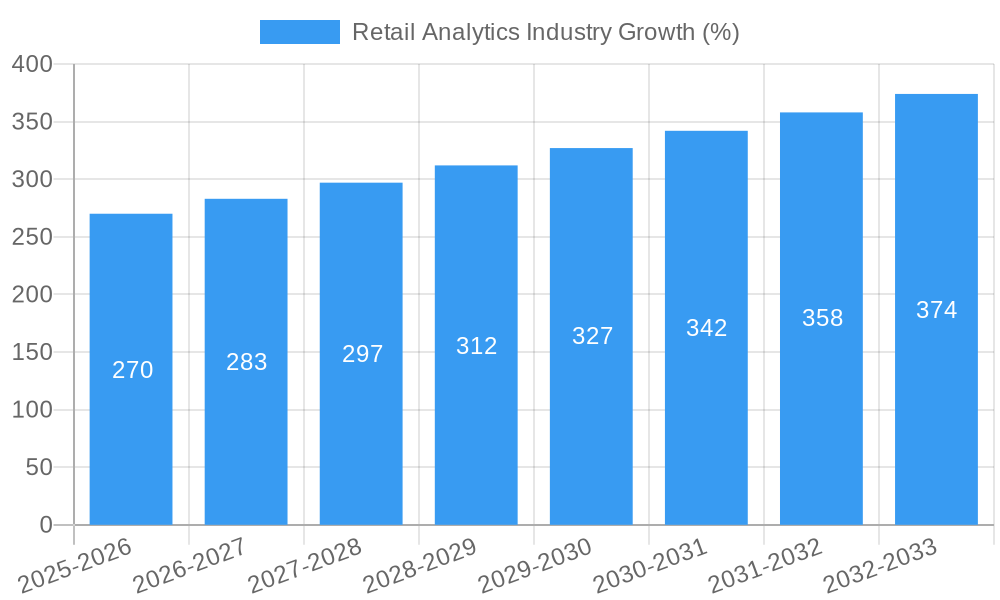
The Retail Analytics market is experiencing robust growth, driven by the increasing adoption of data-driven decision-making by retailers. This trend is further amplified by the rapid expansion of e-commerce, the proliferation of consumer data, and the growing need for personalized customer experiences. The market is expected to exhibit a Compound Annual Growth Rate (CAGR) of xx% during the forecast period (2025-2033). Market penetration in key regions is expected to increase from xx% in 2025 to xx% by 2033.
Technological disruptions, such as the rise of artificial intelligence (AI) and the Internet of Things (IoT), are transforming the retail landscape and creating new opportunities for retail analytics solutions. Consumers are increasingly demanding personalized experiences, which necessitates the use of advanced analytics tools to understand and cater to individual preferences. The competitive dynamics are intense, with established players and new entrants constantly striving to improve their offerings and expand their market share.
Dominant Regions & Segments in Retail Analytics Industry
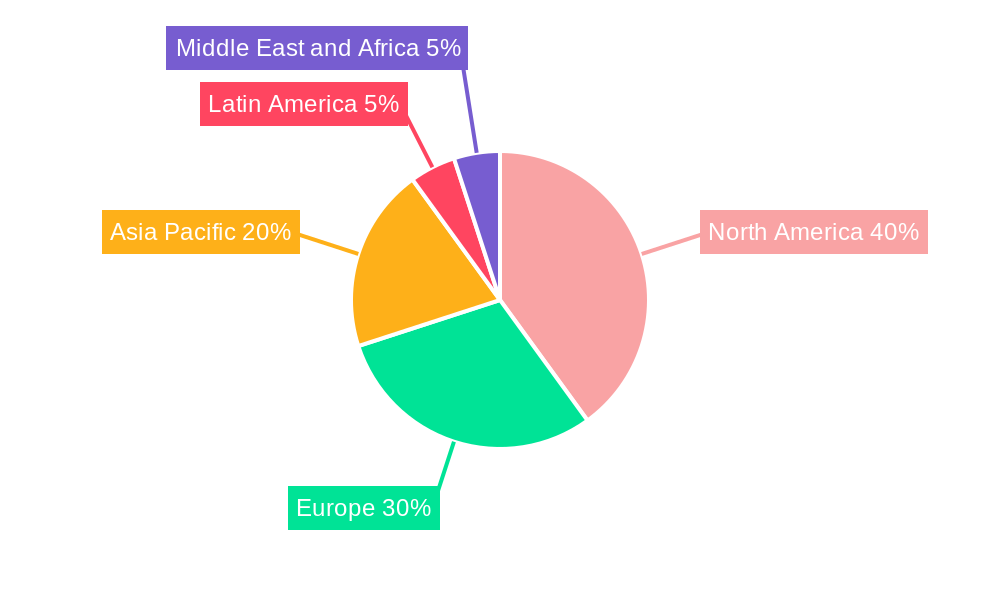
The North American region is currently the dominant market for retail analytics, driven by high technology adoption rates, advanced infrastructure, and the presence of major players. However, Asia-Pacific is expected to witness the fastest growth during the forecast period, driven by the burgeoning e-commerce market and increasing digitalization across the region.
Key Drivers:
- North America: Strong technological infrastructure, high adoption rate of advanced analytics, and presence of major players.
- Asia-Pacific: Rapid growth of e-commerce, increasing digitalization, and favorable government policies.
- Europe: Growing adoption of data-driven decision-making and stringent data privacy regulations.
Segment Dominance:
- By Solution: The Software segment currently holds a larger market share than the Service segment, driven by the ease of implementation and scalability of software solutions. However, the Service segment is expected to exhibit faster growth due to the increasing demand for specialized expertise and customization.
- By Deployment: Cloud-based solutions are gaining rapid traction, driven by their cost-effectiveness, scalability, and ease of access. However, on-premise solutions still maintain a significant market share due to concerns about data security and integration with existing systems.
- By Function: Customer Management and In-store operations (Inventory and Performance Management) are the largest segments, reflecting the growing emphasis on personalized customer experiences and optimized store operations. Supply chain management is also a significant and growing segment.
Retail Analytics Industry Product Innovations
Recent product innovations are focusing on enhanced AI capabilities, predictive analytics, and improved integration with other retail systems. The development of cloud-based, scalable solutions is also a major trend. These new products offer improved accuracy, efficiency, and decision-making capabilities, leading to increased customer satisfaction and cost savings.
Report Scope & Segmentation Analysis
This report provides a comprehensive analysis of the Retail Analytics market, segmented by solution (software and service), deployment (cloud and on-premise), and function (customer management, in-store operations, supply chain management, marketing and merchandising, and other functions). Each segment is analyzed based on market size, growth projections, and competitive dynamics. For example, the customer management segment is projected to grow at a CAGR of xx%, while the supply chain management segment is projected to grow at xx%. The competitive landscape varies across segments, with some segments characterized by intense competition and others with greater opportunities for new entrants.
Key Drivers of Retail Analytics Industry Growth
The Retail Analytics industry is driven by several key factors, including the proliferation of big data, the rising adoption of omnichannel retailing, and the growing need for personalized customer experiences. Advancements in AI and machine learning are also significant contributors, enabling more sophisticated analytics and improved decision-making. Government initiatives promoting digitalization are further accelerating market growth.
Challenges in the Retail Analytics Industry Sector
The Retail Analytics industry faces several challenges, including data security concerns, the complexity of integrating diverse data sources, and the high cost of implementing advanced analytics solutions. The shortage of skilled professionals and the need for constant updates to keep up with technological advancements represent further barriers. The impact of these challenges on market growth is estimated at xx Million annually.
Emerging Opportunities in Retail Analytics Industry
Emerging opportunities lie in areas such as predictive maintenance, personalized pricing strategies, and the use of AI-powered chatbots for customer service. Expansion into emerging markets and the integration of new technologies, such as blockchain and IoT, represent further opportunities for growth.
Leading Players in the Retail Analytics Industry Market
- SAS Institute Inc
- IBM Corporation
- Hitachi Vantara LLC
- QlikTech International AB (Qlik)
- Retail Next Inc
- Altair Engineering Inc
- Alteryx Inc
- Oracle Corporation
- Salesforce com Inc (Tableau Software Inc)
- SAP SE
Key Developments in Retail Analytics Industry
- September 2023: Priority Software acquired Retailsoft, expanding its retail management product offerings and integrating solutions for enhanced efficiency and revenue growth. This acquisition significantly impacted market dynamics by strengthening Priority Software's position and offering retailers a more comprehensive suite of solutions.
- January 2023: AiFi partnered with Microsoft to launch Smart Store Analytics, a cloud service providing retailers with enhanced shopper and operational analytics for autonomous stores. This collaboration marked a significant development in the application of AI and cloud technologies within the retail analytics sector.
Future Outlook for Retail Analytics Industry Market
The Retail Analytics market is poised for continued strong growth, driven by ongoing technological advancements and the increasing adoption of data-driven decision-making across the retail sector. The growing demand for personalized customer experiences and the expansion of e-commerce will further fuel market expansion, creating significant opportunities for businesses in this sector. Strategic partnerships and further innovations in AI and machine learning will continue shaping the future landscape.
Retail Analytics Industry Segmentation
-
1. Solution
- 1.1. Software
- 1.2. Service
-
2. Deployment
- 2.1. Cloud
- 2.2. On-premise
-
3. Function
- 3.1. Customer Management
- 3.2. In-store
- 3.3. Supply Chain Management
- 3.4. Marketin
- 3.5. Other Fu
Retail Analytics Industry Segmentation By Geography
-
1. North America
- 1.1. United States
- 1.2. Canada
-
2. Europe
- 2.1. Germany
- 2.2. United Kingdom
- 2.3. France
- 2.4. Russia
- 2.5. Rest of Europe
-
3. Asia Pacific
- 3.1. China
- 3.2. Japan
- 3.3. India
- 3.4. Rest of Asia Pacific
- 4. Latin America
- 5. Middle East and Africa
Retail Analytics Industry REPORT HIGHLIGHTS
| Aspects | Details |
|---|---|
| Study Period | 2019-2033 |
| Base Year | 2024 |
| Estimated Year | 2025 |
| Forecast Period | 2025-2033 |
| Historical Period | 2019-2024 |
| Growth Rate | CAGR of 4.23% from 2019-2033 |
| Segmentation |
|
Table of Contents
- 1. Introduction
- 1.1. Research Scope
- 1.2. Market Segmentation
- 1.3. Research Methodology
- 1.4. Definitions and Assumptions
- 2. Executive Summary
- 2.1. Introduction
- 3. Market Dynamics
- 3.1. Introduction
- 3.2. Market Drivers
- 3.2.1. Increasing Volumes of Data and Technological Advancements in AI and AR/VR; Increasing E-retail Sales
- 3.3. Market Restrains
- 3.3.1. Lack of General Awareness and Expertise in Emerging Regions; Standardization and Integration Issues
- 3.4. Market Trends
- 3.4.1. In-store Operation Hold Major Share
- 4. Market Factor Analysis
- 4.1. Porters Five Forces
- 4.2. Supply/Value Chain
- 4.3. PESTEL analysis
- 4.4. Market Entropy
- 4.5. Patent/Trademark Analysis
- 5. Global Retail Analytics Industry Analysis, Insights and Forecast, 2019-2031
- 5.1. Market Analysis, Insights and Forecast - by Solution
- 5.1.1. Software
- 5.1.2. Service
- 5.2. Market Analysis, Insights and Forecast - by Deployment
- 5.2.1. Cloud
- 5.2.2. On-premise
- 5.3. Market Analysis, Insights and Forecast - by Function
- 5.3.1. Customer Management
- 5.3.2. In-store
- 5.3.3. Supply Chain Management
- 5.3.4. Marketin
- 5.3.5. Other Fu
- 5.4. Market Analysis, Insights and Forecast - by Region
- 5.4.1. North America
- 5.4.2. Europe
- 5.4.3. Asia Pacific
- 5.4.4. Latin America
- 5.4.5. Middle East and Africa
- 5.1. Market Analysis, Insights and Forecast - by Solution
- 6. North America Retail Analytics Industry Analysis, Insights and Forecast, 2019-2031
- 6.1. Market Analysis, Insights and Forecast - by Solution
- 6.1.1. Software
- 6.1.2. Service
- 6.2. Market Analysis, Insights and Forecast - by Deployment
- 6.2.1. Cloud
- 6.2.2. On-premise
- 6.3. Market Analysis, Insights and Forecast - by Function
- 6.3.1. Customer Management
- 6.3.2. In-store
- 6.3.3. Supply Chain Management
- 6.3.4. Marketin
- 6.3.5. Other Fu
- 6.1. Market Analysis, Insights and Forecast - by Solution
- 7. Europe Retail Analytics Industry Analysis, Insights and Forecast, 2019-2031
- 7.1. Market Analysis, Insights and Forecast - by Solution
- 7.1.1. Software
- 7.1.2. Service
- 7.2. Market Analysis, Insights and Forecast - by Deployment
- 7.2.1. Cloud
- 7.2.2. On-premise
- 7.3. Market Analysis, Insights and Forecast - by Function
- 7.3.1. Customer Management
- 7.3.2. In-store
- 7.3.3. Supply Chain Management
- 7.3.4. Marketin
- 7.3.5. Other Fu
- 7.1. Market Analysis, Insights and Forecast - by Solution
- 8. Asia Pacific Retail Analytics Industry Analysis, Insights and Forecast, 2019-2031
- 8.1. Market Analysis, Insights and Forecast - by Solution
- 8.1.1. Software
- 8.1.2. Service
- 8.2. Market Analysis, Insights and Forecast - by Deployment
- 8.2.1. Cloud
- 8.2.2. On-premise
- 8.3. Market Analysis, Insights and Forecast - by Function
- 8.3.1. Customer Management
- 8.3.2. In-store
- 8.3.3. Supply Chain Management
- 8.3.4. Marketin
- 8.3.5. Other Fu
- 8.1. Market Analysis, Insights and Forecast - by Solution
- 9. Latin America Retail Analytics Industry Analysis, Insights and Forecast, 2019-2031
- 9.1. Market Analysis, Insights and Forecast - by Solution
- 9.1.1. Software
- 9.1.2. Service
- 9.2. Market Analysis, Insights and Forecast - by Deployment
- 9.2.1. Cloud
- 9.2.2. On-premise
- 9.3. Market Analysis, Insights and Forecast - by Function
- 9.3.1. Customer Management
- 9.3.2. In-store
- 9.3.3. Supply Chain Management
- 9.3.4. Marketin
- 9.3.5. Other Fu
- 9.1. Market Analysis, Insights and Forecast - by Solution
- 10. Middle East and Africa Retail Analytics Industry Analysis, Insights and Forecast, 2019-2031
- 10.1. Market Analysis, Insights and Forecast - by Solution
- 10.1.1. Software
- 10.1.2. Service
- 10.2. Market Analysis, Insights and Forecast - by Deployment
- 10.2.1. Cloud
- 10.2.2. On-premise
- 10.3. Market Analysis, Insights and Forecast - by Function
- 10.3.1. Customer Management
- 10.3.2. In-store
- 10.3.3. Supply Chain Management
- 10.3.4. Marketin
- 10.3.5. Other Fu
- 10.1. Market Analysis, Insights and Forecast - by Solution
- 11. North America Retail Analytics Industry Analysis, Insights and Forecast, 2019-2031
- 11.1. Market Analysis, Insights and Forecast - By Country/Sub-region
- 11.1.1 United States
- 11.1.2 Canada
- 12. Europe Retail Analytics Industry Analysis, Insights and Forecast, 2019-2031
- 12.1. Market Analysis, Insights and Forecast - By Country/Sub-region
- 12.1.1 Germany
- 12.1.2 United Kingdom
- 12.1.3 France
- 12.1.4 Russia
- 12.1.5 Rest of Europe
- 13. Asia Pacific Retail Analytics Industry Analysis, Insights and Forecast, 2019-2031
- 13.1. Market Analysis, Insights and Forecast - By Country/Sub-region
- 13.1.1 China
- 13.1.2 Japan
- 13.1.3 India
- 13.1.4 Rest of Asia Pacific
- 14. Latin America Retail Analytics Industry Analysis, Insights and Forecast, 2019-2031
- 14.1. Market Analysis, Insights and Forecast - By Country/Sub-region
- 14.1.1.
- 15. Middle East and Africa Retail Analytics Industry Analysis, Insights and Forecast, 2019-2031
- 15.1. Market Analysis, Insights and Forecast - By Country/Sub-region
- 15.1.1.
- 16. Competitive Analysis
- 16.1. Global Market Share Analysis 2024
- 16.2. Company Profiles
- 16.2.1 SAS Institute Inc
- 16.2.1.1. Overview
- 16.2.1.2. Products
- 16.2.1.3. SWOT Analysis
- 16.2.1.4. Recent Developments
- 16.2.1.5. Financials (Based on Availability)
- 16.2.2 IBM Corporation
- 16.2.2.1. Overview
- 16.2.2.2. Products
- 16.2.2.3. SWOT Analysis
- 16.2.2.4. Recent Developments
- 16.2.2.5. Financials (Based on Availability)
- 16.2.3 Hitachi Vantara LLC*List Not Exhaustive
- 16.2.3.1. Overview
- 16.2.3.2. Products
- 16.2.3.3. SWOT Analysis
- 16.2.3.4. Recent Developments
- 16.2.3.5. Financials (Based on Availability)
- 16.2.4 QlikTech International AB (Qlik)
- 16.2.4.1. Overview
- 16.2.4.2. Products
- 16.2.4.3. SWOT Analysis
- 16.2.4.4. Recent Developments
- 16.2.4.5. Financials (Based on Availability)
- 16.2.5 Retail Next Inc
- 16.2.5.1. Overview
- 16.2.5.2. Products
- 16.2.5.3. SWOT Analysis
- 16.2.5.4. Recent Developments
- 16.2.5.5. Financials (Based on Availability)
- 16.2.6 Altair Engineering Inc
- 16.2.6.1. Overview
- 16.2.6.2. Products
- 16.2.6.3. SWOT Analysis
- 16.2.6.4. Recent Developments
- 16.2.6.5. Financials (Based on Availability)
- 16.2.7 Alteryx Inc
- 16.2.7.1. Overview
- 16.2.7.2. Products
- 16.2.7.3. SWOT Analysis
- 16.2.7.4. Recent Developments
- 16.2.7.5. Financials (Based on Availability)
- 16.2.8 Oracle Corporation
- 16.2.8.1. Overview
- 16.2.8.2. Products
- 16.2.8.3. SWOT Analysis
- 16.2.8.4. Recent Developments
- 16.2.8.5. Financials (Based on Availability)
- 16.2.9 Salesforce com Inc (Tableau Software Inc )
- 16.2.9.1. Overview
- 16.2.9.2. Products
- 16.2.9.3. SWOT Analysis
- 16.2.9.4. Recent Developments
- 16.2.9.5. Financials (Based on Availability)
- 16.2.10 SAP SE
- 16.2.10.1. Overview
- 16.2.10.2. Products
- 16.2.10.3. SWOT Analysis
- 16.2.10.4. Recent Developments
- 16.2.10.5. Financials (Based on Availability)
- 16.2.1 SAS Institute Inc
List of Figures
- Figure 1: Global Retail Analytics Industry Revenue Breakdown (Million, %) by Region 2024 & 2032
- Figure 2: North America Retail Analytics Industry Revenue (Million), by Country 2024 & 2032
- Figure 3: North America Retail Analytics Industry Revenue Share (%), by Country 2024 & 2032
- Figure 4: Europe Retail Analytics Industry Revenue (Million), by Country 2024 & 2032
- Figure 5: Europe Retail Analytics Industry Revenue Share (%), by Country 2024 & 2032
- Figure 6: Asia Pacific Retail Analytics Industry Revenue (Million), by Country 2024 & 2032
- Figure 7: Asia Pacific Retail Analytics Industry Revenue Share (%), by Country 2024 & 2032
- Figure 8: Latin America Retail Analytics Industry Revenue (Million), by Country 2024 & 2032
- Figure 9: Latin America Retail Analytics Industry Revenue Share (%), by Country 2024 & 2032
- Figure 10: Middle East and Africa Retail Analytics Industry Revenue (Million), by Country 2024 & 2032
- Figure 11: Middle East and Africa Retail Analytics Industry Revenue Share (%), by Country 2024 & 2032
- Figure 12: North America Retail Analytics Industry Revenue (Million), by Solution 2024 & 2032
- Figure 13: North America Retail Analytics Industry Revenue Share (%), by Solution 2024 & 2032
- Figure 14: North America Retail Analytics Industry Revenue (Million), by Deployment 2024 & 2032
- Figure 15: North America Retail Analytics Industry Revenue Share (%), by Deployment 2024 & 2032
- Figure 16: North America Retail Analytics Industry Revenue (Million), by Function 2024 & 2032
- Figure 17: North America Retail Analytics Industry Revenue Share (%), by Function 2024 & 2032
- Figure 18: North America Retail Analytics Industry Revenue (Million), by Country 2024 & 2032
- Figure 19: North America Retail Analytics Industry Revenue Share (%), by Country 2024 & 2032
- Figure 20: Europe Retail Analytics Industry Revenue (Million), by Solution 2024 & 2032
- Figure 21: Europe Retail Analytics Industry Revenue Share (%), by Solution 2024 & 2032
- Figure 22: Europe Retail Analytics Industry Revenue (Million), by Deployment 2024 & 2032
- Figure 23: Europe Retail Analytics Industry Revenue Share (%), by Deployment 2024 & 2032
- Figure 24: Europe Retail Analytics Industry Revenue (Million), by Function 2024 & 2032
- Figure 25: Europe Retail Analytics Industry Revenue Share (%), by Function 2024 & 2032
- Figure 26: Europe Retail Analytics Industry Revenue (Million), by Country 2024 & 2032
- Figure 27: Europe Retail Analytics Industry Revenue Share (%), by Country 2024 & 2032
- Figure 28: Asia Pacific Retail Analytics Industry Revenue (Million), by Solution 2024 & 2032
- Figure 29: Asia Pacific Retail Analytics Industry Revenue Share (%), by Solution 2024 & 2032
- Figure 30: Asia Pacific Retail Analytics Industry Revenue (Million), by Deployment 2024 & 2032
- Figure 31: Asia Pacific Retail Analytics Industry Revenue Share (%), by Deployment 2024 & 2032
- Figure 32: Asia Pacific Retail Analytics Industry Revenue (Million), by Function 2024 & 2032
- Figure 33: Asia Pacific Retail Analytics Industry Revenue Share (%), by Function 2024 & 2032
- Figure 34: Asia Pacific Retail Analytics Industry Revenue (Million), by Country 2024 & 2032
- Figure 35: Asia Pacific Retail Analytics Industry Revenue Share (%), by Country 2024 & 2032
- Figure 36: Latin America Retail Analytics Industry Revenue (Million), by Solution 2024 & 2032
- Figure 37: Latin America Retail Analytics Industry Revenue Share (%), by Solution 2024 & 2032
- Figure 38: Latin America Retail Analytics Industry Revenue (Million), by Deployment 2024 & 2032
- Figure 39: Latin America Retail Analytics Industry Revenue Share (%), by Deployment 2024 & 2032
- Figure 40: Latin America Retail Analytics Industry Revenue (Million), by Function 2024 & 2032
- Figure 41: Latin America Retail Analytics Industry Revenue Share (%), by Function 2024 & 2032
- Figure 42: Latin America Retail Analytics Industry Revenue (Million), by Country 2024 & 2032
- Figure 43: Latin America Retail Analytics Industry Revenue Share (%), by Country 2024 & 2032
- Figure 44: Middle East and Africa Retail Analytics Industry Revenue (Million), by Solution 2024 & 2032
- Figure 45: Middle East and Africa Retail Analytics Industry Revenue Share (%), by Solution 2024 & 2032
- Figure 46: Middle East and Africa Retail Analytics Industry Revenue (Million), by Deployment 2024 & 2032
- Figure 47: Middle East and Africa Retail Analytics Industry Revenue Share (%), by Deployment 2024 & 2032
- Figure 48: Middle East and Africa Retail Analytics Industry Revenue (Million), by Function 2024 & 2032
- Figure 49: Middle East and Africa Retail Analytics Industry Revenue Share (%), by Function 2024 & 2032
- Figure 50: Middle East and Africa Retail Analytics Industry Revenue (Million), by Country 2024 & 2032
- Figure 51: Middle East and Africa Retail Analytics Industry Revenue Share (%), by Country 2024 & 2032
List of Tables
- Table 1: Global Retail Analytics Industry Revenue Million Forecast, by Region 2019 & 2032
- Table 2: Global Retail Analytics Industry Revenue Million Forecast, by Solution 2019 & 2032
- Table 3: Global Retail Analytics Industry Revenue Million Forecast, by Deployment 2019 & 2032
- Table 4: Global Retail Analytics Industry Revenue Million Forecast, by Function 2019 & 2032
- Table 5: Global Retail Analytics Industry Revenue Million Forecast, by Region 2019 & 2032
- Table 6: Global Retail Analytics Industry Revenue Million Forecast, by Country 2019 & 2032
- Table 7: United States Retail Analytics Industry Revenue (Million) Forecast, by Application 2019 & 2032
- Table 8: Canada Retail Analytics Industry Revenue (Million) Forecast, by Application 2019 & 2032
- Table 9: Global Retail Analytics Industry Revenue Million Forecast, by Country 2019 & 2032
- Table 10: Germany Retail Analytics Industry Revenue (Million) Forecast, by Application 2019 & 2032
- Table 11: United Kingdom Retail Analytics Industry Revenue (Million) Forecast, by Application 2019 & 2032
- Table 12: France Retail Analytics Industry Revenue (Million) Forecast, by Application 2019 & 2032
- Table 13: Russia Retail Analytics Industry Revenue (Million) Forecast, by Application 2019 & 2032
- Table 14: Rest of Europe Retail Analytics Industry Revenue (Million) Forecast, by Application 2019 & 2032
- Table 15: Global Retail Analytics Industry Revenue Million Forecast, by Country 2019 & 2032
- Table 16: China Retail Analytics Industry Revenue (Million) Forecast, by Application 2019 & 2032
- Table 17: Japan Retail Analytics Industry Revenue (Million) Forecast, by Application 2019 & 2032
- Table 18: India Retail Analytics Industry Revenue (Million) Forecast, by Application 2019 & 2032
- Table 19: Rest of Asia Pacific Retail Analytics Industry Revenue (Million) Forecast, by Application 2019 & 2032
- Table 20: Global Retail Analytics Industry Revenue Million Forecast, by Country 2019 & 2032
- Table 21: Retail Analytics Industry Revenue (Million) Forecast, by Application 2019 & 2032
- Table 22: Global Retail Analytics Industry Revenue Million Forecast, by Country 2019 & 2032
- Table 23: Retail Analytics Industry Revenue (Million) Forecast, by Application 2019 & 2032
- Table 24: Global Retail Analytics Industry Revenue Million Forecast, by Solution 2019 & 2032
- Table 25: Global Retail Analytics Industry Revenue Million Forecast, by Deployment 2019 & 2032
- Table 26: Global Retail Analytics Industry Revenue Million Forecast, by Function 2019 & 2032
- Table 27: Global Retail Analytics Industry Revenue Million Forecast, by Country 2019 & 2032
- Table 28: United States Retail Analytics Industry Revenue (Million) Forecast, by Application 2019 & 2032
- Table 29: Canada Retail Analytics Industry Revenue (Million) Forecast, by Application 2019 & 2032
- Table 30: Global Retail Analytics Industry Revenue Million Forecast, by Solution 2019 & 2032
- Table 31: Global Retail Analytics Industry Revenue Million Forecast, by Deployment 2019 & 2032
- Table 32: Global Retail Analytics Industry Revenue Million Forecast, by Function 2019 & 2032
- Table 33: Global Retail Analytics Industry Revenue Million Forecast, by Country 2019 & 2032
- Table 34: Germany Retail Analytics Industry Revenue (Million) Forecast, by Application 2019 & 2032
- Table 35: United Kingdom Retail Analytics Industry Revenue (Million) Forecast, by Application 2019 & 2032
- Table 36: France Retail Analytics Industry Revenue (Million) Forecast, by Application 2019 & 2032
- Table 37: Russia Retail Analytics Industry Revenue (Million) Forecast, by Application 2019 & 2032
- Table 38: Rest of Europe Retail Analytics Industry Revenue (Million) Forecast, by Application 2019 & 2032
- Table 39: Global Retail Analytics Industry Revenue Million Forecast, by Solution 2019 & 2032
- Table 40: Global Retail Analytics Industry Revenue Million Forecast, by Deployment 2019 & 2032
- Table 41: Global Retail Analytics Industry Revenue Million Forecast, by Function 2019 & 2032
- Table 42: Global Retail Analytics Industry Revenue Million Forecast, by Country 2019 & 2032
- Table 43: China Retail Analytics Industry Revenue (Million) Forecast, by Application 2019 & 2032
- Table 44: Japan Retail Analytics Industry Revenue (Million) Forecast, by Application 2019 & 2032
- Table 45: India Retail Analytics Industry Revenue (Million) Forecast, by Application 2019 & 2032
- Table 46: Rest of Asia Pacific Retail Analytics Industry Revenue (Million) Forecast, by Application 2019 & 2032
- Table 47: Global Retail Analytics Industry Revenue Million Forecast, by Solution 2019 & 2032
- Table 48: Global Retail Analytics Industry Revenue Million Forecast, by Deployment 2019 & 2032
- Table 49: Global Retail Analytics Industry Revenue Million Forecast, by Function 2019 & 2032
- Table 50: Global Retail Analytics Industry Revenue Million Forecast, by Country 2019 & 2032
- Table 51: Global Retail Analytics Industry Revenue Million Forecast, by Solution 2019 & 2032
- Table 52: Global Retail Analytics Industry Revenue Million Forecast, by Deployment 2019 & 2032
- Table 53: Global Retail Analytics Industry Revenue Million Forecast, by Function 2019 & 2032
- Table 54: Global Retail Analytics Industry Revenue Million Forecast, by Country 2019 & 2032
Frequently Asked Questions
1. What is the projected Compound Annual Growth Rate (CAGR) of the Retail Analytics Industry?
The projected CAGR is approximately 4.23%.
2. Which companies are prominent players in the Retail Analytics Industry?
Key companies in the market include SAS Institute Inc, IBM Corporation, Hitachi Vantara LLC*List Not Exhaustive, QlikTech International AB (Qlik), Retail Next Inc, Altair Engineering Inc, Alteryx Inc, Oracle Corporation, Salesforce com Inc (Tableau Software Inc ), SAP SE.
3. What are the main segments of the Retail Analytics Industry?
The market segments include Solution, Deployment, Function.
4. Can you provide details about the market size?
The market size is estimated to be USD 6.33 Million as of 2022.
5. What are some drivers contributing to market growth?
Increasing Volumes of Data and Technological Advancements in AI and AR/VR; Increasing E-retail Sales.
6. What are the notable trends driving market growth?
In-store Operation Hold Major Share.
7. Are there any restraints impacting market growth?
Lack of General Awareness and Expertise in Emerging Regions; Standardization and Integration Issues.
8. Can you provide examples of recent developments in the market?
September 2023 - Priority Software acquired Retailsoft, a developer of innovative technology solutions for optimizing retail business efficiency and enhancing revenue growth. In addition, Priority is expanding the scope of its Retail Management Products and delivering significant value to Retailers by integrating Retailsoft's solutions. Retailsoft provides a dynamic platform with operational modules tailored to each organization's needs. These modules comprise work scheduling, communication tools, objective setting, and real-time access to POS data across all locations. Such features empower businesses with trend analysis, monitoring, and strategy optimization, facilitating data-driven decisions, sales goal setting, and fostering competition among branches.
9. What pricing options are available for accessing the report?
Pricing options include single-user, multi-user, and enterprise licenses priced at USD 4750, USD 5250, and USD 8750 respectively.
10. Is the market size provided in terms of value or volume?
The market size is provided in terms of value, measured in Million.
11. Are there any specific market keywords associated with the report?
Yes, the market keyword associated with the report is "Retail Analytics Industry," which aids in identifying and referencing the specific market segment covered.
12. How do I determine which pricing option suits my needs best?
The pricing options vary based on user requirements and access needs. Individual users may opt for single-user licenses, while businesses requiring broader access may choose multi-user or enterprise licenses for cost-effective access to the report.
13. Are there any additional resources or data provided in the Retail Analytics Industry report?
While the report offers comprehensive insights, it's advisable to review the specific contents or supplementary materials provided to ascertain if additional resources or data are available.
14. How can I stay updated on further developments or reports in the Retail Analytics Industry?
To stay informed about further developments, trends, and reports in the Retail Analytics Industry, consider subscribing to industry newsletters, following relevant companies and organizations, or regularly checking reputable industry news sources and publications.
Methodology
Step 1 - Identification of Relevant Samples Size from Population Database


Step 2 - Approaches for Defining Global Market Size (Value, Volume* & Price*)

Note*: In applicable scenarios
Step 3 - Data Sources
Primary Research
- Web Analytics
- Survey Reports
- Research Institute
- Latest Research Reports
- Opinion Leaders
Secondary Research
- Annual Reports
- White Paper
- Latest Press Release
- Industry Association
- Paid Database
- Investor Presentations

Step 4 - Data Triangulation
Involves using different sources of information in order to increase the validity of a study
These sources are likely to be stakeholders in a program - participants, other researchers, program staff, other community members, and so on.
Then we put all data in single framework & apply various statistical tools to find out the dynamic on the market.
During the analysis stage, feedback from the stakeholder groups would be compared to determine areas of agreement as well as areas of divergence


