
Key Insights
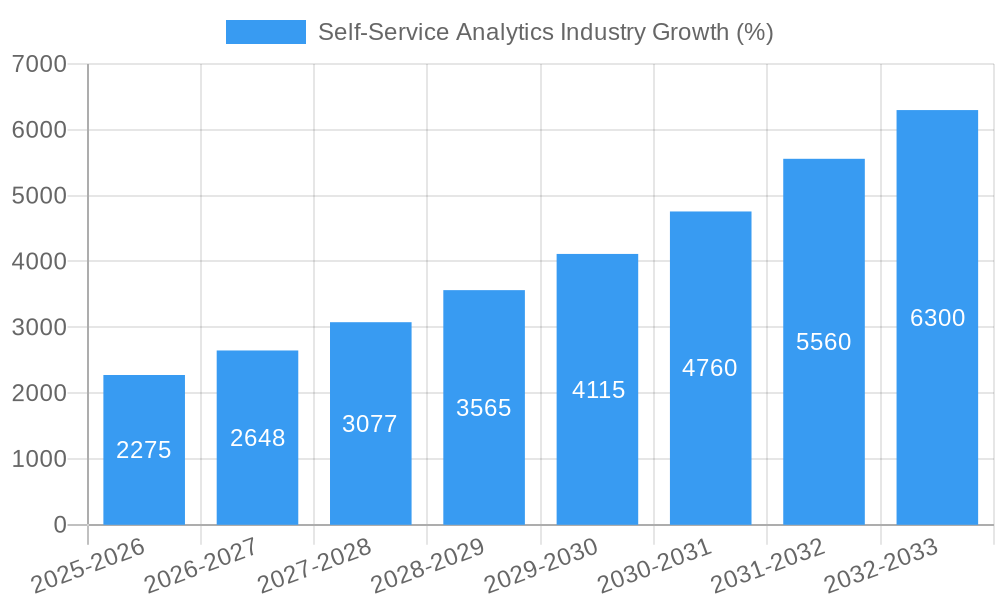
The self-service analytics market is experiencing robust growth, fueled by the increasing demand for data-driven decision-making across diverse industries. The market's Compound Annual Growth Rate (CAGR) of 15.50% from 2019 to 2024 indicates a significant upward trajectory. This expansion is driven by several key factors. Firstly, the proliferation of readily available data and the need for businesses to extract actionable insights from it is a major catalyst. Secondly, the rising adoption of cloud-based solutions, offering scalability and cost-effectiveness, significantly contributes to market growth. Thirdly, the continuous innovation in analytics technologies, including advanced visualizations and AI-powered insights, enhances user experience and expands the application of self-service analytics. The market segmentation reveals a diversified landscape with software and services playing pivotal roles. Predictive asset maintenance, fraud detection, and sales & marketing optimization are leading application areas, demonstrating the versatility and strategic importance of self-service analytics across various business functions. The on-demand deployment model is gaining traction due to its flexibility and reduced upfront investment. Across end-user industries, BFSI (Banking, Financial Services, and Insurance), healthcare, and manufacturing sectors are major contributors to market revenue due to their high data volumes and the need for improved operational efficiency.
Looking ahead, the self-service analytics market is projected to maintain its impressive growth momentum through 2033. The continued digitization of businesses, the rise of big data, and the increasing sophistication of analytical tools will drive adoption. However, challenges remain, including the need for robust data governance, data security concerns, and the requirement for skilled professionals to effectively utilize self-service analytics platforms. Despite these challenges, the market's fundamental drivers, such as the need for faster decision-making and improved operational efficiency, position self-service analytics for sustained growth and widespread adoption across industries globally. Companies like Qlik, Tibco, and Microsoft are key players, constantly innovating and expanding their offerings to cater to the evolving demands of this dynamic market. The competitive landscape is characterized by both established players and emerging startups, further fueling innovation and accessibility of self-service analytics tools.

Self-Service Analytics Industry Market Report: 2019-2033
This comprehensive report provides a detailed analysis of the Self-Service Analytics industry, encompassing market size, growth drivers, competitive landscape, and future outlook. The study period covers 2019-2033, with 2025 as the base and estimated year. The forecast period is 2025-2033, and the historical period is 2019-2024. This report is invaluable for industry professionals, investors, and anyone seeking to understand the dynamics of this rapidly evolving market. The total market size is projected to reach xx Million by 2033.
Self-Service Analytics Industry Market Structure & Innovation Trends
The Self-Service Analytics market is characterized by a moderately concentrated structure with several major players commanding significant market share. Key players such as Qlik Technologies Inc, Tibco Software, ZOHO Corporation, Microsoft Corporation, Microstrategy Inc, Dataphine, SAS Institute, Oracle Corporation, Tableau Software, Looker, SAP SE, and IBM compete intensely, driving innovation and pushing the boundaries of data visualization and analysis. The market share of the top five players is estimated at xx Million in 2025.
- Market Concentration: High, with top players holding significant market share.
- Innovation Drivers: Increasing data volumes, demand for real-time insights, and advancements in AI/ML.
- Regulatory Frameworks: GDPR, CCPA, and other data privacy regulations influence product development and data handling practices.
- Product Substitutes: Traditional Business Intelligence (BI) tools, spreadsheets, and custom-built solutions.
- End-User Demographics: Businesses across various sectors, with a growing focus on data-driven decision-making.
- M&A Activities: Significant M&A activity, reflecting consolidation and expansion efforts. Recent deals have involved values in the range of xx Million to xx Million.
Self-Service Analytics Industry Market Dynamics & Trends
The Self-Service Analytics market is experiencing robust growth, driven by several factors. The compound annual growth rate (CAGR) is projected to be xx% during the forecast period (2025-2033). Market penetration is increasing across various industry segments, fueled by the rising adoption of cloud-based solutions and the growing need for actionable insights. Technological disruptions, such as the emergence of AI and machine learning (ML) capabilities integrated into self-service analytics platforms, are reshaping the competitive landscape. Consumer preferences are shifting towards user-friendly, intuitive interfaces and solutions that provide real-time data visualization and predictive analytics. Competitive dynamics are intense, with companies investing heavily in R&D to enhance their product offerings and expand their market reach.
Dominant Regions & Segments in Self-Service Analytics Industry
The North American region currently holds the largest market share in the Self-Service Analytics industry. However, significant growth is expected in the Asia-Pacific region due to increasing digitalization and adoption of advanced technologies.
- By Type: The Software segment dominates, with xx Million in revenue in 2025, followed by the Services segment.
- By Application: Sales and Marketing Management, Risk and Compliance Management, and Customer Engagement and Analysis are the leading application segments.
- By Deployment Model: On-Demand (cloud-based) solutions are gaining significant traction, surpassing On-Premises deployments.
- By End-User Industry: BFSI (Banking, Financial Services, and Insurance), Healthcare, and Manufacturing are the largest end-user industries. Key drivers in these sectors include regulatory compliance, improved operational efficiency, and enhanced customer experience. The BFSI sector, for example, benefits from enhanced fraud detection and risk management capabilities. Healthcare utilizes self-service analytics for improved patient care and operational efficiency. Manufacturing leverages the technology for predictive maintenance and supply chain optimization.
Self-Service Analytics Industry Product Innovations
Recent product innovations focus on incorporating AI/ML capabilities, enhancing user interfaces, and improving data integration and visualization. The integration of natural language processing (NLP) is enabling users to interact with data using natural language queries, making self-service analytics more accessible. Competitive advantages are driven by superior data visualization tools, advanced analytics capabilities, ease of use, and robust security features.
Report Scope & Segmentation Analysis
This report provides a comprehensive analysis of the Self-Service Analytics market, segmented by type (Software, Services), application (Predictive Asset Maintenance, Fraud and Security Management, Sales and Marketing Management, Risk and Compliance Management, Supply Chain Management and Procurement, Operations Management, Customer Engagement and Analysis), deployment model (On-Demand, On-Premises), and end-user industry (Healthcare, Manufacturing, BFSI, Retail and E-commerce, Telecommunications, Media and Entertainment, Transportation and Logistics, Energy and Utilities, Government and Defense). Each segment is analyzed in detail, with projections for market size and growth rates. Competitive dynamics within each segment are also explored.
Key Drivers of Self-Service Analytics Industry Growth
Several factors contribute to the growth of the Self-Service Analytics industry. These include the increasing volume and complexity of data, the need for real-time insights, advancements in AI and ML, and the growing adoption of cloud-based solutions. Government initiatives promoting data-driven decision-making also play a significant role.
Challenges in the Self-Service Analytics Industry Sector
Challenges include data security and privacy concerns, the need for skilled professionals, and the complexity of implementing and integrating self-service analytics solutions. Competition is intense, requiring continuous innovation and investment in R&D. The cost of implementation can be a barrier for some businesses.
Emerging Opportunities in Self-Service Analytics Industry
Emerging opportunities lie in expanding into new markets, particularly in developing economies, and developing new applications for self-service analytics, such as in the Internet of Things (IoT) and edge computing. The increasing demand for personalized experiences is creating opportunities for targeted analytics solutions.
Leading Players in the Self-Service Analytics Industry Market
- Qlik Technologies Inc
- Tibco Software
- ZOHO Corporation
- Microsoft Corporation
- Microstrategy Inc
- Dataphine
- SAS Institute
- Oracle Corporation
- Tableau Software
- Looker
- SAP SE
- IBM
Key Developments in Self-Service Analytics Industry
- January 2022: Fractal acquired Neal Analytics, expanding its AI capabilities and geographic reach.
- December 2022: SoftLedger launched a new BI dashboard aimed at improving CFO decision-making.
Future Outlook for Self-Service Analytics Industry Market
The Self-Service Analytics market is poised for continued growth, driven by technological advancements, increasing data volumes, and the growing need for data-driven decision-making across various industries. Strategic opportunities exist in developing innovative solutions, expanding into new markets, and forging strategic partnerships. The market is expected to experience significant expansion in the coming years.
Self-Service Analytics Industry Segmentation
-
1. Type
- 1.1. Software
- 1.2. Services
-
2. Application
- 2.1. Predictive Asset Maintenance
- 2.2. Fraud and Security Management
- 2.3. Sales and Marketing Management
- 2.4. Risk and Compliance Management
- 2.5. Supply Chain Management and Procurement
- 2.6. Operations Management
- 2.7. Customer Engagement and Analysis
-
3. Deployment Model
- 3.1. On-Demand
- 3.2. On-Premises
-
4. End-User Industry
- 4.1. Healthcare
- 4.2. Manufacturing
- 4.3. BFSI
- 4.4. Retail and E-commerce
- 4.5. Telecommunications
- 4.6. Media and Entertainment
- 4.7. Transportation and Logistics
- 4.8. Energy and Utilities
- 4.9. Government and Defense
Self-Service Analytics Industry Segmentation By Geography
- 1. North America
- 2. Europe
- 3. Asia Pacific
- 4. South America
- 5. Middle East and Africa

Self-Service Analytics Industry REPORT HIGHLIGHTS
| Aspects | Details |
|---|---|
| Study Period | 2019-2033 |
| Base Year | 2024 |
| Estimated Year | 2025 |
| Forecast Period | 2025-2033 |
| Historical Period | 2019-2024 |
| Growth Rate | CAGR of 15.50% from 2019-2033 |
| Segmentation |
|
Table of Contents
- 1. Introduction
- 1.1. Research Scope
- 1.2. Market Segmentation
- 1.3. Research Methodology
- 1.4. Definitions and Assumptions
- 2. Executive Summary
- 2.1. Introduction
- 3. Market Dynamics
- 3.1. Introduction
- 3.2. Market Drivers
- 3.2.1. The Growing Volume of Business Data; Augmented Need for In-Depth Competitive Insights
- 3.3. Market Restrains
- 3.3.1. Large Investment Costs; Lack of Data Governance
- 3.4. Market Trends
- 3.4.1. Self-Service BI has a Dominant Role in Marketing and Sales
- 4. Market Factor Analysis
- 4.1. Porters Five Forces
- 4.2. Supply/Value Chain
- 4.3. PESTEL analysis
- 4.4. Market Entropy
- 4.5. Patent/Trademark Analysis
- 5. Self-Service Analytics Industry Analysis, Insights and Forecast, 2019-2031
- 5.1. Market Analysis, Insights and Forecast - by Type
- 5.1.1. Software
- 5.1.2. Services
- 5.2. Market Analysis, Insights and Forecast - by Application
- 5.2.1. Predictive Asset Maintenance
- 5.2.2. Fraud and Security Management
- 5.2.3. Sales and Marketing Management
- 5.2.4. Risk and Compliance Management
- 5.2.5. Supply Chain Management and Procurement
- 5.2.6. Operations Management
- 5.2.7. Customer Engagement and Analysis
- 5.3. Market Analysis, Insights and Forecast - by Deployment Model
- 5.3.1. On-Demand
- 5.3.2. On-Premises
- 5.4. Market Analysis, Insights and Forecast - by End-User Industry
- 5.4.1. Healthcare
- 5.4.2. Manufacturing
- 5.4.3. BFSI
- 5.4.4. Retail and E-commerce
- 5.4.5. Telecommunications
- 5.4.6. Media and Entertainment
- 5.4.7. Transportation and Logistics
- 5.4.8. Energy and Utilities
- 5.4.9. Government and Defense
- 5.5. Market Analysis, Insights and Forecast - by Region
- 5.5.1. North America
- 5.5.2. Europe
- 5.5.3. Asia Pacific
- 5.5.4. South America
- 5.5.5. Middle East and Africa
- 5.1. Market Analysis, Insights and Forecast - by Type
- 6. North America Self-Service Analytics Industry Analysis, Insights and Forecast, 2019-2031
- 6.1. Market Analysis, Insights and Forecast - by Type
- 6.1.1. Software
- 6.1.2. Services
- 6.2. Market Analysis, Insights and Forecast - by Application
- 6.2.1. Predictive Asset Maintenance
- 6.2.2. Fraud and Security Management
- 6.2.3. Sales and Marketing Management
- 6.2.4. Risk and Compliance Management
- 6.2.5. Supply Chain Management and Procurement
- 6.2.6. Operations Management
- 6.2.7. Customer Engagement and Analysis
- 6.3. Market Analysis, Insights and Forecast - by Deployment Model
- 6.3.1. On-Demand
- 6.3.2. On-Premises
- 6.4. Market Analysis, Insights and Forecast - by End-User Industry
- 6.4.1. Healthcare
- 6.4.2. Manufacturing
- 6.4.3. BFSI
- 6.4.4. Retail and E-commerce
- 6.4.5. Telecommunications
- 6.4.6. Media and Entertainment
- 6.4.7. Transportation and Logistics
- 6.4.8. Energy and Utilities
- 6.4.9. Government and Defense
- 6.1. Market Analysis, Insights and Forecast - by Type
- 7. Europe Self-Service Analytics Industry Analysis, Insights and Forecast, 2019-2031
- 7.1. Market Analysis, Insights and Forecast - by Type
- 7.1.1. Software
- 7.1.2. Services
- 7.2. Market Analysis, Insights and Forecast - by Application
- 7.2.1. Predictive Asset Maintenance
- 7.2.2. Fraud and Security Management
- 7.2.3. Sales and Marketing Management
- 7.2.4. Risk and Compliance Management
- 7.2.5. Supply Chain Management and Procurement
- 7.2.6. Operations Management
- 7.2.7. Customer Engagement and Analysis
- 7.3. Market Analysis, Insights and Forecast - by Deployment Model
- 7.3.1. On-Demand
- 7.3.2. On-Premises
- 7.4. Market Analysis, Insights and Forecast - by End-User Industry
- 7.4.1. Healthcare
- 7.4.2. Manufacturing
- 7.4.3. BFSI
- 7.4.4. Retail and E-commerce
- 7.4.5. Telecommunications
- 7.4.6. Media and Entertainment
- 7.4.7. Transportation and Logistics
- 7.4.8. Energy and Utilities
- 7.4.9. Government and Defense
- 7.1. Market Analysis, Insights and Forecast - by Type
- 8. Asia Pacific Self-Service Analytics Industry Analysis, Insights and Forecast, 2019-2031
- 8.1. Market Analysis, Insights and Forecast - by Type
- 8.1.1. Software
- 8.1.2. Services
- 8.2. Market Analysis, Insights and Forecast - by Application
- 8.2.1. Predictive Asset Maintenance
- 8.2.2. Fraud and Security Management
- 8.2.3. Sales and Marketing Management
- 8.2.4. Risk and Compliance Management
- 8.2.5. Supply Chain Management and Procurement
- 8.2.6. Operations Management
- 8.2.7. Customer Engagement and Analysis
- 8.3. Market Analysis, Insights and Forecast - by Deployment Model
- 8.3.1. On-Demand
- 8.3.2. On-Premises
- 8.4. Market Analysis, Insights and Forecast - by End-User Industry
- 8.4.1. Healthcare
- 8.4.2. Manufacturing
- 8.4.3. BFSI
- 8.4.4. Retail and E-commerce
- 8.4.5. Telecommunications
- 8.4.6. Media and Entertainment
- 8.4.7. Transportation and Logistics
- 8.4.8. Energy and Utilities
- 8.4.9. Government and Defense
- 8.1. Market Analysis, Insights and Forecast - by Type
- 9. South America Self-Service Analytics Industry Analysis, Insights and Forecast, 2019-2031
- 9.1. Market Analysis, Insights and Forecast - by Type
- 9.1.1. Software
- 9.1.2. Services
- 9.2. Market Analysis, Insights and Forecast - by Application
- 9.2.1. Predictive Asset Maintenance
- 9.2.2. Fraud and Security Management
- 9.2.3. Sales and Marketing Management
- 9.2.4. Risk and Compliance Management
- 9.2.5. Supply Chain Management and Procurement
- 9.2.6. Operations Management
- 9.2.7. Customer Engagement and Analysis
- 9.3. Market Analysis, Insights and Forecast - by Deployment Model
- 9.3.1. On-Demand
- 9.3.2. On-Premises
- 9.4. Market Analysis, Insights and Forecast - by End-User Industry
- 9.4.1. Healthcare
- 9.4.2. Manufacturing
- 9.4.3. BFSI
- 9.4.4. Retail and E-commerce
- 9.4.5. Telecommunications
- 9.4.6. Media and Entertainment
- 9.4.7. Transportation and Logistics
- 9.4.8. Energy and Utilities
- 9.4.9. Government and Defense
- 9.1. Market Analysis, Insights and Forecast - by Type
- 10. Middle East and Africa Self-Service Analytics Industry Analysis, Insights and Forecast, 2019-2031
- 10.1. Market Analysis, Insights and Forecast - by Type
- 10.1.1. Software
- 10.1.2. Services
- 10.2. Market Analysis, Insights and Forecast - by Application
- 10.2.1. Predictive Asset Maintenance
- 10.2.2. Fraud and Security Management
- 10.2.3. Sales and Marketing Management
- 10.2.4. Risk and Compliance Management
- 10.2.5. Supply Chain Management and Procurement
- 10.2.6. Operations Management
- 10.2.7. Customer Engagement and Analysis
- 10.3. Market Analysis, Insights and Forecast - by Deployment Model
- 10.3.1. On-Demand
- 10.3.2. On-Premises
- 10.4. Market Analysis, Insights and Forecast - by End-User Industry
- 10.4.1. Healthcare
- 10.4.2. Manufacturing
- 10.4.3. BFSI
- 10.4.4. Retail and E-commerce
- 10.4.5. Telecommunications
- 10.4.6. Media and Entertainment
- 10.4.7. Transportation and Logistics
- 10.4.8. Energy and Utilities
- 10.4.9. Government and Defense
- 10.1. Market Analysis, Insights and Forecast - by Type
- 11. North America Self-Service Analytics Industry Analysis, Insights and Forecast, 2019-2031
- 11.1. Market Analysis, Insights and Forecast - By Country/Sub-region
- 11.1.1.
- 12. Europe Self-Service Analytics Industry Analysis, Insights and Forecast, 2019-2031
- 12.1. Market Analysis, Insights and Forecast - By Country/Sub-region
- 12.1.1.
- 13. Asia Pacific Self-Service Analytics Industry Analysis, Insights and Forecast, 2019-2031
- 13.1. Market Analysis, Insights and Forecast - By Country/Sub-region
- 13.1.1.
- 14. South America Self-Service Analytics Industry Analysis, Insights and Forecast, 2019-2031
- 14.1. Market Analysis, Insights and Forecast - By Country/Sub-region
- 14.1.1.
- 15. Middle East and Africa Self-Service Analytics Industry Analysis, Insights and Forecast, 2019-2031
- 15.1. Market Analysis, Insights and Forecast - By Country/Sub-region
- 15.1.1.
- 16. Competitive Analysis
- 16.1. Market Share Analysis 2024
- 16.2. Company Profiles
- 16.2.1 Qlik Technologies Inc
- 16.2.1.1. Overview
- 16.2.1.2. Products
- 16.2.1.3. SWOT Analysis
- 16.2.1.4. Recent Developments
- 16.2.1.5. Financials (Based on Availability)
- 16.2.2 Tibco Software
- 16.2.2.1. Overview
- 16.2.2.2. Products
- 16.2.2.3. SWOT Analysis
- 16.2.2.4. Recent Developments
- 16.2.2.5. Financials (Based on Availability)
- 16.2.3 ZOHO Corporation
- 16.2.3.1. Overview
- 16.2.3.2. Products
- 16.2.3.3. SWOT Analysis
- 16.2.3.4. Recent Developments
- 16.2.3.5. Financials (Based on Availability)
- 16.2.4 Microsoft Corporation
- 16.2.4.1. Overview
- 16.2.4.2. Products
- 16.2.4.3. SWOT Analysis
- 16.2.4.4. Recent Developments
- 16.2.4.5. Financials (Based on Availability)
- 16.2.5 Microstrategy Inc
- 16.2.5.1. Overview
- 16.2.5.2. Products
- 16.2.5.3. SWOT Analysis
- 16.2.5.4. Recent Developments
- 16.2.5.5. Financials (Based on Availability)
- 16.2.6 Dataphine
- 16.2.6.1. Overview
- 16.2.6.2. Products
- 16.2.6.3. SWOT Analysis
- 16.2.6.4. Recent Developments
- 16.2.6.5. Financials (Based on Availability)
- 16.2.7 SAS Institute
- 16.2.7.1. Overview
- 16.2.7.2. Products
- 16.2.7.3. SWOT Analysis
- 16.2.7.4. Recent Developments
- 16.2.7.5. Financials (Based on Availability)
- 16.2.8 Oracle Corporation
- 16.2.8.1. Overview
- 16.2.8.2. Products
- 16.2.8.3. SWOT Analysis
- 16.2.8.4. Recent Developments
- 16.2.8.5. Financials (Based on Availability)
- 16.2.9 Tableau Software
- 16.2.9.1. Overview
- 16.2.9.2. Products
- 16.2.9.3. SWOT Analysis
- 16.2.9.4. Recent Developments
- 16.2.9.5. Financials (Based on Availability)
- 16.2.10 Looker*List Not Exhaustive
- 16.2.10.1. Overview
- 16.2.10.2. Products
- 16.2.10.3. SWOT Analysis
- 16.2.10.4. Recent Developments
- 16.2.10.5. Financials (Based on Availability)
- 16.2.11 SAP SE
- 16.2.11.1. Overview
- 16.2.11.2. Products
- 16.2.11.3. SWOT Analysis
- 16.2.11.4. Recent Developments
- 16.2.11.5. Financials (Based on Availability)
- 16.2.12 IBM
- 16.2.12.1. Overview
- 16.2.12.2. Products
- 16.2.12.3. SWOT Analysis
- 16.2.12.4. Recent Developments
- 16.2.12.5. Financials (Based on Availability)
- 16.2.1 Qlik Technologies Inc
List of Figures
- Figure 1: Self-Service Analytics Industry Revenue Breakdown (Million, %) by Product 2024 & 2032
- Figure 2: Self-Service Analytics Industry Share (%) by Company 2024
List of Tables
- Table 1: Self-Service Analytics Industry Revenue Million Forecast, by Region 2019 & 2032
- Table 2: Self-Service Analytics Industry Revenue Million Forecast, by Type 2019 & 2032
- Table 3: Self-Service Analytics Industry Revenue Million Forecast, by Application 2019 & 2032
- Table 4: Self-Service Analytics Industry Revenue Million Forecast, by Deployment Model 2019 & 2032
- Table 5: Self-Service Analytics Industry Revenue Million Forecast, by End-User Industry 2019 & 2032
- Table 6: Self-Service Analytics Industry Revenue Million Forecast, by Region 2019 & 2032
- Table 7: Self-Service Analytics Industry Revenue Million Forecast, by Country 2019 & 2032
- Table 8: Self-Service Analytics Industry Revenue (Million) Forecast, by Application 2019 & 2032
- Table 9: Self-Service Analytics Industry Revenue Million Forecast, by Country 2019 & 2032
- Table 10: Self-Service Analytics Industry Revenue (Million) Forecast, by Application 2019 & 2032
- Table 11: Self-Service Analytics Industry Revenue Million Forecast, by Country 2019 & 2032
- Table 12: Self-Service Analytics Industry Revenue (Million) Forecast, by Application 2019 & 2032
- Table 13: Self-Service Analytics Industry Revenue Million Forecast, by Country 2019 & 2032
- Table 14: Self-Service Analytics Industry Revenue (Million) Forecast, by Application 2019 & 2032
- Table 15: Self-Service Analytics Industry Revenue Million Forecast, by Country 2019 & 2032
- Table 16: Self-Service Analytics Industry Revenue (Million) Forecast, by Application 2019 & 2032
- Table 17: Self-Service Analytics Industry Revenue Million Forecast, by Type 2019 & 2032
- Table 18: Self-Service Analytics Industry Revenue Million Forecast, by Application 2019 & 2032
- Table 19: Self-Service Analytics Industry Revenue Million Forecast, by Deployment Model 2019 & 2032
- Table 20: Self-Service Analytics Industry Revenue Million Forecast, by End-User Industry 2019 & 2032
- Table 21: Self-Service Analytics Industry Revenue Million Forecast, by Country 2019 & 2032
- Table 22: Self-Service Analytics Industry Revenue Million Forecast, by Type 2019 & 2032
- Table 23: Self-Service Analytics Industry Revenue Million Forecast, by Application 2019 & 2032
- Table 24: Self-Service Analytics Industry Revenue Million Forecast, by Deployment Model 2019 & 2032
- Table 25: Self-Service Analytics Industry Revenue Million Forecast, by End-User Industry 2019 & 2032
- Table 26: Self-Service Analytics Industry Revenue Million Forecast, by Country 2019 & 2032
- Table 27: Self-Service Analytics Industry Revenue Million Forecast, by Type 2019 & 2032
- Table 28: Self-Service Analytics Industry Revenue Million Forecast, by Application 2019 & 2032
- Table 29: Self-Service Analytics Industry Revenue Million Forecast, by Deployment Model 2019 & 2032
- Table 30: Self-Service Analytics Industry Revenue Million Forecast, by End-User Industry 2019 & 2032
- Table 31: Self-Service Analytics Industry Revenue Million Forecast, by Country 2019 & 2032
- Table 32: Self-Service Analytics Industry Revenue Million Forecast, by Type 2019 & 2032
- Table 33: Self-Service Analytics Industry Revenue Million Forecast, by Application 2019 & 2032
- Table 34: Self-Service Analytics Industry Revenue Million Forecast, by Deployment Model 2019 & 2032
- Table 35: Self-Service Analytics Industry Revenue Million Forecast, by End-User Industry 2019 & 2032
- Table 36: Self-Service Analytics Industry Revenue Million Forecast, by Country 2019 & 2032
- Table 37: Self-Service Analytics Industry Revenue Million Forecast, by Type 2019 & 2032
- Table 38: Self-Service Analytics Industry Revenue Million Forecast, by Application 2019 & 2032
- Table 39: Self-Service Analytics Industry Revenue Million Forecast, by Deployment Model 2019 & 2032
- Table 40: Self-Service Analytics Industry Revenue Million Forecast, by End-User Industry 2019 & 2032
- Table 41: Self-Service Analytics Industry Revenue Million Forecast, by Country 2019 & 2032
Frequently Asked Questions
1. What is the projected Compound Annual Growth Rate (CAGR) of the Self-Service Analytics Industry?
The projected CAGR is approximately 15.50%.
2. Which companies are prominent players in the Self-Service Analytics Industry?
Key companies in the market include Qlik Technologies Inc, Tibco Software, ZOHO Corporation, Microsoft Corporation, Microstrategy Inc, Dataphine, SAS Institute, Oracle Corporation, Tableau Software, Looker*List Not Exhaustive, SAP SE, IBM.
3. What are the main segments of the Self-Service Analytics Industry?
The market segments include Type, Application, Deployment Model, End-User Industry.
4. Can you provide details about the market size?
The market size is estimated to be USD XX Million as of 2022.
5. What are some drivers contributing to market growth?
The Growing Volume of Business Data; Augmented Need for In-Depth Competitive Insights.
6. What are the notable trends driving market growth?
Self-Service BI has a Dominant Role in Marketing and Sales.
7. Are there any restraints impacting market growth?
Large Investment Costs; Lack of Data Governance.
8. Can you provide examples of recent developments in the market?
December 2022: SoftLedger, a real-time cloud accounting software platform located in the United States, announced the introduction of a new BI dashboard. This initiative is intended to assist Chief Financial Officers (CFOs) in making good strategic business choices based on timely and accurate financial data. The company believes that its new dashboard will make financial data management more convenient and effective.
9. What pricing options are available for accessing the report?
Pricing options include single-user, multi-user, and enterprise licenses priced at USD 3800, USD 4500, and USD 5800 respectively.
10. Is the market size provided in terms of value or volume?
The market size is provided in terms of value, measured in Million.
11. Are there any specific market keywords associated with the report?
Yes, the market keyword associated with the report is "Self-Service Analytics Industry," which aids in identifying and referencing the specific market segment covered.
12. How do I determine which pricing option suits my needs best?
The pricing options vary based on user requirements and access needs. Individual users may opt for single-user licenses, while businesses requiring broader access may choose multi-user or enterprise licenses for cost-effective access to the report.
13. Are there any additional resources or data provided in the Self-Service Analytics Industry report?
While the report offers comprehensive insights, it's advisable to review the specific contents or supplementary materials provided to ascertain if additional resources or data are available.
14. How can I stay updated on further developments or reports in the Self-Service Analytics Industry?
To stay informed about further developments, trends, and reports in the Self-Service Analytics Industry, consider subscribing to industry newsletters, following relevant companies and organizations, or regularly checking reputable industry news sources and publications.
Methodology
Step 1 - Identification of Relevant Samples Size from Population Database


Step 2 - Approaches for Defining Global Market Size (Value, Volume* & Price*)

Note*: In applicable scenarios
Step 3 - Data Sources
Primary Research
- Web Analytics
- Survey Reports
- Research Institute
- Latest Research Reports
- Opinion Leaders
Secondary Research
- Annual Reports
- White Paper
- Latest Press Release
- Industry Association
- Paid Database
- Investor Presentations

Step 4 - Data Triangulation
Involves using different sources of information in order to increase the validity of a study
These sources are likely to be stakeholders in a program - participants, other researchers, program staff, other community members, and so on.
Then we put all data in single framework & apply various statistical tools to find out the dynamic on the market.
During the analysis stage, feedback from the stakeholder groups would be compared to determine areas of agreement as well as areas of divergence


