
Key Insights
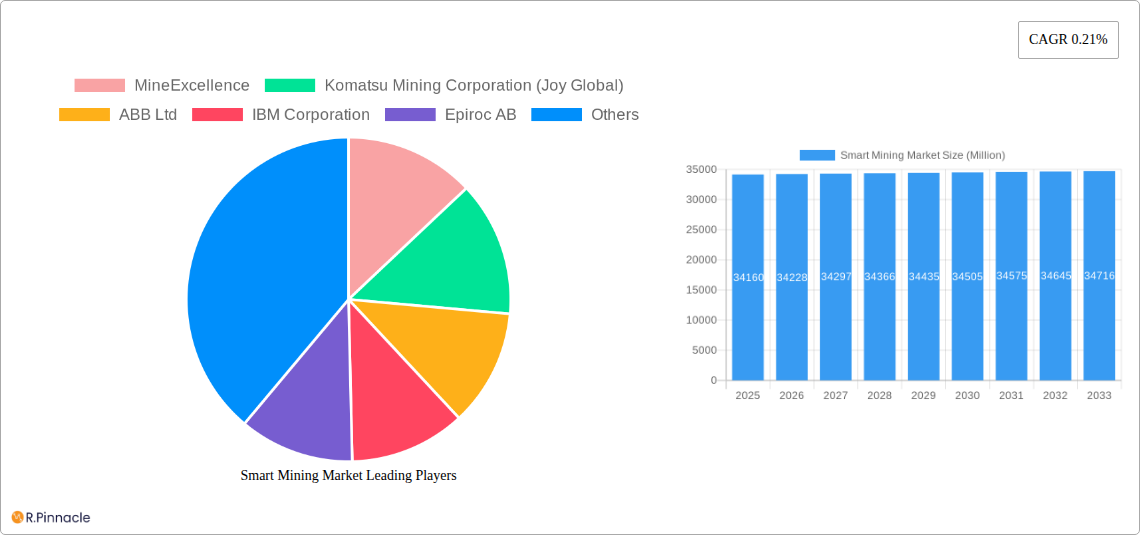
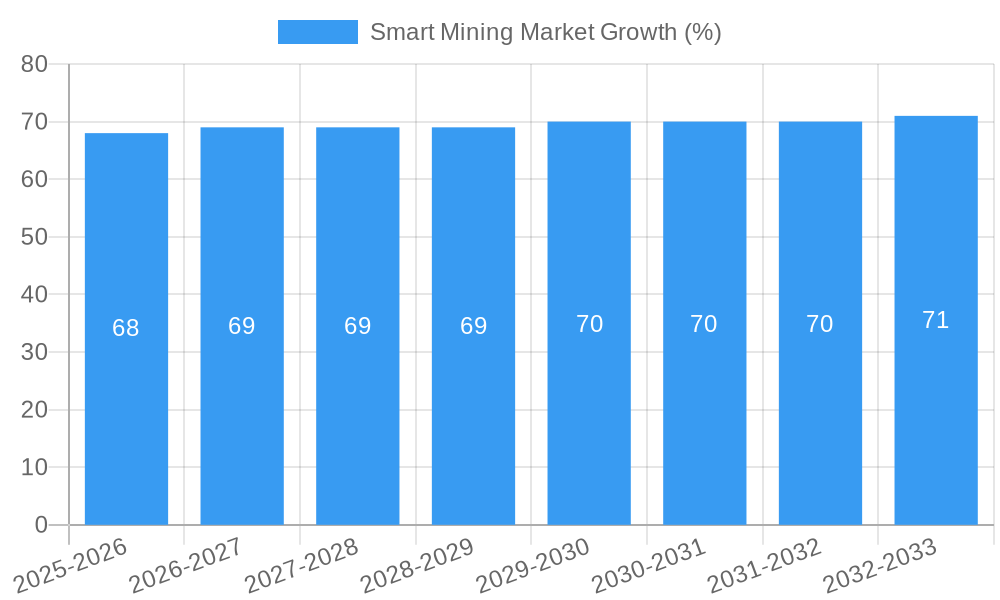
The global smart mining market, valued at $34.16 billion in 2025, is projected to experience steady growth, driven by increasing demand for enhanced safety, efficiency, and productivity in mining operations. A Compound Annual Growth Rate (CAGR) of 0.21% indicates a moderate expansion over the forecast period (2025-2033). This growth is fueled by several key factors. The adoption of smart control systems, asset management solutions, and data analytics software is transforming traditional mining practices, optimizing resource allocation, and minimizing operational downtime. Furthermore, stringent safety regulations and the need to reduce environmental impact are accelerating the integration of safety and security systems, promoting the market's growth. Significant investments in automation and digitalization are shaping market dynamics, with underground mining currently dominating the segment due to its higher need for sophisticated monitoring and control systems. However, challenges remain, including the high initial investment costs associated with implementing smart mining technologies and the need for skilled workforce training to effectively utilize these systems. The market is segmented by solution (smart control, asset management, safety & security, data analytics, monitoring, others), service type (system integration, consulting, engineering & maintenance), and mining type (underground, surface), offering various growth opportunities across different regions. Key players such as MineExcellence, Komatsu Mining, ABB, IBM, and others are actively shaping the market landscape through technological advancements and strategic partnerships.
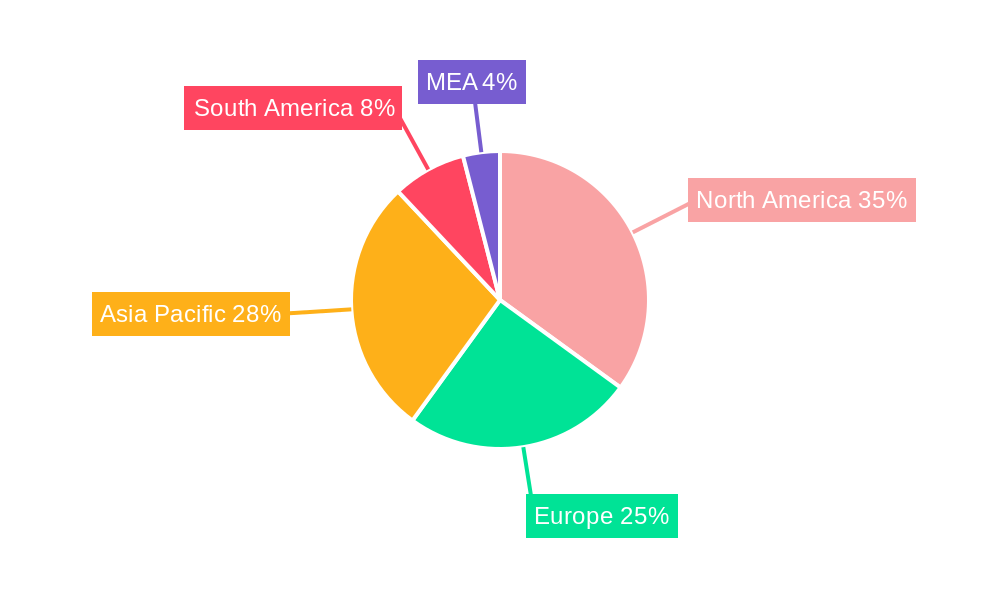
The geographical distribution of the smart mining market shows a diverse landscape. North America, with its established mining industry and technological advancements, is likely to hold a significant market share, closely followed by regions like Europe and Asia-Pacific. The Asia-Pacific region is poised for substantial growth driven by increasing mining activities and infrastructural development in countries like China, India, and Australia. While the overall CAGR is moderate, individual segments and regions may experience higher growth rates, driven by specific technological breakthroughs, regulatory changes, or economic factors. The market will witness intensified competition among established vendors and emerging players, leading to technological innovations and potentially lower prices, making smart mining solutions accessible to a broader range of mining operations globally.
Smart Mining Market Report: Unlocking Growth in a Transforming Industry (2019-2033)
This comprehensive report provides an in-depth analysis of the Smart Mining Market, offering actionable insights for industry professionals and investors. With a focus on market structure, dynamics, key players, and future trends, this report covers the period from 2019 to 2033, utilizing 2025 as the base year. The report projects a xx Million market size by 2033, exhibiting a CAGR of xx% during the forecast period (2025-2033).
Smart Mining Market Structure & Innovation Trends
The Smart Mining Market is experiencing significant growth driven by technological advancements, increasing demand for enhanced efficiency and safety, and stringent environmental regulations. Market concentration is moderate, with key players such as Komatsu Mining Corporation (Joy Global), ABB Ltd, IBM Corporation, Epiroc AB, and Cisco Systems Inc holding substantial market share. However, smaller, specialized companies like MineExcellence and Symboticware Inc are also contributing significantly to innovation.
- Market Share: Komatsu Mining Corporation holds an estimated xx% market share, followed by ABB Ltd at xx% and IBM Corporation at xx%.
- Innovation Drivers: AI, IoT, cloud computing, and advanced analytics are driving innovation, leading to the development of sophisticated smart mining solutions.
- Regulatory Frameworks: Stringent safety regulations and environmental concerns are pushing the adoption of smart mining technologies.
- M&A Activities: The market has witnessed several mergers and acquisitions in recent years, with deal values exceeding xx Million in the past five years. These activities are consolidating the market and fostering innovation.
- Product Substitutes: Traditional mining methods are facing increasing competition from smart mining technologies due to their superior efficiency and safety features.
- End-User Demographics: Large-scale mining operations are the primary adopters of smart mining solutions, driven by the need for enhanced productivity and cost optimization.
Smart Mining Market Dynamics & Trends
The Smart Mining Market is characterized by rapid technological advancements, shifting consumer preferences, and intense competitive dynamics. The market is experiencing significant growth, driven by the increasing demand for improved efficiency, safety, and sustainability in mining operations. The adoption of smart mining technologies is expected to accelerate in the coming years, driven by factors such as the growing need for real-time data analytics, the increasing availability of affordable sensors, and the rising demand for automation in mining processes. This market growth is also fueled by a rise in government initiatives aimed at promoting automation in the mining sector.
The market penetration of smart mining solutions is expected to increase significantly in the coming years, particularly in developed countries. Technological disruptions, such as the implementation of artificial intelligence (AI) and machine learning (ML), will continue to shape the future of smart mining. Companies are investing heavily in research and development to improve the efficiency and safety of their products and services. The adoption of cloud-based solutions and the development of new sensor technologies are expected to further drive market growth.
Dominant Regions & Segments in Smart Mining Market
The Smart Mining Market is geographically diverse, with significant growth observed in North America, Europe, and Asia-Pacific regions.
Leading Regions & Segments:
- North America: High adoption rates of advanced technologies and a strong focus on safety regulations are driving market growth in this region.
- Europe: The region is witnessing increasing adoption of smart mining technologies due to stringent environmental regulations and a focus on sustainable mining practices.
- Asia-Pacific: This region demonstrates significant growth potential, fueled by rapid industrialization and increasing investment in mining infrastructure.
By Solution:
- Smart Control Systems: This segment holds a significant market share due to the increasing demand for improved process control and efficiency.
- Data Management and Analytics Software: This segment is witnessing rapid growth driven by the rising need for real-time data analysis and insights.
- Safety and Security Systems: Growing awareness of workplace safety is fueling the adoption of smart safety and security systems.
By Service Type:
- System Integration: This segment dominates the market due to the complex nature of integrating various smart mining technologies.
- Consulting Services: The demand for specialized expertise in implementing and managing smart mining solutions is increasing the growth of this segment.
By Mining Type:
- Underground Mining: The adoption of smart mining solutions in underground mining is relatively high due to the hazardous nature of the work environment.
- Surface Mining: The demand for smart mining solutions in surface mining is increasing due to the need for enhanced productivity and efficiency.
Key drivers for each segment vary: for example, economic policies supporting digital transformation drive adoption in Smart Control Systems, while the need for improved risk management boosts demand in Safety and Security Systems.
Smart Mining Market Product Innovations
Recent product innovations focus on enhancing safety, efficiency, and sustainability. Epiroc's Boomer S10 S drilling rig, launched in May 2022, exemplifies this trend, offering up to 25% higher productivity compared to traditional methods. Furthermore, partnerships such as the Metso Outotec and Dynamox collaboration (June 2022) highlight the integration of advanced condition monitoring and AI-powered analytics for improved equipment performance and reduced downtime. These advancements resonate with the market's need for data-driven decision-making and optimized resource utilization.
Report Scope & Segmentation Analysis
This report provides a detailed segmentation analysis of the Smart Mining Market across various parameters.
By Solution: Smart Control Systems, Smart Asset Management, Safety and Security Systems, Data Management and Analytics Software, Monitoring Systems, and Other Solutions. Each segment's growth is influenced by factors such as technological advancements, regulatory compliance, and operational efficiency demands.
By Service Type: System Integration, Consulting Services, and Engineering and Maintenance. The competitive dynamics within these segments are shaped by the expertise and experience of service providers.
By Mining Type: Underground Mining and Surface Mining. The unique challenges and operational requirements of each mining type influence the specific smart mining solutions deployed.
Each segment displays a projected CAGR ranging from xx% to xx% during the forecast period, with market sizes varying significantly based on adoption rates and technological advancements.
Key Drivers of Smart Mining Market Growth
The Smart Mining Market is experiencing rapid growth due to several key drivers:
- Technological Advancements: AI, IoT, and advanced analytics are transforming mining operations, driving the adoption of smart mining solutions.
- Increased Demand for Efficiency and Productivity: Smart mining technologies offer significant improvements in operational efficiency, leading to cost savings and increased productivity.
- Stringent Safety Regulations: Growing concerns about workplace safety are driving the adoption of smart mining solutions that enhance safety and reduce risks.
- Government Initiatives: Many governments are actively promoting the adoption of smart mining technologies through policy support and funding initiatives.
Challenges in the Smart Mining Market Sector
Despite significant growth potential, the Smart Mining Market faces several challenges:
- High Initial Investment Costs: Implementing smart mining technologies requires significant upfront investments, which can be a barrier for some mining companies.
- Integration Complexity: Integrating various smart mining technologies can be complex and time-consuming.
- Data Security Concerns: The increasing reliance on data raises concerns about data security and privacy.
- Lack of Skilled Workforce: A shortage of skilled personnel to operate and maintain smart mining technologies poses a challenge to market growth. This talent gap leads to increased training costs and delayed implementation timelines.
Emerging Opportunities in Smart Mining Market
The Smart Mining Market presents several promising opportunities:
- Growing Adoption of Cloud-Based Solutions: Cloud-based solutions offer scalability, flexibility, and cost-effectiveness, driving market expansion.
- Increasing Demand for Autonomous Mining Systems: The development of autonomous mining equipment is creating new opportunities for smart mining technology providers.
- Expansion into New Geographic Markets: Emerging economies are increasingly adopting smart mining technologies, opening up new market opportunities.
- Development of New Sensor Technologies: Advances in sensor technology are enabling more precise and accurate data collection, leading to improved decision-making.
Leading Players in the Smart Mining Market Market
- MineExcellence
- Komatsu Mining Corporation (Joy Global)
- ABB Ltd
- IBM Corporation
- Epiroc AB
- Cisco Systems Inc
- Wenco International Mining Systems Ltd
- Metso Outotec OYJ
- Rockwell Automation Inc
- Trimble Inc
- Symboticware Inc
- SAP SE
Key Developments in Smart Mining Market Industry
- June 2022: Metso Outotec collaborated with Dynamox to integrate Dynamox's condition monitoring platform into its equipment, improving operational efficiency and sustainability.
- May 2022: Epiroc launched the Boomer S10 S drilling rig, significantly enhancing productivity and cost-efficiency in mine development.
These developments showcase the industry's focus on enhancing operational efficiency, safety, and sustainability through technological innovation.
Future Outlook for Smart Mining Market Market
The Smart Mining Market is poised for continued strong growth, driven by the increasing adoption of smart mining technologies across various mining operations globally. The continued development of AI and IoT-enabled solutions will drive further market expansion, creating substantial opportunities for technology providers and mining companies alike. Strategic partnerships and investments in R&D will play a crucial role in shaping the future of the industry, leading to more efficient, sustainable, and safer mining practices.
Smart Mining Market Segmentation
-
1. Solution
- 1.1. Smart Control System
- 1.2. Smart Asset Management
- 1.3. Safety and Security System
- 1.4. Data Management and Analytics Software
- 1.5. Monitoring System
- 1.6. Other Solutions
-
2. Service Type
- 2.1. System Integration
- 2.2. Consulting Service
- 2.3. Engineering and Maintenance
-
3. Mining Type
- 3.1. Underground Mining
- 3.2. Surface Mining
Smart Mining Market Segmentation By Geography
- 1. North America
- 2. Europe
- 3. Asia Pacific
- 4. Latin America
- 5. Middle East and Africa
Smart Mining Market REPORT HIGHLIGHTS
| Aspects | Details |
|---|---|
| Study Period | 2019-2033 |
| Base Year | 2024 |
| Estimated Year | 2025 |
| Forecast Period | 2025-2033 |
| Historical Period | 2019-2024 |
| Growth Rate | CAGR of 0.21% from 2019-2033 |
| Segmentation |
|
Table of Contents
- 1. Introduction
- 1.1. Research Scope
- 1.2. Market Segmentation
- 1.3. Research Methodology
- 1.4. Definitions and Assumptions
- 2. Executive Summary
- 2.1. Introduction
- 3. Market Dynamics
- 3.1. Introduction
- 3.2. Market Drivers
- 3.2.1. Rising Adoption of Wireless Monitoring and Centralized Solutions among Several Large Mining Installations; Technological Advancements and Convergence of Various Digital Transformation Practices
- 3.3. Market Restrains
- 3.3.1. Operational and Cost Challenges Remain a Concern in Emerging Regions; Workers Safety and Health
- 3.4. Market Trends
- 3.4.1. Data Management and Analytics Software is Expected to Show Highest Growth
- 4. Market Factor Analysis
- 4.1. Porters Five Forces
- 4.2. Supply/Value Chain
- 4.3. PESTEL analysis
- 4.4. Market Entropy
- 4.5. Patent/Trademark Analysis
- 5. Global Smart Mining Market Analysis, Insights and Forecast, 2019-2031
- 5.1. Market Analysis, Insights and Forecast - by Solution
- 5.1.1. Smart Control System
- 5.1.2. Smart Asset Management
- 5.1.3. Safety and Security System
- 5.1.4. Data Management and Analytics Software
- 5.1.5. Monitoring System
- 5.1.6. Other Solutions
- 5.2. Market Analysis, Insights and Forecast - by Service Type
- 5.2.1. System Integration
- 5.2.2. Consulting Service
- 5.2.3. Engineering and Maintenance
- 5.3. Market Analysis, Insights and Forecast - by Mining Type
- 5.3.1. Underground Mining
- 5.3.2. Surface Mining
- 5.4. Market Analysis, Insights and Forecast - by Region
- 5.4.1. North America
- 5.4.2. Europe
- 5.4.3. Asia Pacific
- 5.4.4. Latin America
- 5.4.5. Middle East and Africa
- 5.1. Market Analysis, Insights and Forecast - by Solution
- 6. North America Smart Mining Market Analysis, Insights and Forecast, 2019-2031
- 6.1. Market Analysis, Insights and Forecast - by Solution
- 6.1.1. Smart Control System
- 6.1.2. Smart Asset Management
- 6.1.3. Safety and Security System
- 6.1.4. Data Management and Analytics Software
- 6.1.5. Monitoring System
- 6.1.6. Other Solutions
- 6.2. Market Analysis, Insights and Forecast - by Service Type
- 6.2.1. System Integration
- 6.2.2. Consulting Service
- 6.2.3. Engineering and Maintenance
- 6.3. Market Analysis, Insights and Forecast - by Mining Type
- 6.3.1. Underground Mining
- 6.3.2. Surface Mining
- 6.1. Market Analysis, Insights and Forecast - by Solution
- 7. Europe Smart Mining Market Analysis, Insights and Forecast, 2019-2031
- 7.1. Market Analysis, Insights and Forecast - by Solution
- 7.1.1. Smart Control System
- 7.1.2. Smart Asset Management
- 7.1.3. Safety and Security System
- 7.1.4. Data Management and Analytics Software
- 7.1.5. Monitoring System
- 7.1.6. Other Solutions
- 7.2. Market Analysis, Insights and Forecast - by Service Type
- 7.2.1. System Integration
- 7.2.2. Consulting Service
- 7.2.3. Engineering and Maintenance
- 7.3. Market Analysis, Insights and Forecast - by Mining Type
- 7.3.1. Underground Mining
- 7.3.2. Surface Mining
- 7.1. Market Analysis, Insights and Forecast - by Solution
- 8. Asia Pacific Smart Mining Market Analysis, Insights and Forecast, 2019-2031
- 8.1. Market Analysis, Insights and Forecast - by Solution
- 8.1.1. Smart Control System
- 8.1.2. Smart Asset Management
- 8.1.3. Safety and Security System
- 8.1.4. Data Management and Analytics Software
- 8.1.5. Monitoring System
- 8.1.6. Other Solutions
- 8.2. Market Analysis, Insights and Forecast - by Service Type
- 8.2.1. System Integration
- 8.2.2. Consulting Service
- 8.2.3. Engineering and Maintenance
- 8.3. Market Analysis, Insights and Forecast - by Mining Type
- 8.3.1. Underground Mining
- 8.3.2. Surface Mining
- 8.1. Market Analysis, Insights and Forecast - by Solution
- 9. Latin America Smart Mining Market Analysis, Insights and Forecast, 2019-2031
- 9.1. Market Analysis, Insights and Forecast - by Solution
- 9.1.1. Smart Control System
- 9.1.2. Smart Asset Management
- 9.1.3. Safety and Security System
- 9.1.4. Data Management and Analytics Software
- 9.1.5. Monitoring System
- 9.1.6. Other Solutions
- 9.2. Market Analysis, Insights and Forecast - by Service Type
- 9.2.1. System Integration
- 9.2.2. Consulting Service
- 9.2.3. Engineering and Maintenance
- 9.3. Market Analysis, Insights and Forecast - by Mining Type
- 9.3.1. Underground Mining
- 9.3.2. Surface Mining
- 9.1. Market Analysis, Insights and Forecast - by Solution
- 10. Middle East and Africa Smart Mining Market Analysis, Insights and Forecast, 2019-2031
- 10.1. Market Analysis, Insights and Forecast - by Solution
- 10.1.1. Smart Control System
- 10.1.2. Smart Asset Management
- 10.1.3. Safety and Security System
- 10.1.4. Data Management and Analytics Software
- 10.1.5. Monitoring System
- 10.1.6. Other Solutions
- 10.2. Market Analysis, Insights and Forecast - by Service Type
- 10.2.1. System Integration
- 10.2.2. Consulting Service
- 10.2.3. Engineering and Maintenance
- 10.3. Market Analysis, Insights and Forecast - by Mining Type
- 10.3.1. Underground Mining
- 10.3.2. Surface Mining
- 10.1. Market Analysis, Insights and Forecast - by Solution
- 11. North America Smart Mining Market Analysis, Insights and Forecast, 2019-2031
- 11.1. Market Analysis, Insights and Forecast - By Country/Sub-region
- 11.1.1 United States
- 11.1.2 Canada
- 11.1.3 Mexico
- 12. Europe Smart Mining Market Analysis, Insights and Forecast, 2019-2031
- 12.1. Market Analysis, Insights and Forecast - By Country/Sub-region
- 12.1.1 Germany
- 12.1.2 United Kingdom
- 12.1.3 France
- 12.1.4 Spain
- 12.1.5 Italy
- 12.1.6 Spain
- 12.1.7 Belgium
- 12.1.8 Netherland
- 12.1.9 Nordics
- 12.1.10 Rest of Europe
- 13. Asia Pacific Smart Mining Market Analysis, Insights and Forecast, 2019-2031
- 13.1. Market Analysis, Insights and Forecast - By Country/Sub-region
- 13.1.1 China
- 13.1.2 Japan
- 13.1.3 India
- 13.1.4 South Korea
- 13.1.5 Southeast Asia
- 13.1.6 Australia
- 13.1.7 Indonesia
- 13.1.8 Phillipes
- 13.1.9 Singapore
- 13.1.10 Thailandc
- 13.1.11 Rest of Asia Pacific
- 14. South America Smart Mining Market Analysis, Insights and Forecast, 2019-2031
- 14.1. Market Analysis, Insights and Forecast - By Country/Sub-region
- 14.1.1 Brazil
- 14.1.2 Argentina
- 14.1.3 Peru
- 14.1.4 Chile
- 14.1.5 Colombia
- 14.1.6 Ecuador
- 14.1.7 Venezuela
- 14.1.8 Rest of South America
- 15. North America Smart Mining Market Analysis, Insights and Forecast, 2019-2031
- 15.1. Market Analysis, Insights and Forecast - By Country/Sub-region
- 15.1.1 United States
- 15.1.2 Canada
- 15.1.3 Mexico
- 16. MEA Smart Mining Market Analysis, Insights and Forecast, 2019-2031
- 16.1. Market Analysis, Insights and Forecast - By Country/Sub-region
- 16.1.1 United Arab Emirates
- 16.1.2 Saudi Arabia
- 16.1.3 South Africa
- 16.1.4 Rest of Middle East and Africa
- 17. Competitive Analysis
- 17.1. Global Market Share Analysis 2024
- 17.2. Company Profiles
- 17.2.1 MineExcellence
- 17.2.1.1. Overview
- 17.2.1.2. Products
- 17.2.1.3. SWOT Analysis
- 17.2.1.4. Recent Developments
- 17.2.1.5. Financials (Based on Availability)
- 17.2.2 Komatsu Mining Corporation (Joy Global)
- 17.2.2.1. Overview
- 17.2.2.2. Products
- 17.2.2.3. SWOT Analysis
- 17.2.2.4. Recent Developments
- 17.2.2.5. Financials (Based on Availability)
- 17.2.3 ABB Ltd
- 17.2.3.1. Overview
- 17.2.3.2. Products
- 17.2.3.3. SWOT Analysis
- 17.2.3.4. Recent Developments
- 17.2.3.5. Financials (Based on Availability)
- 17.2.4 IBM Corporation
- 17.2.4.1. Overview
- 17.2.4.2. Products
- 17.2.4.3. SWOT Analysis
- 17.2.4.4. Recent Developments
- 17.2.4.5. Financials (Based on Availability)
- 17.2.5 Epiroc AB
- 17.2.5.1. Overview
- 17.2.5.2. Products
- 17.2.5.3. SWOT Analysis
- 17.2.5.4. Recent Developments
- 17.2.5.5. Financials (Based on Availability)
- 17.2.6 Cisco Systems Inc
- 17.2.6.1. Overview
- 17.2.6.2. Products
- 17.2.6.3. SWOT Analysis
- 17.2.6.4. Recent Developments
- 17.2.6.5. Financials (Based on Availability)
- 17.2.7 Wenco International Mining Systems Ltd
- 17.2.7.1. Overview
- 17.2.7.2. Products
- 17.2.7.3. SWOT Analysis
- 17.2.7.4. Recent Developments
- 17.2.7.5. Financials (Based on Availability)
- 17.2.8 Metso Outotec OYJ
- 17.2.8.1. Overview
- 17.2.8.2. Products
- 17.2.8.3. SWOT Analysis
- 17.2.8.4. Recent Developments
- 17.2.8.5. Financials (Based on Availability)
- 17.2.9 Rockwell Automation Inc
- 17.2.9.1. Overview
- 17.2.9.2. Products
- 17.2.9.3. SWOT Analysis
- 17.2.9.4. Recent Developments
- 17.2.9.5. Financials (Based on Availability)
- 17.2.10 Trimble Inc
- 17.2.10.1. Overview
- 17.2.10.2. Products
- 17.2.10.3. SWOT Analysis
- 17.2.10.4. Recent Developments
- 17.2.10.5. Financials (Based on Availability)
- 17.2.11 Symboticware Inc
- 17.2.11.1. Overview
- 17.2.11.2. Products
- 17.2.11.3. SWOT Analysis
- 17.2.11.4. Recent Developments
- 17.2.11.5. Financials (Based on Availability)
- 17.2.12 SAP SE
- 17.2.12.1. Overview
- 17.2.12.2. Products
- 17.2.12.3. SWOT Analysis
- 17.2.12.4. Recent Developments
- 17.2.12.5. Financials (Based on Availability)
- 17.2.1 MineExcellence
List of Figures
- Figure 1: Global Smart Mining Market Revenue Breakdown (Million, %) by Region 2024 & 2032
- Figure 2: North America Smart Mining Market Revenue (Million), by Country 2024 & 2032
- Figure 3: North America Smart Mining Market Revenue Share (%), by Country 2024 & 2032
- Figure 4: Europe Smart Mining Market Revenue (Million), by Country 2024 & 2032
- Figure 5: Europe Smart Mining Market Revenue Share (%), by Country 2024 & 2032
- Figure 6: Asia Pacific Smart Mining Market Revenue (Million), by Country 2024 & 2032
- Figure 7: Asia Pacific Smart Mining Market Revenue Share (%), by Country 2024 & 2032
- Figure 8: South America Smart Mining Market Revenue (Million), by Country 2024 & 2032
- Figure 9: South America Smart Mining Market Revenue Share (%), by Country 2024 & 2032
- Figure 10: North America Smart Mining Market Revenue (Million), by Country 2024 & 2032
- Figure 11: North America Smart Mining Market Revenue Share (%), by Country 2024 & 2032
- Figure 12: MEA Smart Mining Market Revenue (Million), by Country 2024 & 2032
- Figure 13: MEA Smart Mining Market Revenue Share (%), by Country 2024 & 2032
- Figure 14: North America Smart Mining Market Revenue (Million), by Solution 2024 & 2032
- Figure 15: North America Smart Mining Market Revenue Share (%), by Solution 2024 & 2032
- Figure 16: North America Smart Mining Market Revenue (Million), by Service Type 2024 & 2032
- Figure 17: North America Smart Mining Market Revenue Share (%), by Service Type 2024 & 2032
- Figure 18: North America Smart Mining Market Revenue (Million), by Mining Type 2024 & 2032
- Figure 19: North America Smart Mining Market Revenue Share (%), by Mining Type 2024 & 2032
- Figure 20: North America Smart Mining Market Revenue (Million), by Country 2024 & 2032
- Figure 21: North America Smart Mining Market Revenue Share (%), by Country 2024 & 2032
- Figure 22: Europe Smart Mining Market Revenue (Million), by Solution 2024 & 2032
- Figure 23: Europe Smart Mining Market Revenue Share (%), by Solution 2024 & 2032
- Figure 24: Europe Smart Mining Market Revenue (Million), by Service Type 2024 & 2032
- Figure 25: Europe Smart Mining Market Revenue Share (%), by Service Type 2024 & 2032
- Figure 26: Europe Smart Mining Market Revenue (Million), by Mining Type 2024 & 2032
- Figure 27: Europe Smart Mining Market Revenue Share (%), by Mining Type 2024 & 2032
- Figure 28: Europe Smart Mining Market Revenue (Million), by Country 2024 & 2032
- Figure 29: Europe Smart Mining Market Revenue Share (%), by Country 2024 & 2032
- Figure 30: Asia Pacific Smart Mining Market Revenue (Million), by Solution 2024 & 2032
- Figure 31: Asia Pacific Smart Mining Market Revenue Share (%), by Solution 2024 & 2032
- Figure 32: Asia Pacific Smart Mining Market Revenue (Million), by Service Type 2024 & 2032
- Figure 33: Asia Pacific Smart Mining Market Revenue Share (%), by Service Type 2024 & 2032
- Figure 34: Asia Pacific Smart Mining Market Revenue (Million), by Mining Type 2024 & 2032
- Figure 35: Asia Pacific Smart Mining Market Revenue Share (%), by Mining Type 2024 & 2032
- Figure 36: Asia Pacific Smart Mining Market Revenue (Million), by Country 2024 & 2032
- Figure 37: Asia Pacific Smart Mining Market Revenue Share (%), by Country 2024 & 2032
- Figure 38: Latin America Smart Mining Market Revenue (Million), by Solution 2024 & 2032
- Figure 39: Latin America Smart Mining Market Revenue Share (%), by Solution 2024 & 2032
- Figure 40: Latin America Smart Mining Market Revenue (Million), by Service Type 2024 & 2032
- Figure 41: Latin America Smart Mining Market Revenue Share (%), by Service Type 2024 & 2032
- Figure 42: Latin America Smart Mining Market Revenue (Million), by Mining Type 2024 & 2032
- Figure 43: Latin America Smart Mining Market Revenue Share (%), by Mining Type 2024 & 2032
- Figure 44: Latin America Smart Mining Market Revenue (Million), by Country 2024 & 2032
- Figure 45: Latin America Smart Mining Market Revenue Share (%), by Country 2024 & 2032
- Figure 46: Middle East and Africa Smart Mining Market Revenue (Million), by Solution 2024 & 2032
- Figure 47: Middle East and Africa Smart Mining Market Revenue Share (%), by Solution 2024 & 2032
- Figure 48: Middle East and Africa Smart Mining Market Revenue (Million), by Service Type 2024 & 2032
- Figure 49: Middle East and Africa Smart Mining Market Revenue Share (%), by Service Type 2024 & 2032
- Figure 50: Middle East and Africa Smart Mining Market Revenue (Million), by Mining Type 2024 & 2032
- Figure 51: Middle East and Africa Smart Mining Market Revenue Share (%), by Mining Type 2024 & 2032
- Figure 52: Middle East and Africa Smart Mining Market Revenue (Million), by Country 2024 & 2032
- Figure 53: Middle East and Africa Smart Mining Market Revenue Share (%), by Country 2024 & 2032
List of Tables
- Table 1: Global Smart Mining Market Revenue Million Forecast, by Region 2019 & 2032
- Table 2: Global Smart Mining Market Revenue Million Forecast, by Solution 2019 & 2032
- Table 3: Global Smart Mining Market Revenue Million Forecast, by Service Type 2019 & 2032
- Table 4: Global Smart Mining Market Revenue Million Forecast, by Mining Type 2019 & 2032
- Table 5: Global Smart Mining Market Revenue Million Forecast, by Region 2019 & 2032
- Table 6: Global Smart Mining Market Revenue Million Forecast, by Country 2019 & 2032
- Table 7: United States Smart Mining Market Revenue (Million) Forecast, by Application 2019 & 2032
- Table 8: Canada Smart Mining Market Revenue (Million) Forecast, by Application 2019 & 2032
- Table 9: Mexico Smart Mining Market Revenue (Million) Forecast, by Application 2019 & 2032
- Table 10: Global Smart Mining Market Revenue Million Forecast, by Country 2019 & 2032
- Table 11: Germany Smart Mining Market Revenue (Million) Forecast, by Application 2019 & 2032
- Table 12: United Kingdom Smart Mining Market Revenue (Million) Forecast, by Application 2019 & 2032
- Table 13: France Smart Mining Market Revenue (Million) Forecast, by Application 2019 & 2032
- Table 14: Spain Smart Mining Market Revenue (Million) Forecast, by Application 2019 & 2032
- Table 15: Italy Smart Mining Market Revenue (Million) Forecast, by Application 2019 & 2032
- Table 16: Spain Smart Mining Market Revenue (Million) Forecast, by Application 2019 & 2032
- Table 17: Belgium Smart Mining Market Revenue (Million) Forecast, by Application 2019 & 2032
- Table 18: Netherland Smart Mining Market Revenue (Million) Forecast, by Application 2019 & 2032
- Table 19: Nordics Smart Mining Market Revenue (Million) Forecast, by Application 2019 & 2032
- Table 20: Rest of Europe Smart Mining Market Revenue (Million) Forecast, by Application 2019 & 2032
- Table 21: Global Smart Mining Market Revenue Million Forecast, by Country 2019 & 2032
- Table 22: China Smart Mining Market Revenue (Million) Forecast, by Application 2019 & 2032
- Table 23: Japan Smart Mining Market Revenue (Million) Forecast, by Application 2019 & 2032
- Table 24: India Smart Mining Market Revenue (Million) Forecast, by Application 2019 & 2032
- Table 25: South Korea Smart Mining Market Revenue (Million) Forecast, by Application 2019 & 2032
- Table 26: Southeast Asia Smart Mining Market Revenue (Million) Forecast, by Application 2019 & 2032
- Table 27: Australia Smart Mining Market Revenue (Million) Forecast, by Application 2019 & 2032
- Table 28: Indonesia Smart Mining Market Revenue (Million) Forecast, by Application 2019 & 2032
- Table 29: Phillipes Smart Mining Market Revenue (Million) Forecast, by Application 2019 & 2032
- Table 30: Singapore Smart Mining Market Revenue (Million) Forecast, by Application 2019 & 2032
- Table 31: Thailandc Smart Mining Market Revenue (Million) Forecast, by Application 2019 & 2032
- Table 32: Rest of Asia Pacific Smart Mining Market Revenue (Million) Forecast, by Application 2019 & 2032
- Table 33: Global Smart Mining Market Revenue Million Forecast, by Country 2019 & 2032
- Table 34: Brazil Smart Mining Market Revenue (Million) Forecast, by Application 2019 & 2032
- Table 35: Argentina Smart Mining Market Revenue (Million) Forecast, by Application 2019 & 2032
- Table 36: Peru Smart Mining Market Revenue (Million) Forecast, by Application 2019 & 2032
- Table 37: Chile Smart Mining Market Revenue (Million) Forecast, by Application 2019 & 2032
- Table 38: Colombia Smart Mining Market Revenue (Million) Forecast, by Application 2019 & 2032
- Table 39: Ecuador Smart Mining Market Revenue (Million) Forecast, by Application 2019 & 2032
- Table 40: Venezuela Smart Mining Market Revenue (Million) Forecast, by Application 2019 & 2032
- Table 41: Rest of South America Smart Mining Market Revenue (Million) Forecast, by Application 2019 & 2032
- Table 42: Global Smart Mining Market Revenue Million Forecast, by Country 2019 & 2032
- Table 43: United States Smart Mining Market Revenue (Million) Forecast, by Application 2019 & 2032
- Table 44: Canada Smart Mining Market Revenue (Million) Forecast, by Application 2019 & 2032
- Table 45: Mexico Smart Mining Market Revenue (Million) Forecast, by Application 2019 & 2032
- Table 46: Global Smart Mining Market Revenue Million Forecast, by Country 2019 & 2032
- Table 47: United Arab Emirates Smart Mining Market Revenue (Million) Forecast, by Application 2019 & 2032
- Table 48: Saudi Arabia Smart Mining Market Revenue (Million) Forecast, by Application 2019 & 2032
- Table 49: South Africa Smart Mining Market Revenue (Million) Forecast, by Application 2019 & 2032
- Table 50: Rest of Middle East and Africa Smart Mining Market Revenue (Million) Forecast, by Application 2019 & 2032
- Table 51: Global Smart Mining Market Revenue Million Forecast, by Solution 2019 & 2032
- Table 52: Global Smart Mining Market Revenue Million Forecast, by Service Type 2019 & 2032
- Table 53: Global Smart Mining Market Revenue Million Forecast, by Mining Type 2019 & 2032
- Table 54: Global Smart Mining Market Revenue Million Forecast, by Country 2019 & 2032
- Table 55: Global Smart Mining Market Revenue Million Forecast, by Solution 2019 & 2032
- Table 56: Global Smart Mining Market Revenue Million Forecast, by Service Type 2019 & 2032
- Table 57: Global Smart Mining Market Revenue Million Forecast, by Mining Type 2019 & 2032
- Table 58: Global Smart Mining Market Revenue Million Forecast, by Country 2019 & 2032
- Table 59: Global Smart Mining Market Revenue Million Forecast, by Solution 2019 & 2032
- Table 60: Global Smart Mining Market Revenue Million Forecast, by Service Type 2019 & 2032
- Table 61: Global Smart Mining Market Revenue Million Forecast, by Mining Type 2019 & 2032
- Table 62: Global Smart Mining Market Revenue Million Forecast, by Country 2019 & 2032
- Table 63: Global Smart Mining Market Revenue Million Forecast, by Solution 2019 & 2032
- Table 64: Global Smart Mining Market Revenue Million Forecast, by Service Type 2019 & 2032
- Table 65: Global Smart Mining Market Revenue Million Forecast, by Mining Type 2019 & 2032
- Table 66: Global Smart Mining Market Revenue Million Forecast, by Country 2019 & 2032
- Table 67: Global Smart Mining Market Revenue Million Forecast, by Solution 2019 & 2032
- Table 68: Global Smart Mining Market Revenue Million Forecast, by Service Type 2019 & 2032
- Table 69: Global Smart Mining Market Revenue Million Forecast, by Mining Type 2019 & 2032
- Table 70: Global Smart Mining Market Revenue Million Forecast, by Country 2019 & 2032
Frequently Asked Questions
1. What is the projected Compound Annual Growth Rate (CAGR) of the Smart Mining Market?
The projected CAGR is approximately 0.21%.
2. Which companies are prominent players in the Smart Mining Market?
Key companies in the market include MineExcellence, Komatsu Mining Corporation (Joy Global), ABB Ltd, IBM Corporation, Epiroc AB, Cisco Systems Inc, Wenco International Mining Systems Ltd, Metso Outotec OYJ, Rockwell Automation Inc, Trimble Inc, Symboticware Inc, SAP SE.
3. What are the main segments of the Smart Mining Market?
The market segments include Solution, Service Type, Mining Type.
4. Can you provide details about the market size?
The market size is estimated to be USD 34.16 Million as of 2022.
5. What are some drivers contributing to market growth?
Rising Adoption of Wireless Monitoring and Centralized Solutions among Several Large Mining Installations; Technological Advancements and Convergence of Various Digital Transformation Practices.
6. What are the notable trends driving market growth?
Data Management and Analytics Software is Expected to Show Highest Growth.
7. Are there any restraints impacting market growth?
Operational and Cost Challenges Remain a Concern in Emerging Regions; Workers Safety and Health.
8. Can you provide examples of recent developments in the market?
June 2022 - Metso Outotec collaborated with Dynamox on using Dynamox's condition monitoring platform in mining and aggregating processes. Metso Outotec is offering the solution to the company's installed equipment base. Dynamox is an addition to Metso Outotec's partner ecosystem and helps develop and provide easy-to-use and sustainable digital solutions to customers. The company is further upgrading in mining using AI and analytics solutions.
9. What pricing options are available for accessing the report?
Pricing options include single-user, multi-user, and enterprise licenses priced at USD 4750, USD 5250, and USD 8750 respectively.
10. Is the market size provided in terms of value or volume?
The market size is provided in terms of value, measured in Million.
11. Are there any specific market keywords associated with the report?
Yes, the market keyword associated with the report is "Smart Mining Market," which aids in identifying and referencing the specific market segment covered.
12. How do I determine which pricing option suits my needs best?
The pricing options vary based on user requirements and access needs. Individual users may opt for single-user licenses, while businesses requiring broader access may choose multi-user or enterprise licenses for cost-effective access to the report.
13. Are there any additional resources or data provided in the Smart Mining Market report?
While the report offers comprehensive insights, it's advisable to review the specific contents or supplementary materials provided to ascertain if additional resources or data are available.
14. How can I stay updated on further developments or reports in the Smart Mining Market?
To stay informed about further developments, trends, and reports in the Smart Mining Market, consider subscribing to industry newsletters, following relevant companies and organizations, or regularly checking reputable industry news sources and publications.
Methodology
Step 1 - Identification of Relevant Samples Size from Population Database


Step 2 - Approaches for Defining Global Market Size (Value, Volume* & Price*)

Note*: In applicable scenarios
Step 3 - Data Sources
Primary Research
- Web Analytics
- Survey Reports
- Research Institute
- Latest Research Reports
- Opinion Leaders
Secondary Research
- Annual Reports
- White Paper
- Latest Press Release
- Industry Association
- Paid Database
- Investor Presentations

Step 4 - Data Triangulation
Involves using different sources of information in order to increase the validity of a study
These sources are likely to be stakeholders in a program - participants, other researchers, program staff, other community members, and so on.
Then we put all data in single framework & apply various statistical tools to find out the dynamic on the market.
During the analysis stage, feedback from the stakeholder groups would be compared to determine areas of agreement as well as areas of divergence


