Smartphone Camera Lenses Industry Market Overview: Growth and Insights

Smartphone Camera Lenses Industry by Production Analysis, by Consumption Analysis, by Import Market Analysis (Value & Volume), by Export Market Analysis (Value & Volume), by Price Trend Analysis, by Asia Pacific, by Americas, by Europe, by Rest of the World Forecast 2025-2033

Jul 9 2025
Base Year: 2024

234 Pages
Main Logo

Smartphone Camera Lenses Industry Market Overview: Growth and Insights


Home
Industries
Technology, Media and Telecom
sponsor image
sponsor image
sponsor image
sponsor image
sponsor image
sponsor image
sponsor image
sponsor image
sponsor image
sponsor image
sponsor image
sponsor image
sponsor image
sponsor image
sponsor image
sponsor image
sponsor image
sponsor image
sponsor image
sponsor image

Tailored for you

  • In-depth Analysis Tailored to Specified Regions or Segments
  • Company Profiles Customized to User Preferences
  • Comprehensive Insights Focused on Specific Segments or Regions
  • Customized Evaluation of Competitive Landscape to Meet Your Needs
  • Tailored Customization to Address Other Specific Requirements
Ask for customization


Key Insights

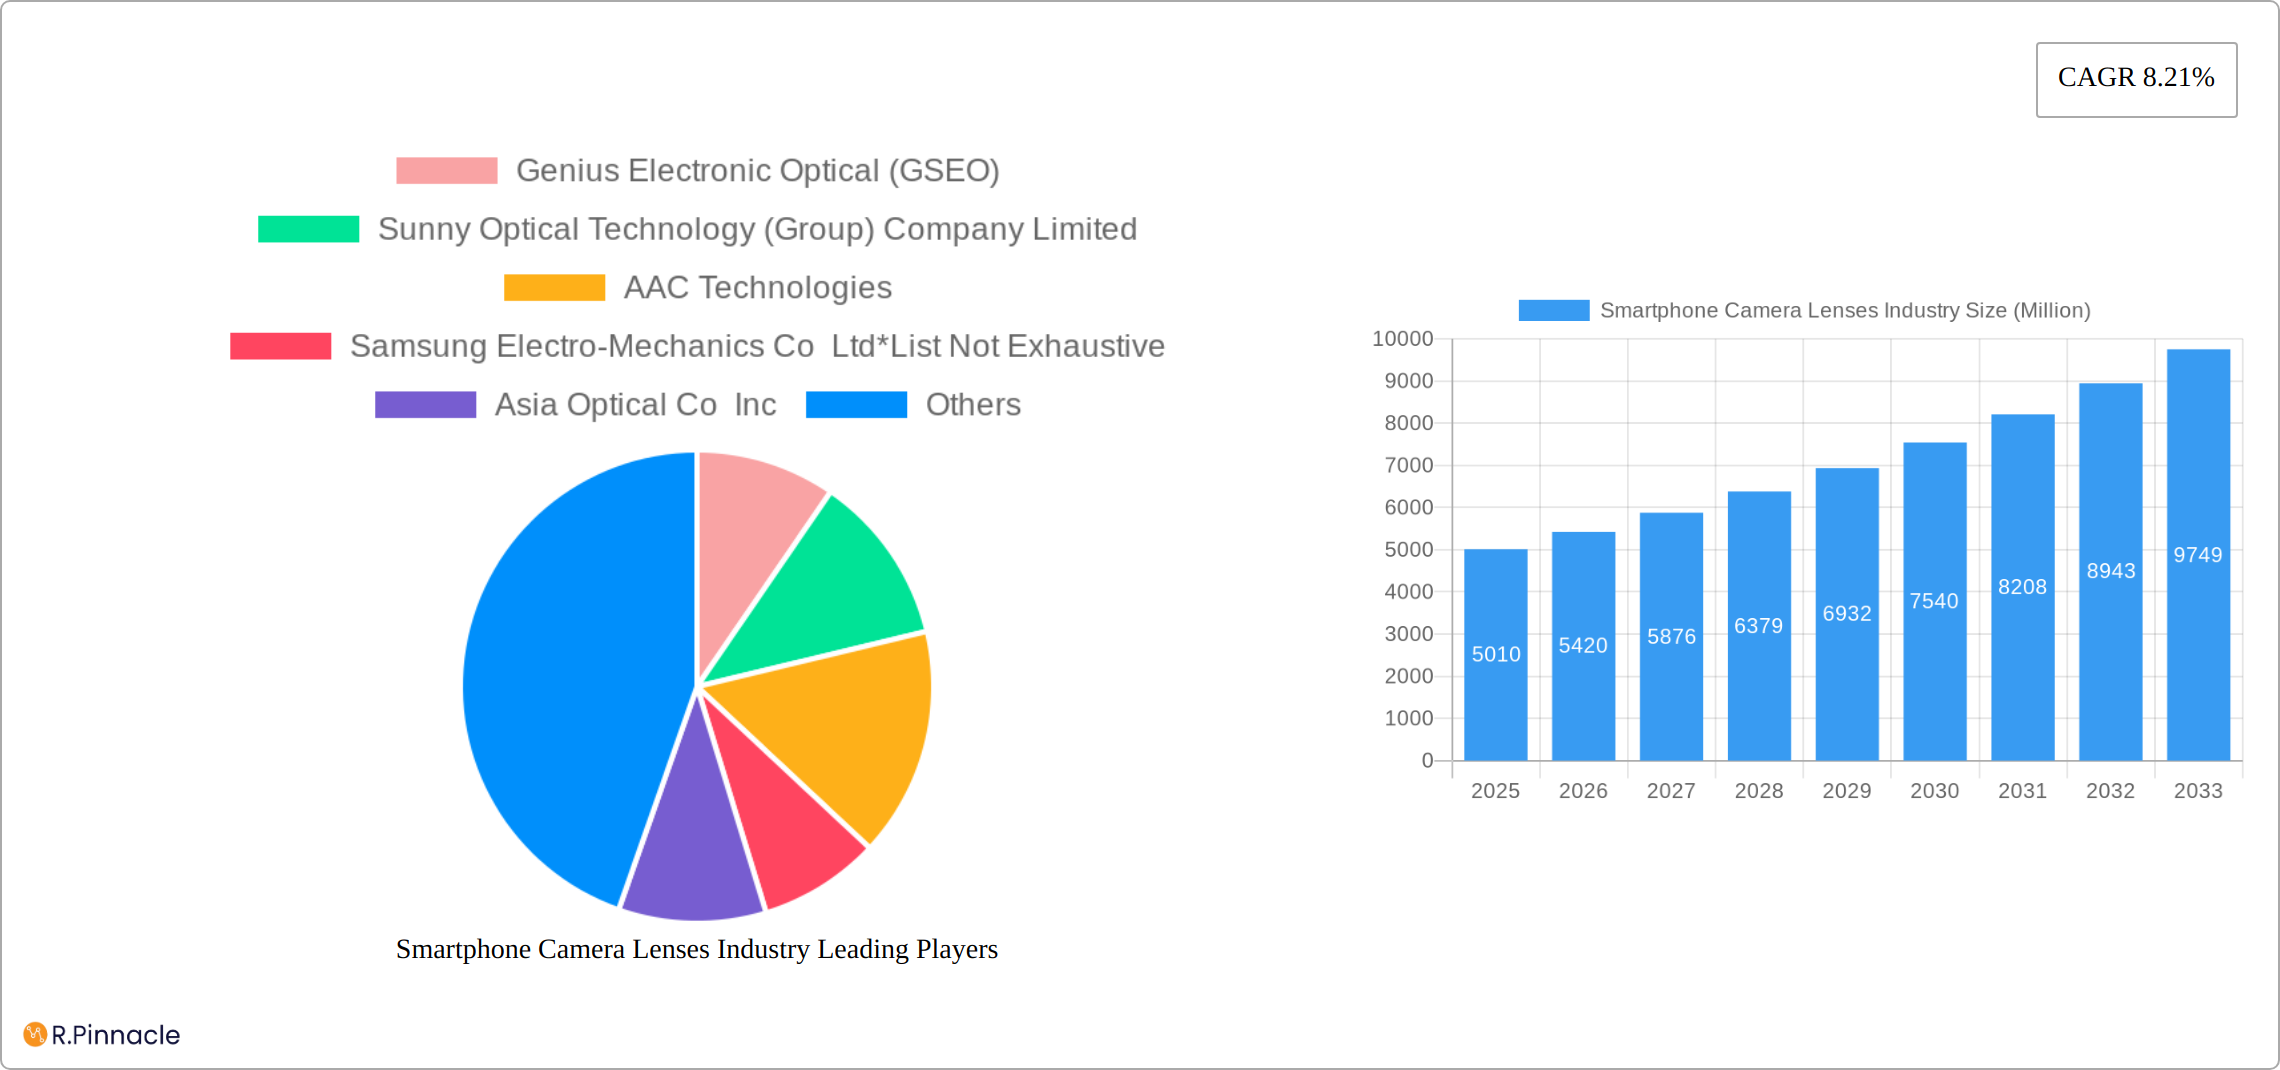
The global smartphone camera lens market, valued at $5.01 billion in 2025, is projected to experience robust growth, driven by several key factors. The increasing demand for high-resolution cameras in smartphones, fueled by advancements in mobile photography and videography, is a primary driver. Consumers increasingly prioritize camera quality when selecting a smartphone, creating significant demand for advanced lens technologies. Further propelling market expansion are ongoing innovations in lens design, including the development of ultra-wide, telephoto, and periscope lenses that enhance image capture capabilities. The integration of artificial intelligence (AI) and computational photography features further enhances the functionality and appeal of sophisticated camera systems, creating a positive feedback loop of innovation and consumer demand. Market segmentation reveals significant growth potential across lens types, with wide-angle and telephoto lenses leading the way due to their versatile applications in capturing various scenes and subjects. The smartphone segment within the end-use market dominates, owing to the prevalence of smartphones as the primary device for photo and video capture. While technological advancements and consumer preferences drive growth, potential restraints include supply chain disruptions and the increasing competition among lens manufacturers. However, the overall market outlook remains optimistic, with continuous innovation and growing consumer demand expected to outweigh these challenges.

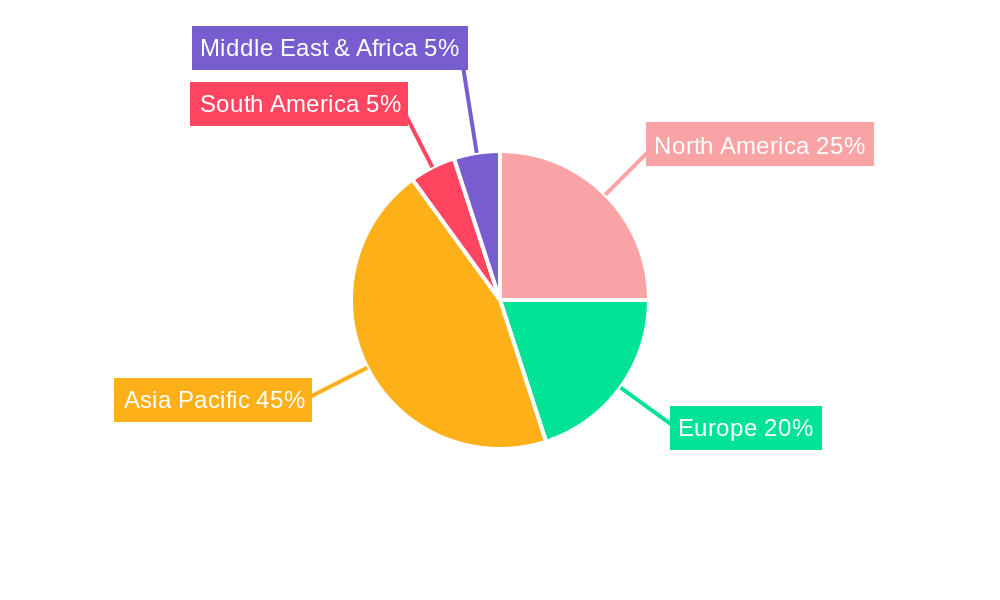
The Asia-Pacific region, particularly China, currently holds a significant market share, driven by the high concentration of smartphone manufacturing and a large consumer base. However, North America and Europe are also witnessing notable growth due to increasing smartphone adoption and the rising popularity of advanced mobile photography. Companies like Sunny Optical, Largan Precision, and LG Innotek are key players, leveraging their technological expertise and manufacturing capabilities to cater to the growing demand. The forecast period of 2025-2033 anticipates sustained growth, with the CAGR of 8.21% suggesting a considerable market expansion. This growth will be fueled by the continued integration of advanced features like multi-lens systems, improved image stabilization, and enhanced low-light performance, attracting consumers and creating a dynamic competitive landscape. Future market success will depend on manufacturers' ability to innovate quickly, optimize production costs, and meet the evolving demands of the smartphone industry.

Smartphone Camera Lenses Industry Research Report - Market Size, Growth & Forecast

Smartphone Camera Lenses Industry Market Report: 2019-2033

This comprehensive report provides an in-depth analysis of the global Smartphone Camera Lenses industry, offering valuable insights for industry professionals, investors, and strategists. Covering the period 2019-2033, with a focus on 2025, this report forecasts robust growth driven by technological advancements and evolving consumer preferences. The report delves into market structure, competitive dynamics, regional performance, and emerging opportunities, offering actionable intelligence for informed decision-making.

Smartphone Camera Lenses Industry Market Structure & Innovation Trends

The smartphone camera lens market exhibits a moderately concentrated structure, dominated by key players such as Genius Electronic Optical (GSEO), Sunny Optical Technology, AAC Technologies, and Samsung Electro-Mechanics. While these companies hold significant market share, a substantial number of smaller players contribute to the dynamic market landscape. Preliminary 2024 market share estimates suggest Sunny Optical holds approximately xx%, followed by Largan Precision at xx%, and GSEO at xx%. The remaining share is distributed among other major players and numerous smaller entities. Driving this market is relentless innovation, characterized by continuous advancements in lens technology. These include substantial improvements in image quality, enhanced zoom capabilities across a wider range of focal lengths, and the increasing integration of sophisticated AI-powered features for image processing and enhancement. Stringent regulatory frameworks, particularly those concerning sustainable material sourcing and environmental standards, are significantly shaping manufacturing processes and product designs. The market also displays considerable mergers and acquisitions (M&A) activity, with deal values exceeding $xx million in the past five years, reflecting strategic consolidation and expansion efforts within the industry. Although software-based image enhancement technologies are emerging as potential substitutes, their impact on the core lens market remains limited at present. Finally, end-user demographics are strongly correlated with global smartphone penetration rates and the ever-growing consumer demand for high-quality mobile photography experiences.

  • Market Concentration: Moderately concentrated, with leading players commanding substantial shares.
  • Innovation Drivers: Enhanced image quality, advanced zoom functionalities (including periscope and liquid lenses), and AI-driven image processing.
  • M&A Activity: Significant activity with deal values exceeding $xx million in recent years, indicating industry consolidation.
  • Regulatory Landscape: Stringent regulations impacting sustainable material sourcing and environmental compliance.
  • Product Substitutes: Software-based image enhancement technologies are emerging, but their impact is currently limited.
  • End-user Demographics: Driven by increasing smartphone penetration and the desire for superior mobile photography.

Smartphone Camera Lenses Industry Market Dynamics & Trends

The smartphone camera lens market displays robust growth potential, fueled by the escalating demand for high-resolution cameras in smartphones, tablets, and even laptops. The projected Compound Annual Growth Rate (CAGR) for the forecast period (2025-2033) is estimated at xx%, surpassing the historical CAGR of xx% (2019-2024). Significant technological disruptions, such as the development and adoption of advanced lens technologies like periscope and liquid lenses, are fundamentally reshaping the market landscape. These innovations are directly contributing to substantial improvements in image quality and zoom capabilities. Consumer preferences are clearly shifting towards the versatility and enhanced photographic performance offered by multi-camera setups. The competitive landscape remains intensely competitive, with leading players aggressively focusing on innovation, cost optimization, and strategic partnerships to secure and maintain their respective market shares. The market penetration of advanced lens technologies like periscope lenses is experiencing rapid growth, with an estimated xx% penetration rate in high-end smartphones projected for 2025.

Dominant Regions & Segments in Smartphone Camera Lenses Industry

Asia, particularly China, dominates the Smartphone Camera Lenses market, driven by a large smartphone manufacturing base, robust electronics supply chains, and favorable economic policies. Within lens types, wide-angle lenses hold the largest market share due to their prevalence in most smartphone cameras. The smartphone segment accounts for the largest portion of end-use applications.

  • Key Drivers for Asia's Dominance:
    • Large smartphone manufacturing base.
    • Robust electronics supply chains.
    • Favorable economic policies and government support.
  • Wide-Angle Lenses: Largest market share due to high prevalence in smartphones.
  • Smartphone Segment: Largest end-use application.

Smartphone Camera Lenses Industry Product Innovations

Recent innovations in Smartphone Camera Lenses include periscope lenses enabling superior optical zoom, liquid lenses offering autofocus adjustment, and improved sensor integration for enhanced image processing. These developments cater to the growing demand for high-quality photography features in mobile devices, providing competitive advantages through differentiation and superior image capabilities. The integration of AI algorithms further enhances image processing and offers features such as enhanced low-light performance and scene recognition.

Report Scope & Segmentation Analysis

This report segments the Smartphone Camera Lenses market by lens type (Wide-angle Lenses, Telephoto Lenses, Macro Lenses, Fixed-Focus Lenses) and by end-use (Smartphones, Tablets, Laptops). Each segment is analyzed based on market size, growth projections, and competitive dynamics. For instance, the wide-angle lens segment is expected to witness substantial growth due to its broad applicability across various mobile devices. The smartphone segment continues to dominate, while the tablet and laptop segments are projected to show steady growth. Market sizes in 2025 for each segment are estimated as follows: Wide-angle lenses - $xx Million, Telephoto Lenses - $xx Million, Macro lenses - $xx Million, Fixed-focus lenses - $xx Million.

Key Drivers of Smartphone Camera Lenses Industry Growth

The expansion of the smartphone camera lens industry is driven by several key factors. The global proliferation of smartphones is a primary driver, creating a massive and ever-increasing demand for high-quality camera components. Simultaneously, continuous technological advancements, encompassing improved lens designs and sophisticated AI-powered image processing capabilities, are enhancing the performance and appeal of smartphone cameras, further stimulating consumer demand. Furthermore, favorable economic conditions in major markets are contributing to increased consumer spending on electronics, including smartphones equipped with advanced camera features.

Challenges in the Smartphone Camera Lenses Industry Sector

The Smartphone Camera Lenses industry faces challenges, including intense competition, supply chain disruptions, and the increasing complexity of lens manufacturing. Price pressures from smartphone manufacturers can squeeze profit margins, while geopolitical uncertainties and material shortages can impact production and delivery timelines. Moreover, fluctuating demand due to economic downturns and technological obsolescence remain significant risks. These issues collectively impact the industry's profitability and long-term sustainability.

Emerging Opportunities in Smartphone Camera Lenses Industry

The Smartphone Camera Lenses market presents several exciting opportunities. The growing adoption of augmented reality (AR) and virtual reality (VR) technologies necessitates high-quality camera lenses, driving innovation in this area. Moreover, the development of more sustainable and eco-friendly lens manufacturing processes is gaining importance, creating opportunities for environmentally conscious companies. Expansion into developing markets with increasing smartphone penetration rates also presents significant growth potential.

Leading Players in the Smartphone Camera Lenses Industry Market

  • Genius Electronic Optical (GSEO)
  • Sunny Optical Technology (Group) Company Limited
  • AAC Technologies
  • Samsung Electro-Mechanics Co Ltd
  • Asia Optical Co Inc
  • Ofilm Group Co Ltd
  • Largan Precision Company Limited
  • SEKONIX Co Ltd
  • Kantatsu Co Ltd (Sharp Corporation)
  • Haesung Optics Co Ltd
  • LG Innotek
  • Kinko Optical Co Ltd

Key Developments in Smartphone Camera Lenses Industry Industry

  • October 2023: Google's Pixel 8 series launch showcases AI-powered features enhancing group photo selection and image manipulation. Samsung's Galaxy S22 Ultra utilizes approximately 60 AI models for advanced camera functions, achieving DSLR-quality night photos. This signifies a shift towards AI-driven image enhancement as a key differentiator in the market.
  • April 2023: OnePlus Nord CE 3 Lite launch with triple camera sensors, and the growing popularity of quad-camera smartphones indicate a trend towards multi-camera systems in the mid-range and budget smartphone segments. This signals an increase in demand across all camera lens types.

Future Outlook for Smartphone Camera Lenses Industry Market

The Smartphone Camera Lenses market is poised for sustained growth, driven by ongoing technological advancements and the increasing integration of AI in mobile photography. New market segments, such as AR/VR applications and automotive cameras, are expected to create new growth avenues. Companies focusing on innovation, efficient supply chains, and sustainable manufacturing practices will be best positioned to capitalize on future opportunities and maintain market leadership.

Smartphone Camera Lenses Industry Segmentation

  • 1. Production Analysis
  • 2. Consumption Analysis
  • 3. Import Market Analysis (Value & Volume)
  • 4. Export Market Analysis (Value & Volume)
  • 5. Price Trend Analysis

Smartphone Camera Lenses Industry Segmentation By Geography

  • 1. Asia Pacific
  • 2. Americas
  • 3. Europe
  • 4. Rest of the World
Smartphone Camera Lenses Industry Regional Share


Smartphone Camera Lenses Industry REPORT HIGHLIGHTS

AspectsDetails
Study Period 2019-2033
Base Year 2024
Estimated Year 2025
Forecast Period2025-2033
Historical Period2019-2024
Growth RateCAGR of 8.21% from 2019-2033
Segmentation
    • By Production Analysis
    • By Consumption Analysis
    • By Import Market Analysis (Value & Volume)
    • By Export Market Analysis (Value & Volume)
    • By Price Trend Analysis
  • By Geography
    • Asia Pacific
    • Americas
    • Europe
    • Rest of the World


Table of Contents

  1. 1. Introduction
    • 1.1. Research Scope
    • 1.2. Market Segmentation
    • 1.3. Research Methodology
    • 1.4. Definitions and Assumptions
  2. 2. Executive Summary
    • 2.1. Introduction
  3. 3. Market Dynamics
    • 3.1. Introduction
      • 3.2. Market Drivers
        • 3.2.1. Increasing Popularity of Multiple Camera Smartphones and the Introduction of Advanced Camera Technologies
      • 3.3. Market Restrains
        • 3.3.1. Slow Down of Smartphone Sales and Increasing Pricing Competition
      • 3.4. Market Trends
        • 3.4.1. Increasing Popularity of Multiple Camera Smartphones and the Introduction of Advanced Camera Technologies will Drive the Market
  4. 4. Market Factor Analysis
    • 4.1. Porters Five Forces
    • 4.2. Supply/Value Chain
    • 4.3. PESTEL analysis
    • 4.4. Market Entropy
    • 4.5. Patent/Trademark Analysis
  5. 5. Global Smartphone Camera Lenses Industry Analysis, Insights and Forecast, 2019-2031
    • 5.1. Market Analysis, Insights and Forecast - by Production Analysis
      • 5.2. Market Analysis, Insights and Forecast - by Consumption Analysis
        • 5.3. Market Analysis, Insights and Forecast - by Import Market Analysis (Value & Volume)
          • 5.4. Market Analysis, Insights and Forecast - by Export Market Analysis (Value & Volume)
            • 5.5. Market Analysis, Insights and Forecast - by Price Trend Analysis
              • 5.6. Market Analysis, Insights and Forecast - by Region
                • 5.6.1. Asia Pacific
                • 5.6.2. Americas
                • 5.6.3. Europe
                • 5.6.4. Rest of the World
            • 6. Asia Pacific Smartphone Camera Lenses Industry Analysis, Insights and Forecast, 2019-2031
              • 6.1. Market Analysis, Insights and Forecast - by Production Analysis
                • 6.2. Market Analysis, Insights and Forecast - by Consumption Analysis
                  • 6.3. Market Analysis, Insights and Forecast - by Import Market Analysis (Value & Volume)
                    • 6.4. Market Analysis, Insights and Forecast - by Export Market Analysis (Value & Volume)
                      • 6.5. Market Analysis, Insights and Forecast - by Price Trend Analysis
                      • 7. Americas Smartphone Camera Lenses Industry Analysis, Insights and Forecast, 2019-2031
                        • 7.1. Market Analysis, Insights and Forecast - by Production Analysis
                          • 7.2. Market Analysis, Insights and Forecast - by Consumption Analysis
                            • 7.3. Market Analysis, Insights and Forecast - by Import Market Analysis (Value & Volume)
                              • 7.4. Market Analysis, Insights and Forecast - by Export Market Analysis (Value & Volume)
                                • 7.5. Market Analysis, Insights and Forecast - by Price Trend Analysis
                                • 8. Europe Smartphone Camera Lenses Industry Analysis, Insights and Forecast, 2019-2031
                                  • 8.1. Market Analysis, Insights and Forecast - by Production Analysis
                                    • 8.2. Market Analysis, Insights and Forecast - by Consumption Analysis
                                      • 8.3. Market Analysis, Insights and Forecast - by Import Market Analysis (Value & Volume)
                                        • 8.4. Market Analysis, Insights and Forecast - by Export Market Analysis (Value & Volume)
                                          • 8.5. Market Analysis, Insights and Forecast - by Price Trend Analysis
                                          • 9. Rest of the World Smartphone Camera Lenses Industry Analysis, Insights and Forecast, 2019-2031
                                            • 9.1. Market Analysis, Insights and Forecast - by Production Analysis
                                              • 9.2. Market Analysis, Insights and Forecast - by Consumption Analysis
                                                • 9.3. Market Analysis, Insights and Forecast - by Import Market Analysis (Value & Volume)
                                                  • 9.4. Market Analysis, Insights and Forecast - by Export Market Analysis (Value & Volume)
                                                    • 9.5. Market Analysis, Insights and Forecast - by Price Trend Analysis
                                                    • 10. Asia Pacific Smartphone Camera Lenses Industry Analysis, Insights and Forecast, 2019-2031
                                                        • 10.1. Market Analysis, Insights and Forecast - By Country/Sub-region
                                                          • 10.1.1 China
                                                          • 10.1.2 Japan
                                                          • 10.1.3 India
                                                          • 10.1.4 South Korea
                                                          • 10.1.5 Taiwan
                                                          • 10.1.6 Australia
                                                          • 10.1.7 Rest of Asia-Pacific
                                                    • 11. North America Smartphone Camera Lenses Industry Analysis, Insights and Forecast, 2019-2031
                                                        • 11.1. Market Analysis, Insights and Forecast - By Country/Sub-region
                                                          • 11.1.1 United States
                                                          • 11.1.2 Canada
                                                          • 11.1.3 Mexico
                                                    • 12. Europe Smartphone Camera Lenses Industry Analysis, Insights and Forecast, 2019-2031
                                                        • 12.1. Market Analysis, Insights and Forecast - By Country/Sub-region
                                                          • 12.1.1 Germany
                                                          • 12.1.2 France
                                                          • 12.1.3 Italy
                                                          • 12.1.4 United Kingdom
                                                          • 12.1.5 Netherlands
                                                          • 12.1.6 Sweden
                                                          • 12.1.7 Rest of Europe
                                                    • 13. South America Smartphone Camera Lenses Industry Analysis, Insights and Forecast, 2019-2031
                                                        • 13.1. Market Analysis, Insights and Forecast - By Country/Sub-region
                                                          • 13.1.1 Brazil
                                                          • 13.1.2 Argentina
                                                          • 13.1.3 Rest of South America
                                                    • 14. Middle East & Africa Smartphone Camera Lenses Industry Analysis, Insights and Forecast, 2019-2031
                                                        • 14.1. Market Analysis, Insights and Forecast - By Country/Sub-region
                                                          • 14.1.1 UAE
                                                          • 14.1.2 South Africa
                                                          • 14.1.3 Saudi Arabia
                                                          • 14.1.4 Rest of MEA
                                                    • 15. Competitive Analysis
                                                      • 15.1. Global Market Share Analysis 2024
                                                        • 15.2. Company Profiles
                                                          • 15.2.1 Genius Electronic Optical (GSEO)
                                                            • 15.2.1.1. Overview
                                                            • 15.2.1.2. Products
                                                            • 15.2.1.3. SWOT Analysis
                                                            • 15.2.1.4. Recent Developments
                                                            • 15.2.1.5. Financials (Based on Availability)
                                                          • 15.2.2 Sunny Optical Technology (Group) Company Limited
                                                            • 15.2.2.1. Overview
                                                            • 15.2.2.2. Products
                                                            • 15.2.2.3. SWOT Analysis
                                                            • 15.2.2.4. Recent Developments
                                                            • 15.2.2.5. Financials (Based on Availability)
                                                          • 15.2.3 AAC Technologies
                                                            • 15.2.3.1. Overview
                                                            • 15.2.3.2. Products
                                                            • 15.2.3.3. SWOT Analysis
                                                            • 15.2.3.4. Recent Developments
                                                            • 15.2.3.5. Financials (Based on Availability)
                                                          • 15.2.4 Samsung Electro-Mechanics Co Ltd*List Not Exhaustive
                                                            • 15.2.4.1. Overview
                                                            • 15.2.4.2. Products
                                                            • 15.2.4.3. SWOT Analysis
                                                            • 15.2.4.4. Recent Developments
                                                            • 15.2.4.5. Financials (Based on Availability)
                                                          • 15.2.5 Asia Optical Co Inc
                                                            • 15.2.5.1. Overview
                                                            • 15.2.5.2. Products
                                                            • 15.2.5.3. SWOT Analysis
                                                            • 15.2.5.4. Recent Developments
                                                            • 15.2.5.5. Financials (Based on Availability)
                                                          • 15.2.6 Ofilm Group Co Ltd
                                                            • 15.2.6.1. Overview
                                                            • 15.2.6.2. Products
                                                            • 15.2.6.3. SWOT Analysis
                                                            • 15.2.6.4. Recent Developments
                                                            • 15.2.6.5. Financials (Based on Availability)
                                                          • 15.2.7 Largan Precision Company Limited
                                                            • 15.2.7.1. Overview
                                                            • 15.2.7.2. Products
                                                            • 15.2.7.3. SWOT Analysis
                                                            • 15.2.7.4. Recent Developments
                                                            • 15.2.7.5. Financials (Based on Availability)
                                                          • 15.2.8 SEKONIX Co Ltd
                                                            • 15.2.8.1. Overview
                                                            • 15.2.8.2. Products
                                                            • 15.2.8.3. SWOT Analysis
                                                            • 15.2.8.4. Recent Developments
                                                            • 15.2.8.5. Financials (Based on Availability)
                                                          • 15.2.9 Kantatsu Co Ltd (Sharp Corporation
                                                            • 15.2.9.1. Overview
                                                            • 15.2.9.2. Products
                                                            • 15.2.9.3. SWOT Analysis
                                                            • 15.2.9.4. Recent Developments
                                                            • 15.2.9.5. Financials (Based on Availability)
                                                          • 15.2.10 Haesung Optics Co Ltd
                                                            • 15.2.10.1. Overview
                                                            • 15.2.10.2. Products
                                                            • 15.2.10.3. SWOT Analysis
                                                            • 15.2.10.4. Recent Developments
                                                            • 15.2.10.5. Financials (Based on Availability)
                                                          • 15.2.11 LG Innotek
                                                            • 15.2.11.1. Overview
                                                            • 15.2.11.2. Products
                                                            • 15.2.11.3. SWOT Analysis
                                                            • 15.2.11.4. Recent Developments
                                                            • 15.2.11.5. Financials (Based on Availability)
                                                          • 15.2.12 Kinko Optical Co Ltd
                                                            • 15.2.12.1. Overview
                                                            • 15.2.12.2. Products
                                                            • 15.2.12.3. SWOT Analysis
                                                            • 15.2.12.4. Recent Developments
                                                            • 15.2.12.5. Financials (Based on Availability)

                                                    List of Figures

                                                    1. Figure 1: Global Smartphone Camera Lenses Industry Revenue Breakdown (Million, %) by Region 2024 & 2032
                                                    2. Figure 2: Asia Pacific Smartphone Camera Lenses Industry Revenue (Million), by Country 2024 & 2032
                                                    3. Figure 3: Asia Pacific Smartphone Camera Lenses Industry Revenue Share (%), by Country 2024 & 2032
                                                    4. Figure 4: North America Smartphone Camera Lenses Industry Revenue (Million), by Country 2024 & 2032
                                                    5. Figure 5: North America Smartphone Camera Lenses Industry Revenue Share (%), by Country 2024 & 2032
                                                    6. Figure 6: Europe Smartphone Camera Lenses Industry Revenue (Million), by Country 2024 & 2032
                                                    7. Figure 7: Europe Smartphone Camera Lenses Industry Revenue Share (%), by Country 2024 & 2032
                                                    8. Figure 8: South America Smartphone Camera Lenses Industry Revenue (Million), by Country 2024 & 2032
                                                    9. Figure 9: South America Smartphone Camera Lenses Industry Revenue Share (%), by Country 2024 & 2032
                                                    10. Figure 10: Middle East & Africa Smartphone Camera Lenses Industry Revenue (Million), by Country 2024 & 2032
                                                    11. Figure 11: Middle East & Africa Smartphone Camera Lenses Industry Revenue Share (%), by Country 2024 & 2032
                                                    12. Figure 12: Asia Pacific Smartphone Camera Lenses Industry Revenue (Million), by Production Analysis 2024 & 2032
                                                    13. Figure 13: Asia Pacific Smartphone Camera Lenses Industry Revenue Share (%), by Production Analysis 2024 & 2032
                                                    14. Figure 14: Asia Pacific Smartphone Camera Lenses Industry Revenue (Million), by Consumption Analysis 2024 & 2032
                                                    15. Figure 15: Asia Pacific Smartphone Camera Lenses Industry Revenue Share (%), by Consumption Analysis 2024 & 2032
                                                    16. Figure 16: Asia Pacific Smartphone Camera Lenses Industry Revenue (Million), by Import Market Analysis (Value & Volume) 2024 & 2032
                                                    17. Figure 17: Asia Pacific Smartphone Camera Lenses Industry Revenue Share (%), by Import Market Analysis (Value & Volume) 2024 & 2032
                                                    18. Figure 18: Asia Pacific Smartphone Camera Lenses Industry Revenue (Million), by Export Market Analysis (Value & Volume) 2024 & 2032
                                                    19. Figure 19: Asia Pacific Smartphone Camera Lenses Industry Revenue Share (%), by Export Market Analysis (Value & Volume) 2024 & 2032
                                                    20. Figure 20: Asia Pacific Smartphone Camera Lenses Industry Revenue (Million), by Price Trend Analysis 2024 & 2032
                                                    21. Figure 21: Asia Pacific Smartphone Camera Lenses Industry Revenue Share (%), by Price Trend Analysis 2024 & 2032
                                                    22. Figure 22: Asia Pacific Smartphone Camera Lenses Industry Revenue (Million), by Country 2024 & 2032
                                                    23. Figure 23: Asia Pacific Smartphone Camera Lenses Industry Revenue Share (%), by Country 2024 & 2032
                                                    24. Figure 24: Americas Smartphone Camera Lenses Industry Revenue (Million), by Production Analysis 2024 & 2032
                                                    25. Figure 25: Americas Smartphone Camera Lenses Industry Revenue Share (%), by Production Analysis 2024 & 2032
                                                    26. Figure 26: Americas Smartphone Camera Lenses Industry Revenue (Million), by Consumption Analysis 2024 & 2032
                                                    27. Figure 27: Americas Smartphone Camera Lenses Industry Revenue Share (%), by Consumption Analysis 2024 & 2032
                                                    28. Figure 28: Americas Smartphone Camera Lenses Industry Revenue (Million), by Import Market Analysis (Value & Volume) 2024 & 2032
                                                    29. Figure 29: Americas Smartphone Camera Lenses Industry Revenue Share (%), by Import Market Analysis (Value & Volume) 2024 & 2032
                                                    30. Figure 30: Americas Smartphone Camera Lenses Industry Revenue (Million), by Export Market Analysis (Value & Volume) 2024 & 2032
                                                    31. Figure 31: Americas Smartphone Camera Lenses Industry Revenue Share (%), by Export Market Analysis (Value & Volume) 2024 & 2032
                                                    32. Figure 32: Americas Smartphone Camera Lenses Industry Revenue (Million), by Price Trend Analysis 2024 & 2032
                                                    33. Figure 33: Americas Smartphone Camera Lenses Industry Revenue Share (%), by Price Trend Analysis 2024 & 2032
                                                    34. Figure 34: Americas Smartphone Camera Lenses Industry Revenue (Million), by Country 2024 & 2032
                                                    35. Figure 35: Americas Smartphone Camera Lenses Industry Revenue Share (%), by Country 2024 & 2032
                                                    36. Figure 36: Europe Smartphone Camera Lenses Industry Revenue (Million), by Production Analysis 2024 & 2032
                                                    37. Figure 37: Europe Smartphone Camera Lenses Industry Revenue Share (%), by Production Analysis 2024 & 2032
                                                    38. Figure 38: Europe Smartphone Camera Lenses Industry Revenue (Million), by Consumption Analysis 2024 & 2032
                                                    39. Figure 39: Europe Smartphone Camera Lenses Industry Revenue Share (%), by Consumption Analysis 2024 & 2032
                                                    40. Figure 40: Europe Smartphone Camera Lenses Industry Revenue (Million), by Import Market Analysis (Value & Volume) 2024 & 2032
                                                    41. Figure 41: Europe Smartphone Camera Lenses Industry Revenue Share (%), by Import Market Analysis (Value & Volume) 2024 & 2032
                                                    42. Figure 42: Europe Smartphone Camera Lenses Industry Revenue (Million), by Export Market Analysis (Value & Volume) 2024 & 2032
                                                    43. Figure 43: Europe Smartphone Camera Lenses Industry Revenue Share (%), by Export Market Analysis (Value & Volume) 2024 & 2032
                                                    44. Figure 44: Europe Smartphone Camera Lenses Industry Revenue (Million), by Price Trend Analysis 2024 & 2032
                                                    45. Figure 45: Europe Smartphone Camera Lenses Industry Revenue Share (%), by Price Trend Analysis 2024 & 2032
                                                    46. Figure 46: Europe Smartphone Camera Lenses Industry Revenue (Million), by Country 2024 & 2032
                                                    47. Figure 47: Europe Smartphone Camera Lenses Industry Revenue Share (%), by Country 2024 & 2032
                                                    48. Figure 48: Rest of the World Smartphone Camera Lenses Industry Revenue (Million), by Production Analysis 2024 & 2032
                                                    49. Figure 49: Rest of the World Smartphone Camera Lenses Industry Revenue Share (%), by Production Analysis 2024 & 2032
                                                    50. Figure 50: Rest of the World Smartphone Camera Lenses Industry Revenue (Million), by Consumption Analysis 2024 & 2032
                                                    51. Figure 51: Rest of the World Smartphone Camera Lenses Industry Revenue Share (%), by Consumption Analysis 2024 & 2032
                                                    52. Figure 52: Rest of the World Smartphone Camera Lenses Industry Revenue (Million), by Import Market Analysis (Value & Volume) 2024 & 2032
                                                    53. Figure 53: Rest of the World Smartphone Camera Lenses Industry Revenue Share (%), by Import Market Analysis (Value & Volume) 2024 & 2032
                                                    54. Figure 54: Rest of the World Smartphone Camera Lenses Industry Revenue (Million), by Export Market Analysis (Value & Volume) 2024 & 2032
                                                    55. Figure 55: Rest of the World Smartphone Camera Lenses Industry Revenue Share (%), by Export Market Analysis (Value & Volume) 2024 & 2032
                                                    56. Figure 56: Rest of the World Smartphone Camera Lenses Industry Revenue (Million), by Price Trend Analysis 2024 & 2032
                                                    57. Figure 57: Rest of the World Smartphone Camera Lenses Industry Revenue Share (%), by Price Trend Analysis 2024 & 2032
                                                    58. Figure 58: Rest of the World Smartphone Camera Lenses Industry Revenue (Million), by Country 2024 & 2032
                                                    59. Figure 59: Rest of the World Smartphone Camera Lenses Industry Revenue Share (%), by Country 2024 & 2032

                                                    List of Tables

                                                    1. Table 1: Global Smartphone Camera Lenses Industry Revenue Million Forecast, by Region 2019 & 2032
                                                    2. Table 2: Global Smartphone Camera Lenses Industry Revenue Million Forecast, by Production Analysis 2019 & 2032
                                                    3. Table 3: Global Smartphone Camera Lenses Industry Revenue Million Forecast, by Consumption Analysis 2019 & 2032
                                                    4. Table 4: Global Smartphone Camera Lenses Industry Revenue Million Forecast, by Import Market Analysis (Value & Volume) 2019 & 2032
                                                    5. Table 5: Global Smartphone Camera Lenses Industry Revenue Million Forecast, by Export Market Analysis (Value & Volume) 2019 & 2032
                                                    6. Table 6: Global Smartphone Camera Lenses Industry Revenue Million Forecast, by Price Trend Analysis 2019 & 2032
                                                    7. Table 7: Global Smartphone Camera Lenses Industry Revenue Million Forecast, by Region 2019 & 2032
                                                    8. Table 8: Global Smartphone Camera Lenses Industry Revenue Million Forecast, by Country 2019 & 2032
                                                    9. Table 9: China Smartphone Camera Lenses Industry Revenue (Million) Forecast, by Application 2019 & 2032
                                                    10. Table 10: Japan Smartphone Camera Lenses Industry Revenue (Million) Forecast, by Application 2019 & 2032
                                                    11. Table 11: India Smartphone Camera Lenses Industry Revenue (Million) Forecast, by Application 2019 & 2032
                                                    12. Table 12: South Korea Smartphone Camera Lenses Industry Revenue (Million) Forecast, by Application 2019 & 2032
                                                    13. Table 13: Taiwan Smartphone Camera Lenses Industry Revenue (Million) Forecast, by Application 2019 & 2032
                                                    14. Table 14: Australia Smartphone Camera Lenses Industry Revenue (Million) Forecast, by Application 2019 & 2032
                                                    15. Table 15: Rest of Asia-Pacific Smartphone Camera Lenses Industry Revenue (Million) Forecast, by Application 2019 & 2032
                                                    16. Table 16: Global Smartphone Camera Lenses Industry Revenue Million Forecast, by Country 2019 & 2032
                                                    17. Table 17: United States Smartphone Camera Lenses Industry Revenue (Million) Forecast, by Application 2019 & 2032
                                                    18. Table 18: Canada Smartphone Camera Lenses Industry Revenue (Million) Forecast, by Application 2019 & 2032
                                                    19. Table 19: Mexico Smartphone Camera Lenses Industry Revenue (Million) Forecast, by Application 2019 & 2032
                                                    20. Table 20: Global Smartphone Camera Lenses Industry Revenue Million Forecast, by Country 2019 & 2032
                                                    21. Table 21: Germany Smartphone Camera Lenses Industry Revenue (Million) Forecast, by Application 2019 & 2032
                                                    22. Table 22: France Smartphone Camera Lenses Industry Revenue (Million) Forecast, by Application 2019 & 2032
                                                    23. Table 23: Italy Smartphone Camera Lenses Industry Revenue (Million) Forecast, by Application 2019 & 2032
                                                    24. Table 24: United Kingdom Smartphone Camera Lenses Industry Revenue (Million) Forecast, by Application 2019 & 2032
                                                    25. Table 25: Netherlands Smartphone Camera Lenses Industry Revenue (Million) Forecast, by Application 2019 & 2032
                                                    26. Table 26: Sweden Smartphone Camera Lenses Industry Revenue (Million) Forecast, by Application 2019 & 2032
                                                    27. Table 27: Rest of Europe Smartphone Camera Lenses Industry Revenue (Million) Forecast, by Application 2019 & 2032
                                                    28. Table 28: Global Smartphone Camera Lenses Industry Revenue Million Forecast, by Country 2019 & 2032
                                                    29. Table 29: Brazil Smartphone Camera Lenses Industry Revenue (Million) Forecast, by Application 2019 & 2032
                                                    30. Table 30: Argentina Smartphone Camera Lenses Industry Revenue (Million) Forecast, by Application 2019 & 2032
                                                    31. Table 31: Rest of South America Smartphone Camera Lenses Industry Revenue (Million) Forecast, by Application 2019 & 2032
                                                    32. Table 32: Global Smartphone Camera Lenses Industry Revenue Million Forecast, by Country 2019 & 2032
                                                    33. Table 33: UAE Smartphone Camera Lenses Industry Revenue (Million) Forecast, by Application 2019 & 2032
                                                    34. Table 34: South Africa Smartphone Camera Lenses Industry Revenue (Million) Forecast, by Application 2019 & 2032
                                                    35. Table 35: Saudi Arabia Smartphone Camera Lenses Industry Revenue (Million) Forecast, by Application 2019 & 2032
                                                    36. Table 36: Rest of MEA Smartphone Camera Lenses Industry Revenue (Million) Forecast, by Application 2019 & 2032
                                                    37. Table 37: Global Smartphone Camera Lenses Industry Revenue Million Forecast, by Production Analysis 2019 & 2032
                                                    38. Table 38: Global Smartphone Camera Lenses Industry Revenue Million Forecast, by Consumption Analysis 2019 & 2032
                                                    39. Table 39: Global Smartphone Camera Lenses Industry Revenue Million Forecast, by Import Market Analysis (Value & Volume) 2019 & 2032
                                                    40. Table 40: Global Smartphone Camera Lenses Industry Revenue Million Forecast, by Export Market Analysis (Value & Volume) 2019 & 2032
                                                    41. Table 41: Global Smartphone Camera Lenses Industry Revenue Million Forecast, by Price Trend Analysis 2019 & 2032
                                                    42. Table 42: Global Smartphone Camera Lenses Industry Revenue Million Forecast, by Country 2019 & 2032
                                                    43. Table 43: Global Smartphone Camera Lenses Industry Revenue Million Forecast, by Production Analysis 2019 & 2032
                                                    44. Table 44: Global Smartphone Camera Lenses Industry Revenue Million Forecast, by Consumption Analysis 2019 & 2032
                                                    45. Table 45: Global Smartphone Camera Lenses Industry Revenue Million Forecast, by Import Market Analysis (Value & Volume) 2019 & 2032
                                                    46. Table 46: Global Smartphone Camera Lenses Industry Revenue Million Forecast, by Export Market Analysis (Value & Volume) 2019 & 2032
                                                    47. Table 47: Global Smartphone Camera Lenses Industry Revenue Million Forecast, by Price Trend Analysis 2019 & 2032
                                                    48. Table 48: Global Smartphone Camera Lenses Industry Revenue Million Forecast, by Country 2019 & 2032
                                                    49. Table 49: Global Smartphone Camera Lenses Industry Revenue Million Forecast, by Production Analysis 2019 & 2032
                                                    50. Table 50: Global Smartphone Camera Lenses Industry Revenue Million Forecast, by Consumption Analysis 2019 & 2032
                                                    51. Table 51: Global Smartphone Camera Lenses Industry Revenue Million Forecast, by Import Market Analysis (Value & Volume) 2019 & 2032
                                                    52. Table 52: Global Smartphone Camera Lenses Industry Revenue Million Forecast, by Export Market Analysis (Value & Volume) 2019 & 2032
                                                    53. Table 53: Global Smartphone Camera Lenses Industry Revenue Million Forecast, by Price Trend Analysis 2019 & 2032
                                                    54. Table 54: Global Smartphone Camera Lenses Industry Revenue Million Forecast, by Country 2019 & 2032
                                                    55. Table 55: Global Smartphone Camera Lenses Industry Revenue Million Forecast, by Production Analysis 2019 & 2032
                                                    56. Table 56: Global Smartphone Camera Lenses Industry Revenue Million Forecast, by Consumption Analysis 2019 & 2032
                                                    57. Table 57: Global Smartphone Camera Lenses Industry Revenue Million Forecast, by Import Market Analysis (Value & Volume) 2019 & 2032
                                                    58. Table 58: Global Smartphone Camera Lenses Industry Revenue Million Forecast, by Export Market Analysis (Value & Volume) 2019 & 2032
                                                    59. Table 59: Global Smartphone Camera Lenses Industry Revenue Million Forecast, by Price Trend Analysis 2019 & 2032
                                                    60. Table 60: Global Smartphone Camera Lenses Industry Revenue Million Forecast, by Country 2019 & 2032


                                                    Frequently Asked Questions

                                                    1. What is the projected Compound Annual Growth Rate (CAGR) of the Smartphone Camera Lenses Industry?

                                                    The projected CAGR is approximately 8.21%.

                                                    2. Which companies are prominent players in the Smartphone Camera Lenses Industry?

                                                    Key companies in the market include Genius Electronic Optical (GSEO), Sunny Optical Technology (Group) Company Limited, AAC Technologies, Samsung Electro-Mechanics Co Ltd*List Not Exhaustive, Asia Optical Co Inc, Ofilm Group Co Ltd, Largan Precision Company Limited, SEKONIX Co Ltd, Kantatsu Co Ltd (Sharp Corporation, Haesung Optics Co Ltd, LG Innotek, Kinko Optical Co Ltd.

                                                    3. What are the main segments of the Smartphone Camera Lenses Industry?

                                                    The market segments include Production Analysis, Consumption Analysis, Import Market Analysis (Value & Volume), Export Market Analysis (Value & Volume), Price Trend Analysis.

                                                    4. Can you provide details about the market size?

                                                    The market size is estimated to be USD 5.01 Million as of 2022.

                                                    5. What are some drivers contributing to market growth?

                                                    Increasing Popularity of Multiple Camera Smartphones and the Introduction of Advanced Camera Technologies.

                                                    6. What are the notable trends driving market growth?

                                                    Increasing Popularity of Multiple Camera Smartphones and the Introduction of Advanced Camera Technologies will Drive the Market.

                                                    7. Are there any restraints impacting market growth?

                                                    Slow Down of Smartphone Sales and Increasing Pricing Competition.

                                                    8. Can you provide examples of recent developments in the market?

                                                    October 2023 - Google launched its Pixel 8 series. It uses AI algorithms to pick out the best facial expressions in batches of group photos and easily paste them into a different image template. Samsung also applied around 60 AI models for the functions of the cameras on its Galaxy S22 Ultra, thereby allowing customers to click detailed close-up photos of night scenes and match the quality of a DSLR.

                                                    9. What pricing options are available for accessing the report?

                                                    Pricing options include single-user, multi-user, and enterprise licenses priced at USD 4750, USD 5250, and USD 8750 respectively.

                                                    10. Is the market size provided in terms of value or volume?

                                                    The market size is provided in terms of value, measured in Million.

                                                    11. Are there any specific market keywords associated with the report?

                                                    Yes, the market keyword associated with the report is "Smartphone Camera Lenses Industry," which aids in identifying and referencing the specific market segment covered.

                                                    12. How do I determine which pricing option suits my needs best?

                                                    The pricing options vary based on user requirements and access needs. Individual users may opt for single-user licenses, while businesses requiring broader access may choose multi-user or enterprise licenses for cost-effective access to the report.

                                                    13. Are there any additional resources or data provided in the Smartphone Camera Lenses Industry report?

                                                    While the report offers comprehensive insights, it's advisable to review the specific contents or supplementary materials provided to ascertain if additional resources or data are available.

                                                    14. How can I stay updated on further developments or reports in the Smartphone Camera Lenses Industry?

                                                    To stay informed about further developments, trends, and reports in the Smartphone Camera Lenses Industry, consider subscribing to industry newsletters, following relevant companies and organizations, or regularly checking reputable industry news sources and publications.


                                                    Methodology

                                                    Step 1 - Identification of Relevant Samples Size from Population Database

                                                    Step Chart
                                                    Bar Chart
                                                    Method Chart

                                                    Step 2 - Approaches for Defining Global Market Size (Value, Volume* & Price*)

                                                    Approach Chart
                                                    Top-down and bottom-up approaches are used to validate the global market size and estimate the market size for manufactures, regional segments, product, and application.

                                                    Note*: In applicable scenarios

                                                    Step 3 - Data Sources

                                                    Primary Research

                                                    • Web Analytics
                                                    • Survey Reports
                                                    • Research Institute
                                                    • Latest Research Reports
                                                    • Opinion Leaders

                                                    Secondary Research

                                                    • Annual Reports
                                                    • White Paper
                                                    • Latest Press Release
                                                    • Industry Association
                                                    • Paid Database
                                                    • Investor Presentations
                                                    Analyst Chart

                                                    Step 4 - Data Triangulation

                                                    Involves using different sources of information in order to increase the validity of a study

                                                    These sources are likely to be stakeholders in a program - participants, other researchers, program staff, other community members, and so on.

                                                    Then we put all data in single framework & apply various statistical tools to find out the dynamic on the market.

                                                    During the analysis stage, feedback from the stakeholder groups would be compared to determine areas of agreement as well as areas of divergence

                                                    Additionally, after gathering mixed and scattered data from a wide range of sources, data is triangulated and correlated to come up with estimated figures which are further validated through primary mediums or industry experts, opinion leaders.

                                                    About Report Pinnacle

                                                    Report Pinnacle provides top-tier market research, industry intelligence, and actionable insights for finance, technology, healthcare, and consumer sectors. Our reports empower you to make informed decisions and achieve business success.

                                                    Our expert team combines primary research, data analytics, and industry knowledge to deliver insights you can trust. We offer syndicated reports, custom research, and consulting services tailored to your unique business needs.

                                                    At Report Pinnacle, we are committed to quality, transparency, and client satisfaction. Every report is rigorously validated to ensure accuracy and relevance. Our global perspective and local expertise help you understand both broad trends and detailed market shifts.

                                                    Stay ahead with Report Pinnacle. Subscribe to our newsletter for the latest insights and research highlights, and follow us on social media for real-time updates.

                                                    Report Pinnacle – Your Partner for Reaching the Top in Market Intelligence.

                                                    artwork spiralartwork spiralRelated Reports
                                                    artwork underline

                                                    Comprehensive Overview of Network Emulator Industry Trends: 2025-2033

                                                    The Network Emulator market is booming, with an 8% CAGR projected to 2033. Driven by 5G, cloud, and SDN advancements, this comprehensive market analysis reveals key trends, segments (hardware, software, telecom, defense), top companies, and regional growth projections. Discover the opportunities and challenges in this rapidly evolving landscape.

                                                    July 2025
                                                    Base Year: 2024
                                                    No Of Pages: 234
                                                    Price: $4750

                                                    North America ERP Industry Future Forecasts: Insights and Trends to 2033

                                                    The North American ERP market is booming, projected to reach [estimated 2033 value] by 2033, with a CAGR of 9.51%. This in-depth analysis reveals key market drivers, trends, and challenges, covering segments like cloud ERP, mobile ERP, and applications across retail, manufacturing, and BFSI. Leading companies and regional market share are also explored.

                                                    July 2025
                                                    Base Year: 2024
                                                    No Of Pages: 234
                                                    Price: $4750

                                                    Understanding Austria Data Center Market Trends and Growth Dynamics

                                                    Discover the booming Austrian data center market! This in-depth analysis reveals a 15.20% CAGR through 2033, driven by cloud adoption and digital transformation. Explore key players, market segments (Tier type, absorption, size), and regional trends in Vienna and beyond. Get insights into growth drivers, restraints, and future projections.

                                                    July 2025
                                                    Base Year: 2024
                                                    No Of Pages: 197
                                                    Price: $3800

                                                    Future Trends Shaping 3D Gaming Consoles Industry Growth

                                                    The 3D gaming console market is booming, projected to reach [estimated 2033 market size in millions] by 2033 with a CAGR of 15.15%. Explore key market drivers, trends, and regional insights. Discover leading companies and investment opportunities in this rapidly expanding sector.

                                                    July 2025
                                                    Base Year: 2024
                                                    No Of Pages: 234
                                                    Price: $4750

                                                    Growth Roadmap for Machine Automation Controller Industry Market 2025-2033

                                                    The Machine Automation Controller market is booming, with a 7% CAGR. Discover key trends, leading companies (Honeywell, ABB, Siemens), and regional insights in this comprehensive market analysis. Explore market segments including DCS, PLC, and IPC controllers for various applications. Learn about market size projections to 2033.

                                                    July 2025
                                                    Base Year: 2024
                                                    No Of Pages: 234
                                                    Price: $4750

                                                    Japan Digital Transformation Market Size, Share, and Growth Report: In-Depth Analysis and Forecast to 2033

                                                    The Japan Digital Transformation market is booming, projected to reach [estimated 2033 market size based on chart data] by 2033, fueled by government initiatives and rapid adoption of AI, cloud, and IoT. Learn about key market drivers, trends, and leading companies in this dynamic sector.

                                                    July 2025
                                                    Base Year: 2024
                                                    No Of Pages: 197
                                                    Price: $3800

                                                    Europe Conveyors Industry Unlocking Growth Potential: Analysis and Forecasts 2025-2033

                                                    Discover the booming European conveyors market! This in-depth analysis reveals a CAGR of 10.79% (2025-2033), driven by e-commerce, automation, and Industry 4.0. Explore market size, key players (KNAAP, Interroll, BEUMER), and regional trends in Germany, France, UK, and more.

                                                    July 2025
                                                    Base Year: 2024
                                                    No Of Pages: 210
                                                    Price: $4750

                                                    Exploring Barriers in Ad Tech Market Market: Trends and Analysis 2025-2033

                                                    The Ad Tech market is booming, projected to reach [estimated 2033 value based on CAGR] by 2033, driven by programmatic advertising, video ads, and expanding digital marketing budgets. Discover key trends, regional insights, and leading companies shaping this dynamic landscape.

                                                    July 2025
                                                    Base Year: 2024
                                                    No Of Pages: 234
                                                    Price: $4750

                                                    Analyzing US Data Center Industry: Opportunities and Growth Patterns 2025-2033

                                                    Discover the booming US data center market! Our analysis reveals a $XX million market in 2025, projected to grow at a 6% CAGR through 2033. Learn about key drivers, trends, restraints, major players (Equinix, Digital Realty, etc.), and regional hotspots like Northern Virginia and Silicon Valley. Get the insights you need to navigate this dynamic industry.

                                                    July 2025
                                                    Base Year: 2024
                                                    No Of Pages: 197
                                                    Price: $3800

                                                    Flow Sensors Industry Growth Forecast and Consumer Insights

                                                    The global flow sensors market is booming, projected to reach $XX million by 2033 with a CAGR of 6.14%. Discover key trends, driving factors, and leading players shaping this dynamic industry encompassing Coriolis, ultrasonic, and differential pressure technologies across various sectors like oil & gas, water treatment, and chemical processing.

                                                    July 2025
                                                    Base Year: 2024
                                                    No Of Pages: 234
                                                    Price: $4750

                                                    Consumer Behavior and City Surveillance Industry Trends

                                                    The city surveillance market is booming, projected to reach \$26.17 billion by 2033, driven by smart city initiatives and technological advancements. Learn about market trends, key players (Hikvision, Dahua, Bosch), and growth drivers in this detailed analysis.

                                                    July 2025
                                                    Base Year: 2024
                                                    No Of Pages: 234
                                                    Price: $4750

                                                    Global Bipolar Small Signal Transistor Market Market Report: Strategic Insights

                                                    Discover the latest trends and insights into the booming global bipolar small signal transistor market. This comprehensive analysis reveals a CAGR of 4.44%, driven by consumer electronics, automotive, and industrial automation. Explore market segmentation, key players, and regional growth projections for 2025-2033.

                                                    July 2025
                                                    Base Year: 2024
                                                    No Of Pages: 234
                                                    Price: $4750

                                                    Retail Analytics Market Industry’s Growth Dynamics and Insights

                                                    Discover the explosive growth of the retail analytics market, projected at a 20.76% CAGR. This in-depth analysis explores market drivers, trends, restraints, and key players shaping the future of retail data analysis, including cloud solutions, AI, and omnichannel strategies. Learn about market segmentation, regional growth forecasts (North America, Europe, Asia-Pacific), and top companies like Qlik, IBM, and Tableau.

                                                    July 2025
                                                    Base Year: 2024
                                                    No Of Pages: 197
                                                    Price: $3800

                                                    Parking Reservation Systems Market Strategic Insights: Analysis 2025 and Forecasts 2033

                                                    The Parking Reservation Systems market is booming, projected to reach [estimated 2033 market size in millions] by 2033 with a CAGR of 11.15%. This report analyzes market drivers, trends, restraints, and key players across segments including on-street/off-street parking, web/mobile/voice solutions, and various end-user verticals. Learn more about this rapidly growing market opportunity.

                                                    July 2025
                                                    Base Year: 2024
                                                    No Of Pages: 234
                                                    Price: $4750

                                                    Datafication Market Market Predictions: Growth and Size Trends to 2033

                                                    The Datafication Market is booming, projected to reach $XX million by 2033 with a CAGR of 12.42%. Explore key drivers, trends, and segments including behavioral, social, and geospatial datafication across BFSI, healthcare, and other verticals. Learn about leading companies and regional market shares.

                                                    July 2025
                                                    Base Year: 2024
                                                    No Of Pages: 234
                                                    Price: $4750

                                                    Growth Strategies in Data Center Transformation Industry Market: 2025-2033 Outlook

                                                    The Data Center Transformation market is booming, projected to reach \$41.53 billion by 2033 with a 9.35% CAGR. Learn about key drivers, market segmentation (by tier, end-user, and service), regional analysis, and leading companies shaping this dynamic industry. Discover the impact of cloud computing, edge computing, and IoT on data center modernization.

                                                    July 2025
                                                    Base Year: 2024
                                                    No Of Pages: 234
                                                    Price: $4750

                                                    Connected Toys Industry Competitive Strategies: Trends and Forecasts 2025-2033

                                                    The booming connected toys market is projected to reach $63.33 billion by 2033, fueled by technological advancements and increasing smartphone penetration. Explore market trends, leading companies (Mattel, Hasbro, LEGO), and regional insights in this comprehensive analysis.

                                                    July 2025
                                                    Base Year: 2024
                                                    No Of Pages: 234
                                                    Price: $4750

                                                    Exploring Key Dynamics of Europe Warranty Management System Market Industry

                                                    The European Warranty Management System market is booming, projected to reach €1.47 billion by 2025 with a 13.07% CAGR. Discover key trends, drivers, and leading companies shaping this dynamic sector across cloud, on-premise, and key industries like automotive and industrial equipment.

                                                    July 2025
                                                    Base Year: 2024
                                                    No Of Pages: 210
                                                    Price: $4750

                                                    Manufacturing Analytics Industry 2025-2033: Preparing for Growth and Change

                                                    Discover the booming Manufacturing Analytics market! This in-depth analysis reveals a 24% CAGR, driven by Industry 4.0, predictive maintenance, and cloud adoption. Explore key trends, regional insights, and leading companies shaping this transformative sector. Learn how to leverage manufacturing analytics for optimized operations and enhanced profitability.

                                                    July 2025
                                                    Base Year: 2024
                                                    No Of Pages: 234
                                                    Price: $4750

                                                    Cyber Security in Insurance Industry Industry Analysis and Consumer Behavior

                                                    The cybersecurity insurance market is booming, projected to reach \$16.09 billion by 2025, with a 19.72% CAGR. Learn about key drivers, trends, restraints, and leading companies shaping this rapidly evolving sector. Explore regional market share and growth projections for North America, Europe, Asia-Pacific, and more.

                                                    July 2025
                                                    Base Year: 2024
                                                    No Of Pages: 234
                                                    Price: $4750

                                                    Business Address

                                                    Head Office

                                                    Office no. A 5010, fifth floor, Solitaire Business Hub, Near Phoenix mall, Pune, Maharashtra 411014

                                                    Contact Information

                                                    Craig Francis

                                                    Business Development Head

                                                    +17162654855

                                                    [email protected]

                                                    Connect With Us

                                                    Secure Payment Partners

                                                    payment image
                                                    RetailLogisticsPackagingAutomotiveHealthcareAgricultureEnergy & PowerFood & BeverageAerospace & DefenseChemicals & MaterialsHospitality and TourismAnimal Nutrition & WellnessConsumer Goods and ServicesReal Estate and ConstructionHome and Property ImprovementTechnology, Media and TelecomManufacturing Products and ServicesFinancial Services and Investment Intelligence

                                                    © 2025 All rights reserved


                                                    Privacy Policy
                                                    Terms and Conditions
                                                    FAQ
                                                    • Home
                                                    • About Us
                                                    • Industries
                                                      • Aerospace & Defense
                                                      • Agriculture
                                                      • Animal Nutrition & Wellness
                                                      • Automotive
                                                      • Chemicals & Materials
                                                      • Consumer Goods and Services
                                                      • Energy & Power
                                                      • Financial Services and Investment Intelligence
                                                      • Food & Beverage
                                                      • Home and Property Improvement
                                                      • Hospitality and Tourism
                                                      • Logistics
                                                      • Manufacturing Products and Services
                                                      • Packaging
                                                      • Professional and Commercial Services
                                                      • Real Estate and Construction
                                                      • Retail
                                                      • Technology, Media and Telecom
                                                      • Healthcare
                                                    • Services
                                                    • Contact
                                                    Main Logo
                                                    • Home
                                                    • About Us
                                                    • Industries
                                                      • Aerospace & Defense
                                                      • Agriculture
                                                      • Animal Nutrition & Wellness
                                                      • Automotive
                                                      • Chemicals & Materials
                                                      • Consumer Goods and Services
                                                      • Energy & Power
                                                      • Financial Services and Investment Intelligence
                                                      • Food & Beverage
                                                      • Home and Property Improvement
                                                      • Hospitality and Tourism
                                                      • Logistics
                                                      • Manufacturing Products and Services
                                                      • Packaging
                                                      • Professional and Commercial Services
                                                      • Real Estate and Construction
                                                      • Retail
                                                      • Technology, Media and Telecom
                                                      • Healthcare
                                                    • Services
                                                    • Contact
                                                    +17162654855
                                                    [email protected]

                                                    +17162654855

                                                    [email protected]