
Key Insights
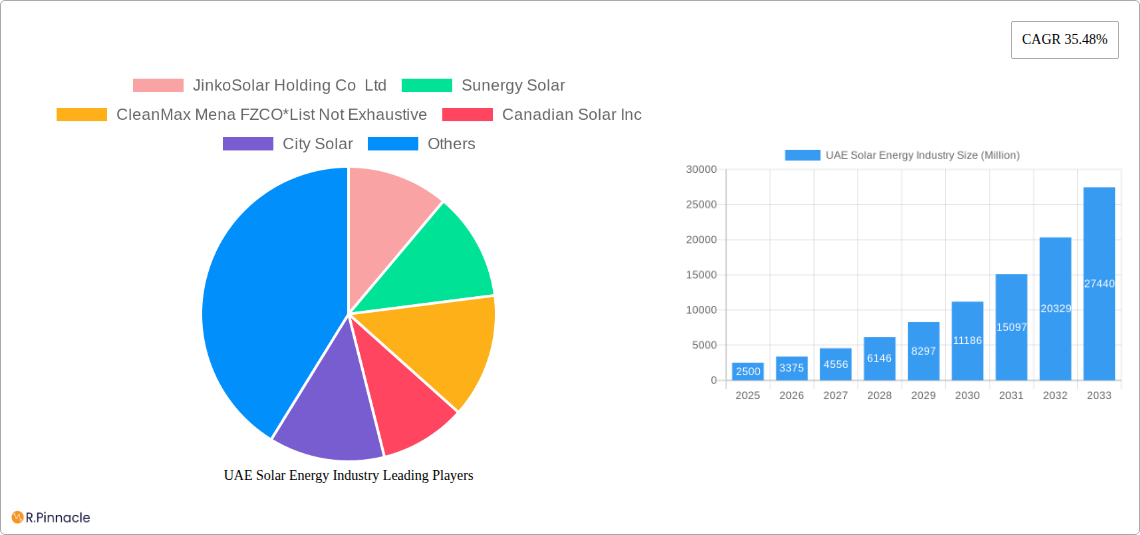
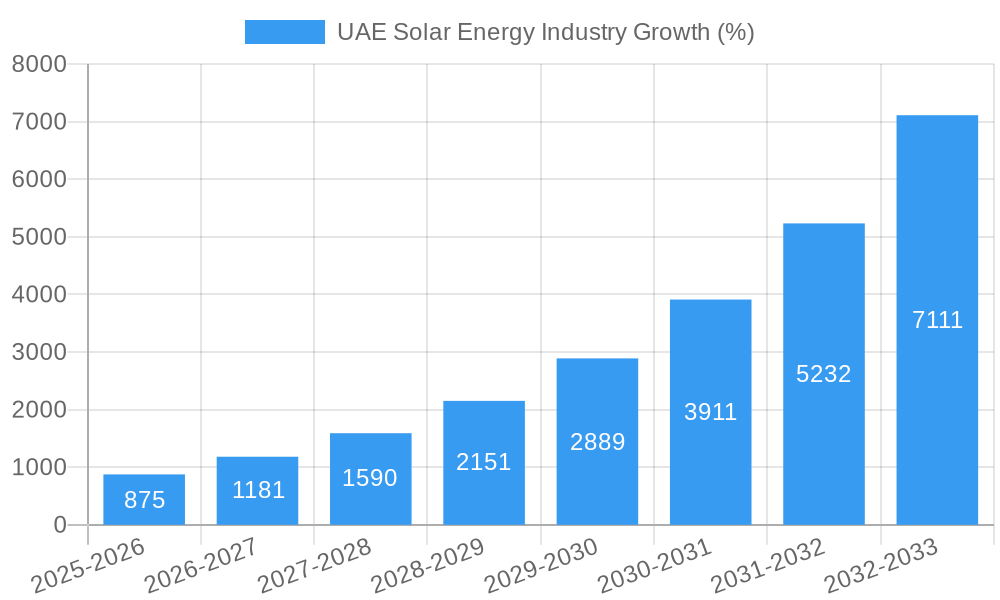
The UAE solar energy market is experiencing explosive growth, driven by the nation's ambitious sustainability goals and abundant sunlight. With a Compound Annual Growth Rate (CAGR) of 35.48% between 2019 and 2033, the market exhibits significant potential. This robust expansion is fueled by several key factors. Government initiatives promoting renewable energy, including substantial investments in large-scale solar projects and supportive policies, are paramount. Furthermore, decreasing solar technology costs and increasing energy demand are bolstering market adoption. The residential sector, while currently smaller than utility-scale deployments, shows significant growth potential as awareness of solar's economic benefits increases and technological advancements make residential systems more accessible and affordable. The diverse deployment segments – utility, commercial and industrial, and residential – offer opportunities for various players across the value chain. Leading companies like Masdar, ACWA Power, and international players such as JinkoSolar and Canadian Solar are actively contributing to this growth, fostering competition and innovation.
The market segmentation reveals a strong presence of photovoltaic (PV) technology, which dominates the current landscape, though concentrated solar power (CSP) is also gaining traction, particularly in large-scale projects. While the UAE market is currently focused on domestic deployment, future growth will likely incorporate regional export opportunities, leveraging the country's technological advancements and strategic location. Challenges remain, including grid integration complexities and the need for skilled workforce development to sustain the rapid expansion. Nevertheless, the UAE solar energy market's positive trajectory suggests a promising future, promising substantial economic and environmental benefits for the nation and beyond. The substantial investment in infrastructure and the government's commitment to renewable energy targets create a favorable environment for continued growth and innovation in the coming years.
UAE Solar Energy Industry Report: 2019-2033
This comprehensive report provides an in-depth analysis of the UAE solar energy industry, offering valuable insights for investors, industry professionals, and policymakers. With a focus on market trends, technological advancements, and key players, this report covers the period from 2019 to 2033, utilizing 2025 as the base year. The report projects robust growth, driven by supportive government policies and increasing demand for renewable energy. Download now to gain a competitive edge.
UAE Solar Energy Industry Market Structure & Innovation Trends
This section analyzes the UAE's solar energy market structure, highlighting key trends impacting its evolution. The market is characterized by a mix of large international players and local companies, creating a dynamic competitive landscape. Market concentration is moderate, with a few dominant players holding significant market share, while numerous smaller companies compete in niche segments. Innovation is driven by government incentives promoting renewable energy adoption, advancements in photovoltaic (PV) technology, and the growing demand for cost-effective and efficient solutions. Regulatory frameworks, including feed-in tariffs and net metering policies, significantly influence market growth. Product substitutes, such as fossil fuels, are gradually losing ground due to increasing environmental concerns and economic incentives favoring solar energy. End-user demographics show a rising demand across sectors, with significant growth expected in the utility, commercial and industrial segments. Mergers and acquisitions (M&A) are increasingly common, with deal values reaching xx Million in recent years, further consolidating the market.
- Market Share: Masdar holds approximately xx% market share, followed by ACWA Power with xx% and JinkoSolar Holding Co Ltd with xx%.
- M&A Activity: In the last 5 years, approximately xx M&A deals have taken place in the UAE solar energy sector, with an average deal value of xx Million.
UAE Solar Energy Industry Market Dynamics & Trends
The UAE solar energy market exhibits robust growth, propelled by several key factors. The government's ambitious renewable energy targets, coupled with substantial investments in infrastructure development, are major drivers of expansion. The decreasing cost of solar PV technology significantly boosts market penetration. Furthermore, growing environmental awareness among consumers and businesses drives demand for cleaner energy solutions. Technological advancements, particularly in PV efficiency and energy storage, contribute to the market’s dynamism. Increased competition among companies fuels innovation and price reductions, making solar energy increasingly accessible. The compound annual growth rate (CAGR) for the period 2025-2033 is estimated at xx%, with market penetration projected to reach xx% by 2033. Consumer preferences lean towards cost-effective and reliable solar solutions, prompting companies to focus on offering value-added services such as maintenance and financing options.
Dominant Regions & Segments in UAE Solar Energy Industry
The UAE's solar energy market witnesses significant growth across all regions, with Abu Dhabi and Dubai leading due to their robust infrastructure and government support. Within the technology segment, Photovoltaic (PV) dominates the market, accounting for over xx% of the installed capacity. Concentrated Solar Power (CSP) is also witnessing steady growth, with several large-scale projects under development. The utility-scale segment leads in terms of installed capacity, followed by the commercial and industrial sectors. Residential solar adoption is steadily increasing, driven by government incentives and declining prices.
- Key Drivers for Abu Dhabi and Dubai:
- Supportive government policies and substantial investments in renewable energy infrastructure.
- Abundant sunlight and favorable geographic conditions.
- Well-developed power grids facilitating efficient integration of solar power.
- Growing demand from diverse sectors, including utilities, commercial enterprises and residential consumers.
UAE Solar Energy Industry Product Innovations
The UAE solar energy market is witnessing continuous product innovation, driven by the need for higher efficiency, cost reduction, and improved performance. Recent advancements include the introduction of high-efficiency PV modules, improved energy storage systems, and smart grid technologies for better integration. These innovations enhance the competitiveness of solar energy compared to traditional energy sources, boosting market adoption and creating new opportunities.
Report Scope & Segmentation Analysis
This report segments the UAE solar energy market by technology (Photovoltaic and Concentrated Solar Power) and deployment (Utility, Commercial & Industrial, and Residential). Each segment is analyzed for growth projections, market size, and competitive dynamics. The Photovoltaic segment is expected to maintain its dominance, with a CAGR of xx% during the forecast period. Concentrated Solar Power is projected to experience moderate growth, driven by large-scale project developments. Within the deployment segments, utility-scale projects dominate, but commercial and industrial, as well as residential sectors, exhibit significant growth potential. The competitive landscape within each segment varies, with a mix of large international players and local companies.
Key Drivers of UAE Solar Energy Industry Growth
The UAE's solar energy sector is fueled by several key factors. Government policies, such as the UAE Energy Strategy 2050, aim for 50% clean energy by 2050, providing strong impetus for solar adoption. Decreasing solar technology costs make solar energy increasingly competitive with traditional sources. Furthermore, increasing awareness of climate change and the desire for energy independence drive investment and adoption of solar energy. The abundant sunshine in the UAE offers significant potential for large-scale solar projects.
Challenges in the UAE Solar Energy Industry Sector
Despite significant potential, the UAE's solar energy sector faces certain challenges. Land availability for large-scale projects can be a constraint. Grid integration, especially during peak hours, requires careful planning and investment in infrastructure upgrades. Fluctuations in global supply chains for solar components can impact project timelines and costs. Although these challenges exist, ongoing investments in infrastructure and innovative solutions are mitigating many of these issues.
Emerging Opportunities in UAE Solar Energy Industry
The UAE solar energy market presents several emerging opportunities. The growing adoption of energy storage technologies, such as battery storage, enhances the reliability and affordability of solar power. The integration of solar energy with other renewable sources, like wind power, creates diverse and sustainable energy solutions. The potential for solar-powered desalination plants addresses water scarcity issues, offering significant economic and social benefits. The development of smart grids improves energy efficiency and grid stability.
Leading Players in the UAE Solar Energy Industry Market
- JinkoSolar Holding Co Ltd
- Sunergy Solar
- CleanMax Mena FZCO
- Canadian Solar Inc
- City Solar
- Masdar (Abu Dhabi Future Energy Company)
- MAYSUN SOLAR FZCO
- Enerwhere
- ACWA Power
Key Developments in UAE Solar Energy Industry
- January 2023: Suntech delivered all 680MW solar modules for the Al Dhafra PV2 Solar Power Plant, advancing the construction of the world's largest single-site solar power plant.
- May 2023: ADNOC Distribution partnered with Emerge (EDF and Masdar joint venture) to develop on-site solar power across its service station network, commencing in Dubai.
Future Outlook for UAE Solar Energy Industry Market
The future of the UAE solar energy market appears promising. Continued government support, technological advancements, and decreasing costs will drive substantial growth. The increasing integration of solar power into smart grids and the development of innovative energy storage solutions will further enhance the sector's competitiveness and sustainability. Strategic investments in research and development will propel the UAE towards its clean energy targets, establishing it as a global leader in the renewable energy sector.
UAE Solar Energy Industry Segmentation
-
1. Technology
- 1.1. Photovoltaic
- 1.2. Concentrated Solar Power (CSP)
-
2. Deployment
- 2.1. Utility
- 2.2. Commercial and Industrial
- 2.3. Residential
UAE Solar Energy Industry Segmentation By Geography
-
1. North America
- 1.1. United States
- 1.2. Canada
- 1.3. Mexico
-
2. South America
- 2.1. Brazil
- 2.2. Argentina
- 2.3. Rest of South America
-
3. Europe
- 3.1. United Kingdom
- 3.2. Germany
- 3.3. France
- 3.4. Italy
- 3.5. Spain
- 3.6. Russia
- 3.7. Benelux
- 3.8. Nordics
- 3.9. Rest of Europe
-
4. Middle East & Africa
- 4.1. Turkey
- 4.2. Israel
- 4.3. GCC
- 4.4. North Africa
- 4.5. South Africa
- 4.6. Rest of Middle East & Africa
-
5. Asia Pacific
- 5.1. China
- 5.2. India
- 5.3. Japan
- 5.4. South Korea
- 5.5. ASEAN
- 5.6. Oceania
- 5.7. Rest of Asia Pacific
UAE Solar Energy Industry REPORT HIGHLIGHTS
| Aspects | Details |
|---|---|
| Study Period | 2019-2033 |
| Base Year | 2024 |
| Estimated Year | 2025 |
| Forecast Period | 2025-2033 |
| Historical Period | 2019-2024 |
| Growth Rate | CAGR of 35.48% from 2019-2033 |
| Segmentation |
|
Table of Contents
- 1. Introduction
- 1.1. Research Scope
- 1.2. Market Segmentation
- 1.3. Research Methodology
- 1.4. Definitions and Assumptions
- 2. Executive Summary
- 2.1. Introduction
- 3. Market Dynamics
- 3.1. Introduction
- 3.2. Market Drivers
- 3.2.1. 4.; Rising Government Policies to Support Solar PV Installation4.; Rising Installation of Renewable Energy to Reduce Dependency on Fossil Fuels
- 3.3. Market Restrains
- 3.3.1 4.; Rising Adoption of Alternative Clean Energy Sources such as Wind
- 3.3.2 Geothermal
- 3.3.3 Bioenergy
- 3.3.4 and Others
- 3.4. Market Trends
- 3.4.1. Solar Photovoltaic to Dominate the Market
- 4. Market Factor Analysis
- 4.1. Porters Five Forces
- 4.2. Supply/Value Chain
- 4.3. PESTEL analysis
- 4.4. Market Entropy
- 4.5. Patent/Trademark Analysis
- 5. Global UAE Solar Energy Industry Analysis, Insights and Forecast, 2019-2031
- 5.1. Market Analysis, Insights and Forecast - by Technology
- 5.1.1. Photovoltaic
- 5.1.2. Concentrated Solar Power (CSP)
- 5.2. Market Analysis, Insights and Forecast - by Deployment
- 5.2.1. Utility
- 5.2.2. Commercial and Industrial
- 5.2.3. Residential
- 5.3. Market Analysis, Insights and Forecast - by Region
- 5.3.1. North America
- 5.3.2. South America
- 5.3.3. Europe
- 5.3.4. Middle East & Africa
- 5.3.5. Asia Pacific
- 5.1. Market Analysis, Insights and Forecast - by Technology
- 6. North America UAE Solar Energy Industry Analysis, Insights and Forecast, 2019-2031
- 6.1. Market Analysis, Insights and Forecast - by Technology
- 6.1.1. Photovoltaic
- 6.1.2. Concentrated Solar Power (CSP)
- 6.2. Market Analysis, Insights and Forecast - by Deployment
- 6.2.1. Utility
- 6.2.2. Commercial and Industrial
- 6.2.3. Residential
- 6.1. Market Analysis, Insights and Forecast - by Technology
- 7. South America UAE Solar Energy Industry Analysis, Insights and Forecast, 2019-2031
- 7.1. Market Analysis, Insights and Forecast - by Technology
- 7.1.1. Photovoltaic
- 7.1.2. Concentrated Solar Power (CSP)
- 7.2. Market Analysis, Insights and Forecast - by Deployment
- 7.2.1. Utility
- 7.2.2. Commercial and Industrial
- 7.2.3. Residential
- 7.1. Market Analysis, Insights and Forecast - by Technology
- 8. Europe UAE Solar Energy Industry Analysis, Insights and Forecast, 2019-2031
- 8.1. Market Analysis, Insights and Forecast - by Technology
- 8.1.1. Photovoltaic
- 8.1.2. Concentrated Solar Power (CSP)
- 8.2. Market Analysis, Insights and Forecast - by Deployment
- 8.2.1. Utility
- 8.2.2. Commercial and Industrial
- 8.2.3. Residential
- 8.1. Market Analysis, Insights and Forecast - by Technology
- 9. Middle East & Africa UAE Solar Energy Industry Analysis, Insights and Forecast, 2019-2031
- 9.1. Market Analysis, Insights and Forecast - by Technology
- 9.1.1. Photovoltaic
- 9.1.2. Concentrated Solar Power (CSP)
- 9.2. Market Analysis, Insights and Forecast - by Deployment
- 9.2.1. Utility
- 9.2.2. Commercial and Industrial
- 9.2.3. Residential
- 9.1. Market Analysis, Insights and Forecast - by Technology
- 10. Asia Pacific UAE Solar Energy Industry Analysis, Insights and Forecast, 2019-2031
- 10.1. Market Analysis, Insights and Forecast - by Technology
- 10.1.1. Photovoltaic
- 10.1.2. Concentrated Solar Power (CSP)
- 10.2. Market Analysis, Insights and Forecast - by Deployment
- 10.2.1. Utility
- 10.2.2. Commercial and Industrial
- 10.2.3. Residential
- 10.1. Market Analysis, Insights and Forecast - by Technology
- 11. Competitive Analysis
- 11.1. Global Market Share Analysis 2024
- 11.2. Company Profiles
- 11.2.1 JinkoSolar Holding Co Ltd
- 11.2.1.1. Overview
- 11.2.1.2. Products
- 11.2.1.3. SWOT Analysis
- 11.2.1.4. Recent Developments
- 11.2.1.5. Financials (Based on Availability)
- 11.2.2 Sunergy Solar
- 11.2.2.1. Overview
- 11.2.2.2. Products
- 11.2.2.3. SWOT Analysis
- 11.2.2.4. Recent Developments
- 11.2.2.5. Financials (Based on Availability)
- 11.2.3 CleanMax Mena FZCO*List Not Exhaustive
- 11.2.3.1. Overview
- 11.2.3.2. Products
- 11.2.3.3. SWOT Analysis
- 11.2.3.4. Recent Developments
- 11.2.3.5. Financials (Based on Availability)
- 11.2.4 Canadian Solar Inc
- 11.2.4.1. Overview
- 11.2.4.2. Products
- 11.2.4.3. SWOT Analysis
- 11.2.4.4. Recent Developments
- 11.2.4.5. Financials (Based on Availability)
- 11.2.5 City Solar
- 11.2.5.1. Overview
- 11.2.5.2. Products
- 11.2.5.3. SWOT Analysis
- 11.2.5.4. Recent Developments
- 11.2.5.5. Financials (Based on Availability)
- 11.2.6 Masdar (Abu Dhabi Future Energy Company)
- 11.2.6.1. Overview
- 11.2.6.2. Products
- 11.2.6.3. SWOT Analysis
- 11.2.6.4. Recent Developments
- 11.2.6.5. Financials (Based on Availability)
- 11.2.7 MAYSUN SOLAR FZCO
- 11.2.7.1. Overview
- 11.2.7.2. Products
- 11.2.7.3. SWOT Analysis
- 11.2.7.4. Recent Developments
- 11.2.7.5. Financials (Based on Availability)
- 11.2.8 Enerwhere
- 11.2.8.1. Overview
- 11.2.8.2. Products
- 11.2.8.3. SWOT Analysis
- 11.2.8.4. Recent Developments
- 11.2.8.5. Financials (Based on Availability)
- 11.2.9 ACWA Power
- 11.2.9.1. Overview
- 11.2.9.2. Products
- 11.2.9.3. SWOT Analysis
- 11.2.9.4. Recent Developments
- 11.2.9.5. Financials (Based on Availability)
- 11.2.1 JinkoSolar Holding Co Ltd
List of Figures
- Figure 1: Global UAE Solar Energy Industry Revenue Breakdown (Million, %) by Region 2024 & 2032
- Figure 2: Global UAE Solar Energy Industry Volume Breakdown (gigawatt, %) by Region 2024 & 2032
- Figure 3: UAE UAE Solar Energy Industry Revenue (Million), by Country 2024 & 2032
- Figure 4: UAE UAE Solar Energy Industry Volume (gigawatt), by Country 2024 & 2032
- Figure 5: UAE UAE Solar Energy Industry Revenue Share (%), by Country 2024 & 2032
- Figure 6: UAE UAE Solar Energy Industry Volume Share (%), by Country 2024 & 2032
- Figure 7: North America UAE Solar Energy Industry Revenue (Million), by Technology 2024 & 2032
- Figure 8: North America UAE Solar Energy Industry Volume (gigawatt), by Technology 2024 & 2032
- Figure 9: North America UAE Solar Energy Industry Revenue Share (%), by Technology 2024 & 2032
- Figure 10: North America UAE Solar Energy Industry Volume Share (%), by Technology 2024 & 2032
- Figure 11: North America UAE Solar Energy Industry Revenue (Million), by Deployment 2024 & 2032
- Figure 12: North America UAE Solar Energy Industry Volume (gigawatt), by Deployment 2024 & 2032
- Figure 13: North America UAE Solar Energy Industry Revenue Share (%), by Deployment 2024 & 2032
- Figure 14: North America UAE Solar Energy Industry Volume Share (%), by Deployment 2024 & 2032
- Figure 15: North America UAE Solar Energy Industry Revenue (Million), by Country 2024 & 2032
- Figure 16: North America UAE Solar Energy Industry Volume (gigawatt), by Country 2024 & 2032
- Figure 17: North America UAE Solar Energy Industry Revenue Share (%), by Country 2024 & 2032
- Figure 18: North America UAE Solar Energy Industry Volume Share (%), by Country 2024 & 2032
- Figure 19: South America UAE Solar Energy Industry Revenue (Million), by Technology 2024 & 2032
- Figure 20: South America UAE Solar Energy Industry Volume (gigawatt), by Technology 2024 & 2032
- Figure 21: South America UAE Solar Energy Industry Revenue Share (%), by Technology 2024 & 2032
- Figure 22: South America UAE Solar Energy Industry Volume Share (%), by Technology 2024 & 2032
- Figure 23: South America UAE Solar Energy Industry Revenue (Million), by Deployment 2024 & 2032
- Figure 24: South America UAE Solar Energy Industry Volume (gigawatt), by Deployment 2024 & 2032
- Figure 25: South America UAE Solar Energy Industry Revenue Share (%), by Deployment 2024 & 2032
- Figure 26: South America UAE Solar Energy Industry Volume Share (%), by Deployment 2024 & 2032
- Figure 27: South America UAE Solar Energy Industry Revenue (Million), by Country 2024 & 2032
- Figure 28: South America UAE Solar Energy Industry Volume (gigawatt), by Country 2024 & 2032
- Figure 29: South America UAE Solar Energy Industry Revenue Share (%), by Country 2024 & 2032
- Figure 30: South America UAE Solar Energy Industry Volume Share (%), by Country 2024 & 2032
- Figure 31: Europe UAE Solar Energy Industry Revenue (Million), by Technology 2024 & 2032
- Figure 32: Europe UAE Solar Energy Industry Volume (gigawatt), by Technology 2024 & 2032
- Figure 33: Europe UAE Solar Energy Industry Revenue Share (%), by Technology 2024 & 2032
- Figure 34: Europe UAE Solar Energy Industry Volume Share (%), by Technology 2024 & 2032
- Figure 35: Europe UAE Solar Energy Industry Revenue (Million), by Deployment 2024 & 2032
- Figure 36: Europe UAE Solar Energy Industry Volume (gigawatt), by Deployment 2024 & 2032
- Figure 37: Europe UAE Solar Energy Industry Revenue Share (%), by Deployment 2024 & 2032
- Figure 38: Europe UAE Solar Energy Industry Volume Share (%), by Deployment 2024 & 2032
- Figure 39: Europe UAE Solar Energy Industry Revenue (Million), by Country 2024 & 2032
- Figure 40: Europe UAE Solar Energy Industry Volume (gigawatt), by Country 2024 & 2032
- Figure 41: Europe UAE Solar Energy Industry Revenue Share (%), by Country 2024 & 2032
- Figure 42: Europe UAE Solar Energy Industry Volume Share (%), by Country 2024 & 2032
- Figure 43: Middle East & Africa UAE Solar Energy Industry Revenue (Million), by Technology 2024 & 2032
- Figure 44: Middle East & Africa UAE Solar Energy Industry Volume (gigawatt), by Technology 2024 & 2032
- Figure 45: Middle East & Africa UAE Solar Energy Industry Revenue Share (%), by Technology 2024 & 2032
- Figure 46: Middle East & Africa UAE Solar Energy Industry Volume Share (%), by Technology 2024 & 2032
- Figure 47: Middle East & Africa UAE Solar Energy Industry Revenue (Million), by Deployment 2024 & 2032
- Figure 48: Middle East & Africa UAE Solar Energy Industry Volume (gigawatt), by Deployment 2024 & 2032
- Figure 49: Middle East & Africa UAE Solar Energy Industry Revenue Share (%), by Deployment 2024 & 2032
- Figure 50: Middle East & Africa UAE Solar Energy Industry Volume Share (%), by Deployment 2024 & 2032
- Figure 51: Middle East & Africa UAE Solar Energy Industry Revenue (Million), by Country 2024 & 2032
- Figure 52: Middle East & Africa UAE Solar Energy Industry Volume (gigawatt), by Country 2024 & 2032
- Figure 53: Middle East & Africa UAE Solar Energy Industry Revenue Share (%), by Country 2024 & 2032
- Figure 54: Middle East & Africa UAE Solar Energy Industry Volume Share (%), by Country 2024 & 2032
- Figure 55: Asia Pacific UAE Solar Energy Industry Revenue (Million), by Technology 2024 & 2032
- Figure 56: Asia Pacific UAE Solar Energy Industry Volume (gigawatt), by Technology 2024 & 2032
- Figure 57: Asia Pacific UAE Solar Energy Industry Revenue Share (%), by Technology 2024 & 2032
- Figure 58: Asia Pacific UAE Solar Energy Industry Volume Share (%), by Technology 2024 & 2032
- Figure 59: Asia Pacific UAE Solar Energy Industry Revenue (Million), by Deployment 2024 & 2032
- Figure 60: Asia Pacific UAE Solar Energy Industry Volume (gigawatt), by Deployment 2024 & 2032
- Figure 61: Asia Pacific UAE Solar Energy Industry Revenue Share (%), by Deployment 2024 & 2032
- Figure 62: Asia Pacific UAE Solar Energy Industry Volume Share (%), by Deployment 2024 & 2032
- Figure 63: Asia Pacific UAE Solar Energy Industry Revenue (Million), by Country 2024 & 2032
- Figure 64: Asia Pacific UAE Solar Energy Industry Volume (gigawatt), by Country 2024 & 2032
- Figure 65: Asia Pacific UAE Solar Energy Industry Revenue Share (%), by Country 2024 & 2032
- Figure 66: Asia Pacific UAE Solar Energy Industry Volume Share (%), by Country 2024 & 2032
List of Tables
- Table 1: Global UAE Solar Energy Industry Revenue Million Forecast, by Region 2019 & 2032
- Table 2: Global UAE Solar Energy Industry Volume gigawatt Forecast, by Region 2019 & 2032
- Table 3: Global UAE Solar Energy Industry Revenue Million Forecast, by Technology 2019 & 2032
- Table 4: Global UAE Solar Energy Industry Volume gigawatt Forecast, by Technology 2019 & 2032
- Table 5: Global UAE Solar Energy Industry Revenue Million Forecast, by Deployment 2019 & 2032
- Table 6: Global UAE Solar Energy Industry Volume gigawatt Forecast, by Deployment 2019 & 2032
- Table 7: Global UAE Solar Energy Industry Revenue Million Forecast, by Region 2019 & 2032
- Table 8: Global UAE Solar Energy Industry Volume gigawatt Forecast, by Region 2019 & 2032
- Table 9: Global UAE Solar Energy Industry Revenue Million Forecast, by Country 2019 & 2032
- Table 10: Global UAE Solar Energy Industry Volume gigawatt Forecast, by Country 2019 & 2032
- Table 11: Global UAE Solar Energy Industry Revenue Million Forecast, by Technology 2019 & 2032
- Table 12: Global UAE Solar Energy Industry Volume gigawatt Forecast, by Technology 2019 & 2032
- Table 13: Global UAE Solar Energy Industry Revenue Million Forecast, by Deployment 2019 & 2032
- Table 14: Global UAE Solar Energy Industry Volume gigawatt Forecast, by Deployment 2019 & 2032
- Table 15: Global UAE Solar Energy Industry Revenue Million Forecast, by Country 2019 & 2032
- Table 16: Global UAE Solar Energy Industry Volume gigawatt Forecast, by Country 2019 & 2032
- Table 17: United States UAE Solar Energy Industry Revenue (Million) Forecast, by Application 2019 & 2032
- Table 18: United States UAE Solar Energy Industry Volume (gigawatt) Forecast, by Application 2019 & 2032
- Table 19: Canada UAE Solar Energy Industry Revenue (Million) Forecast, by Application 2019 & 2032
- Table 20: Canada UAE Solar Energy Industry Volume (gigawatt) Forecast, by Application 2019 & 2032
- Table 21: Mexico UAE Solar Energy Industry Revenue (Million) Forecast, by Application 2019 & 2032
- Table 22: Mexico UAE Solar Energy Industry Volume (gigawatt) Forecast, by Application 2019 & 2032
- Table 23: Global UAE Solar Energy Industry Revenue Million Forecast, by Technology 2019 & 2032
- Table 24: Global UAE Solar Energy Industry Volume gigawatt Forecast, by Technology 2019 & 2032
- Table 25: Global UAE Solar Energy Industry Revenue Million Forecast, by Deployment 2019 & 2032
- Table 26: Global UAE Solar Energy Industry Volume gigawatt Forecast, by Deployment 2019 & 2032
- Table 27: Global UAE Solar Energy Industry Revenue Million Forecast, by Country 2019 & 2032
- Table 28: Global UAE Solar Energy Industry Volume gigawatt Forecast, by Country 2019 & 2032
- Table 29: Brazil UAE Solar Energy Industry Revenue (Million) Forecast, by Application 2019 & 2032
- Table 30: Brazil UAE Solar Energy Industry Volume (gigawatt) Forecast, by Application 2019 & 2032
- Table 31: Argentina UAE Solar Energy Industry Revenue (Million) Forecast, by Application 2019 & 2032
- Table 32: Argentina UAE Solar Energy Industry Volume (gigawatt) Forecast, by Application 2019 & 2032
- Table 33: Rest of South America UAE Solar Energy Industry Revenue (Million) Forecast, by Application 2019 & 2032
- Table 34: Rest of South America UAE Solar Energy Industry Volume (gigawatt) Forecast, by Application 2019 & 2032
- Table 35: Global UAE Solar Energy Industry Revenue Million Forecast, by Technology 2019 & 2032
- Table 36: Global UAE Solar Energy Industry Volume gigawatt Forecast, by Technology 2019 & 2032
- Table 37: Global UAE Solar Energy Industry Revenue Million Forecast, by Deployment 2019 & 2032
- Table 38: Global UAE Solar Energy Industry Volume gigawatt Forecast, by Deployment 2019 & 2032
- Table 39: Global UAE Solar Energy Industry Revenue Million Forecast, by Country 2019 & 2032
- Table 40: Global UAE Solar Energy Industry Volume gigawatt Forecast, by Country 2019 & 2032
- Table 41: United Kingdom UAE Solar Energy Industry Revenue (Million) Forecast, by Application 2019 & 2032
- Table 42: United Kingdom UAE Solar Energy Industry Volume (gigawatt) Forecast, by Application 2019 & 2032
- Table 43: Germany UAE Solar Energy Industry Revenue (Million) Forecast, by Application 2019 & 2032
- Table 44: Germany UAE Solar Energy Industry Volume (gigawatt) Forecast, by Application 2019 & 2032
- Table 45: France UAE Solar Energy Industry Revenue (Million) Forecast, by Application 2019 & 2032
- Table 46: France UAE Solar Energy Industry Volume (gigawatt) Forecast, by Application 2019 & 2032
- Table 47: Italy UAE Solar Energy Industry Revenue (Million) Forecast, by Application 2019 & 2032
- Table 48: Italy UAE Solar Energy Industry Volume (gigawatt) Forecast, by Application 2019 & 2032
- Table 49: Spain UAE Solar Energy Industry Revenue (Million) Forecast, by Application 2019 & 2032
- Table 50: Spain UAE Solar Energy Industry Volume (gigawatt) Forecast, by Application 2019 & 2032
- Table 51: Russia UAE Solar Energy Industry Revenue (Million) Forecast, by Application 2019 & 2032
- Table 52: Russia UAE Solar Energy Industry Volume (gigawatt) Forecast, by Application 2019 & 2032
- Table 53: Benelux UAE Solar Energy Industry Revenue (Million) Forecast, by Application 2019 & 2032
- Table 54: Benelux UAE Solar Energy Industry Volume (gigawatt) Forecast, by Application 2019 & 2032
- Table 55: Nordics UAE Solar Energy Industry Revenue (Million) Forecast, by Application 2019 & 2032
- Table 56: Nordics UAE Solar Energy Industry Volume (gigawatt) Forecast, by Application 2019 & 2032
- Table 57: Rest of Europe UAE Solar Energy Industry Revenue (Million) Forecast, by Application 2019 & 2032
- Table 58: Rest of Europe UAE Solar Energy Industry Volume (gigawatt) Forecast, by Application 2019 & 2032
- Table 59: Global UAE Solar Energy Industry Revenue Million Forecast, by Technology 2019 & 2032
- Table 60: Global UAE Solar Energy Industry Volume gigawatt Forecast, by Technology 2019 & 2032
- Table 61: Global UAE Solar Energy Industry Revenue Million Forecast, by Deployment 2019 & 2032
- Table 62: Global UAE Solar Energy Industry Volume gigawatt Forecast, by Deployment 2019 & 2032
- Table 63: Global UAE Solar Energy Industry Revenue Million Forecast, by Country 2019 & 2032
- Table 64: Global UAE Solar Energy Industry Volume gigawatt Forecast, by Country 2019 & 2032
- Table 65: Turkey UAE Solar Energy Industry Revenue (Million) Forecast, by Application 2019 & 2032
- Table 66: Turkey UAE Solar Energy Industry Volume (gigawatt) Forecast, by Application 2019 & 2032
- Table 67: Israel UAE Solar Energy Industry Revenue (Million) Forecast, by Application 2019 & 2032
- Table 68: Israel UAE Solar Energy Industry Volume (gigawatt) Forecast, by Application 2019 & 2032
- Table 69: GCC UAE Solar Energy Industry Revenue (Million) Forecast, by Application 2019 & 2032
- Table 70: GCC UAE Solar Energy Industry Volume (gigawatt) Forecast, by Application 2019 & 2032
- Table 71: North Africa UAE Solar Energy Industry Revenue (Million) Forecast, by Application 2019 & 2032
- Table 72: North Africa UAE Solar Energy Industry Volume (gigawatt) Forecast, by Application 2019 & 2032
- Table 73: South Africa UAE Solar Energy Industry Revenue (Million) Forecast, by Application 2019 & 2032
- Table 74: South Africa UAE Solar Energy Industry Volume (gigawatt) Forecast, by Application 2019 & 2032
- Table 75: Rest of Middle East & Africa UAE Solar Energy Industry Revenue (Million) Forecast, by Application 2019 & 2032
- Table 76: Rest of Middle East & Africa UAE Solar Energy Industry Volume (gigawatt) Forecast, by Application 2019 & 2032
- Table 77: Global UAE Solar Energy Industry Revenue Million Forecast, by Technology 2019 & 2032
- Table 78: Global UAE Solar Energy Industry Volume gigawatt Forecast, by Technology 2019 & 2032
- Table 79: Global UAE Solar Energy Industry Revenue Million Forecast, by Deployment 2019 & 2032
- Table 80: Global UAE Solar Energy Industry Volume gigawatt Forecast, by Deployment 2019 & 2032
- Table 81: Global UAE Solar Energy Industry Revenue Million Forecast, by Country 2019 & 2032
- Table 82: Global UAE Solar Energy Industry Volume gigawatt Forecast, by Country 2019 & 2032
- Table 83: China UAE Solar Energy Industry Revenue (Million) Forecast, by Application 2019 & 2032
- Table 84: China UAE Solar Energy Industry Volume (gigawatt) Forecast, by Application 2019 & 2032
- Table 85: India UAE Solar Energy Industry Revenue (Million) Forecast, by Application 2019 & 2032
- Table 86: India UAE Solar Energy Industry Volume (gigawatt) Forecast, by Application 2019 & 2032
- Table 87: Japan UAE Solar Energy Industry Revenue (Million) Forecast, by Application 2019 & 2032
- Table 88: Japan UAE Solar Energy Industry Volume (gigawatt) Forecast, by Application 2019 & 2032
- Table 89: South Korea UAE Solar Energy Industry Revenue (Million) Forecast, by Application 2019 & 2032
- Table 90: South Korea UAE Solar Energy Industry Volume (gigawatt) Forecast, by Application 2019 & 2032
- Table 91: ASEAN UAE Solar Energy Industry Revenue (Million) Forecast, by Application 2019 & 2032
- Table 92: ASEAN UAE Solar Energy Industry Volume (gigawatt) Forecast, by Application 2019 & 2032
- Table 93: Oceania UAE Solar Energy Industry Revenue (Million) Forecast, by Application 2019 & 2032
- Table 94: Oceania UAE Solar Energy Industry Volume (gigawatt) Forecast, by Application 2019 & 2032
- Table 95: Rest of Asia Pacific UAE Solar Energy Industry Revenue (Million) Forecast, by Application 2019 & 2032
- Table 96: Rest of Asia Pacific UAE Solar Energy Industry Volume (gigawatt) Forecast, by Application 2019 & 2032
Frequently Asked Questions
1. What is the projected Compound Annual Growth Rate (CAGR) of the UAE Solar Energy Industry?
The projected CAGR is approximately 35.48%.
2. Which companies are prominent players in the UAE Solar Energy Industry?
Key companies in the market include JinkoSolar Holding Co Ltd, Sunergy Solar, CleanMax Mena FZCO*List Not Exhaustive, Canadian Solar Inc, City Solar, Masdar (Abu Dhabi Future Energy Company), MAYSUN SOLAR FZCO, Enerwhere, ACWA Power.
3. What are the main segments of the UAE Solar Energy Industry?
The market segments include Technology, Deployment.
4. Can you provide details about the market size?
The market size is estimated to be USD XX Million as of 2022.
5. What are some drivers contributing to market growth?
4.; Rising Government Policies to Support Solar PV Installation4.; Rising Installation of Renewable Energy to Reduce Dependency on Fossil Fuels.
6. What are the notable trends driving market growth?
Solar Photovoltaic to Dominate the Market.
7. Are there any restraints impacting market growth?
4.; Rising Adoption of Alternative Clean Energy Sources such as Wind. Geothermal. Bioenergy. and Others.
8. Can you provide examples of recent developments in the market?
May 2023: ADNOC Distribution announced a key partnership with Emerge, a joint venture between EDF and Masdar, to develop on-site solar power across its service station network. The project will commence in Dubai in 2023 to generate clean energy.
9. What pricing options are available for accessing the report?
Pricing options include single-user, multi-user, and enterprise licenses priced at USD 3800, USD 4500, and USD 5800 respectively.
10. Is the market size provided in terms of value or volume?
The market size is provided in terms of value, measured in Million and volume, measured in gigawatt.
11. Are there any specific market keywords associated with the report?
Yes, the market keyword associated with the report is "UAE Solar Energy Industry," which aids in identifying and referencing the specific market segment covered.
12. How do I determine which pricing option suits my needs best?
The pricing options vary based on user requirements and access needs. Individual users may opt for single-user licenses, while businesses requiring broader access may choose multi-user or enterprise licenses for cost-effective access to the report.
13. Are there any additional resources or data provided in the UAE Solar Energy Industry report?
While the report offers comprehensive insights, it's advisable to review the specific contents or supplementary materials provided to ascertain if additional resources or data are available.
14. How can I stay updated on further developments or reports in the UAE Solar Energy Industry?
To stay informed about further developments, trends, and reports in the UAE Solar Energy Industry, consider subscribing to industry newsletters, following relevant companies and organizations, or regularly checking reputable industry news sources and publications.
Methodology
Step 1 - Identification of Relevant Samples Size from Population Database


Step 2 - Approaches for Defining Global Market Size (Value, Volume* & Price*)

Note*: In applicable scenarios
Step 3 - Data Sources
Primary Research
- Web Analytics
- Survey Reports
- Research Institute
- Latest Research Reports
- Opinion Leaders
Secondary Research
- Annual Reports
- White Paper
- Latest Press Release
- Industry Association
- Paid Database
- Investor Presentations

Step 4 - Data Triangulation
Involves using different sources of information in order to increase the validity of a study
These sources are likely to be stakeholders in a program - participants, other researchers, program staff, other community members, and so on.
Then we put all data in single framework & apply various statistical tools to find out the dynamic on the market.
During the analysis stage, feedback from the stakeholder groups would be compared to determine areas of agreement as well as areas of divergence


