
Key Insights
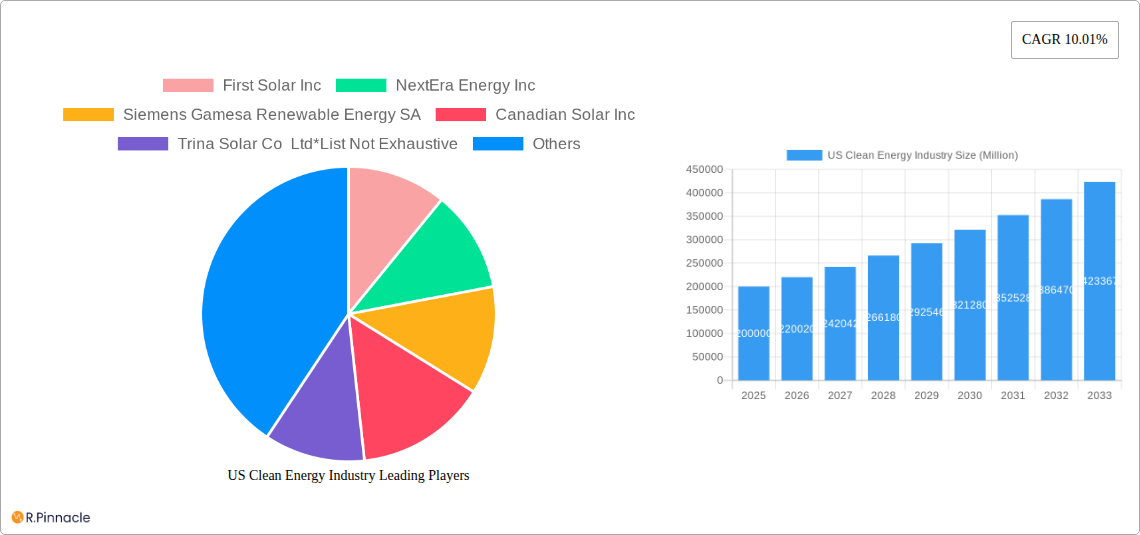
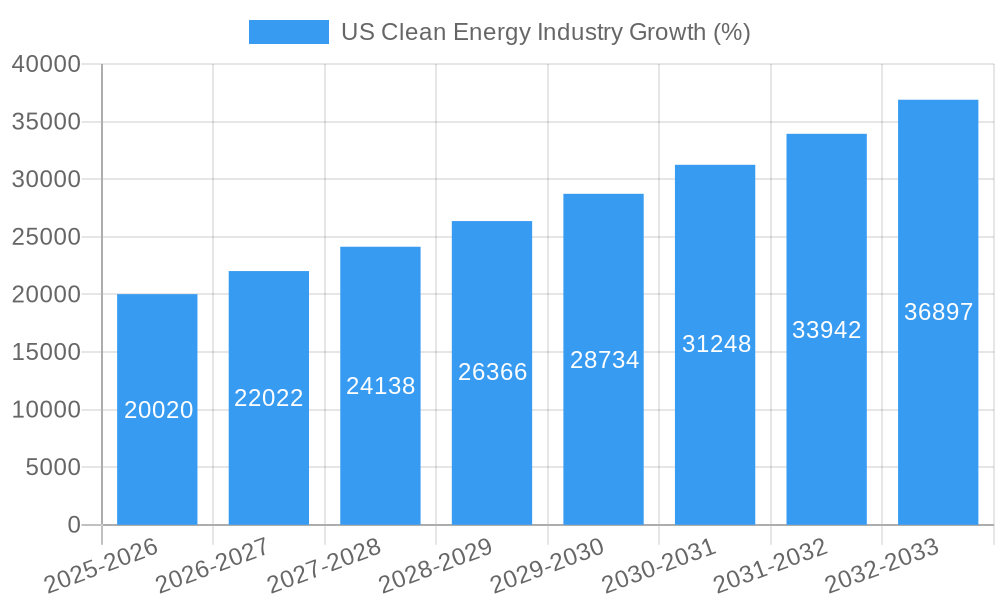
The US clean energy industry is experiencing robust growth, driven by increasing concerns about climate change, supportive government policies, and decreasing technology costs. The market, valued at an estimated $200 billion in 2025, is projected to expand at a compound annual growth rate (CAGR) of 10.01% from 2025 to 2033. This growth is fueled by several key factors. Firstly, the rising adoption of renewable energy sources like solar, wind, and hydropower is significantly impacting the energy mix. Government incentives, including tax credits and subsidies, are further accelerating the transition to cleaner energy sources. Secondly, advancements in energy storage technologies are addressing the intermittency challenges associated with renewable energy, enhancing their reliability and competitiveness. Thirdly, corporate sustainability initiatives and growing consumer demand for environmentally friendly energy are driving investments in renewable energy projects. The residential sector, in particular, is witnessing rapid growth in solar energy installations.
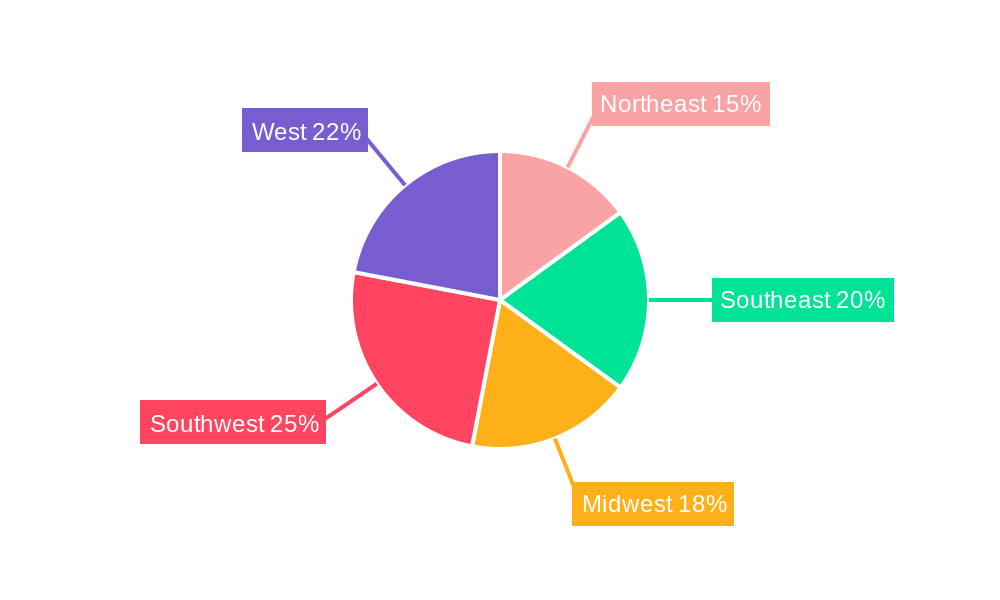
However, the industry also faces certain restraints. These include the intermittent nature of renewable energy sources, requiring investment in grid modernization and energy storage solutions. Permitting processes and regulatory hurdles can also delay project timelines. Furthermore, the upfront capital costs associated with renewable energy projects can be significant, particularly for smaller-scale projects. Despite these challenges, the long-term outlook for the US clean energy industry remains positive. The increasing economic viability of renewable energy, coupled with supportive policy frameworks and growing environmental awareness, ensures sustained market expansion across various segments including electricity generation, transportation, heating and cooling, and industrial processes. Key players such as First Solar, NextEra Energy, and Siemens Gamesa are actively shaping the market landscape through innovation and expansion. Geographic growth will be significant in all regions of the US, although the Southwest and West are likely to experience faster growth due to their higher solar irradiation levels.
US Clean Energy Industry Market Report: 2019-2033
This comprehensive report provides an in-depth analysis of the US clean energy industry, offering invaluable insights for industry professionals, investors, and policymakers. Covering the period 2019-2033, with a base year of 2025 and a forecast period of 2025-2033, this report details market dynamics, technological advancements, and key players shaping the future of clean energy in the United States. The report projects a robust growth trajectory, driven by supportive government policies, increasing consumer demand, and technological innovations. Expect detailed analysis of market size (in Millions USD), CAGR, and market share across various segments.
US Clean Energy Industry Market Structure & Innovation Trends
This section analyzes the competitive landscape of the US clean energy market, exploring market concentration, innovation drivers, regulatory frameworks, and M&A activities. The report includes a detailed examination of leading companies such as First Solar Inc, NextEra Energy Inc, Siemens Gamesa Renewable Energy SA, Canadian Solar Inc, Trina Solar Co Ltd, Sunrun Inc, Vestas Wind Systems AS, General Electric Company, and Mitsubishi Heavy Industries Ltd (list not exhaustive). We delve into market share distribution amongst these players and analyze the impact of significant mergers and acquisitions, quantifying deal values where available. The regulatory landscape, including federal and state-level incentives and policies, is thoroughly investigated, assessing their influence on market growth and innovation. Finally, the report explores the interplay of substitute products and the evolving demographics of end-users.
US Clean Energy Industry Market Dynamics & Trends
This section examines the key drivers and trends shaping the US clean energy market. We explore the factors contributing to market growth, such as increasing renewable energy mandates, declining technology costs, and growing environmental awareness. The report will quantify this growth using metrics like Compound Annual Growth Rate (CAGR) and market penetration rates across various clean energy technologies. Furthermore, we analyze technological disruptions, including advancements in solar PV, wind turbine technology, and energy storage solutions, along with their impact on market competitiveness. Consumer preferences, shifting energy consumption patterns, and the influence of evolving technological advancements are deeply investigated. Finally, a competitive analysis will highlight the strategic moves and competitive dynamics of major players in the market, evaluating their market positioning and strategies. The projected market size for 2033 is estimated at xx Million USD.
Dominant Regions & Segments in US Clean Energy Industry
This section identifies the leading regions and segments within the US clean energy industry, focusing on Technology (Solar energy, Wind energy, Biomass, Hydropower, Geothermal), End User (Utilities, Corporate Buyers, Residential Consumers), and Application (Electricity Generation, Transportation, Heating and Cooling, Industrial Processes). Key drivers for each dominant segment are identified and analyzed using bullet points, focusing on factors such as economic policies, infrastructure development, and regional specific factors. A detailed dominance analysis for each segment will be presented, evaluating the factors contributing to its market leadership, including geographical distribution and growth projections.
- Technology: Analysis will reveal the dominant technology, with supporting evidence regarding capacity additions, investment trends, and technological advancements.
- End User: This section will pinpoint the most significant end-user segment, detailing their consumption patterns and future growth potential.
- Application: The report will highlight the application segment demonstrating the highest growth and potential, offering insights into the underlying factors.
US Clean Energy Industry Product Innovations
This section summarizes recent product developments in the US clean energy sector, highlighting key technological advancements and their market fit. We will analyze the competitive advantages offered by these new products and technologies, focusing on factors such as efficiency improvements, cost reductions, and enhanced performance. The focus will be on innovative materials, advanced manufacturing processes, and smart grid technologies.
Report Scope & Segmentation Analysis
This report segments the US clean energy market by Technology (Solar, Wind, Biomass, Hydropower, Geothermal), End User (Utilities, Corporate Buyers, Residential), and Application (Electricity Generation, Transportation, Heating & Cooling, Industrial Processes). Each segment includes detailed analysis of growth projections, market size (in Millions USD) for both historical (2019-2024) and forecast (2025-2033) periods, and competitive dynamics.
Key Drivers of US Clean Energy Industry Growth
This section outlines the key factors driving growth in the US clean energy industry. These include supportive government policies (e.g., tax credits, renewable portfolio standards), decreasing technology costs, and increasing consumer demand for sustainable energy solutions. Technological advancements in efficiency and storage will also be discussed, along with the overall increasing environmental awareness.
Challenges in the US Clean Energy Industry Sector
This section identifies key challenges facing the US clean energy industry. These include potential regulatory hurdles, supply chain disruptions (with quantifiable impacts on market growth), intermittency issues of renewable energy sources, and ongoing competitive pressures from conventional energy sources.
Emerging Opportunities in US Clean Energy Industry
This section explores emerging opportunities within the US clean energy market. These include growth in new market segments (e.g., green hydrogen, energy storage), advancements in innovative technologies, and evolving consumer preferences towards sustainable energy solutions.
Leading Players in the US Clean Energy Industry Market
- First Solar Inc
- NextEra Energy Inc
- Siemens Gamesa Renewable Energy SA
- Canadian Solar Inc
- Trina Solar Co Ltd
- Sunrun Inc
- Vestas Wind Systems AS
- General Electric Company
- Mitsubishi Heavy Industries Ltd
Key Developments in US Clean Energy Industry
- March 2023: The US Energy Information Administration announced that renewable energy surpassed coal in electricity generation for the first time in 2022, exceeding nuclear generation as well. This signifies a significant market shift towards renewable energy sources.
- May 2022: Greenlane Renewables Inc. secured a USD 6.8 million contract for a dairy manure-to-renewable natural gas (RNG) project. This illustrates the growing potential of biogas and RNG in the US clean energy market.
- May 2022: The Host Group initiated plans to build three biogas plants in New York and Ohio, with a projected capacity to power approximately 3,000 American family cars annually using bio-CNG. This highlights significant investment in biogas infrastructure and its potential impact on transportation.
Future Outlook for US Clean Energy Industry Market
The US clean energy industry is poised for continued strong growth, driven by supportive government policies, technological advancements, and growing consumer demand for sustainable energy. Strategic opportunities exist for companies to invest in innovative technologies, expand into new market segments, and capitalize on the increasing adoption of renewable energy solutions. The market is projected to experience significant expansion in the coming years, with substantial investment in renewable energy infrastructure and innovative technologies expected to fuel this growth.
US Clean Energy Industry Segmentation
- 1. Wind
- 2. Solar
- 3. Hydropower
- 4. Bioenergy
- 5. Other So
US Clean Energy Industry Segmentation By Geography
-
1. North America
- 1.1. United States
- 1.2. Canada
- 1.3. Mexico
-
2. South America
- 2.1. Brazil
- 2.2. Argentina
- 2.3. Rest of South America
-
3. Europe
- 3.1. United Kingdom
- 3.2. Germany
- 3.3. France
- 3.4. Italy
- 3.5. Spain
- 3.6. Russia
- 3.7. Benelux
- 3.8. Nordics
- 3.9. Rest of Europe
-
4. Middle East & Africa
- 4.1. Turkey
- 4.2. Israel
- 4.3. GCC
- 4.4. North Africa
- 4.5. South Africa
- 4.6. Rest of Middle East & Africa
-
5. Asia Pacific
- 5.1. China
- 5.2. India
- 5.3. Japan
- 5.4. South Korea
- 5.5. ASEAN
- 5.6. Oceania
- 5.7. Rest of Asia Pacific
US Clean Energy Industry REPORT HIGHLIGHTS
| Aspects | Details |
|---|---|
| Study Period | 2019-2033 |
| Base Year | 2024 |
| Estimated Year | 2025 |
| Forecast Period | 2025-2033 |
| Historical Period | 2019-2024 |
| Growth Rate | CAGR of 10.01% from 2019-2033 |
| Segmentation |
|
Table of Contents
- 1. Introduction
- 1.1. Research Scope
- 1.2. Market Segmentation
- 1.3. Research Methodology
- 1.4. Definitions and Assumptions
- 2. Executive Summary
- 2.1. Introduction
- 3. Market Dynamics
- 3.1. Introduction
- 3.2. Market Drivers
- 3.2.1. Supportive Government Policies and Incentives4.; Environmental Concerns
- 3.3. Market Restrains
- 3.3.1. Fossil Fuel Subsidies
- 3.4. Market Trends
- 3.4.1. Solar Energy to Witness Significant Growth
- 4. Market Factor Analysis
- 4.1. Porters Five Forces
- 4.2. Supply/Value Chain
- 4.3. PESTEL analysis
- 4.4. Market Entropy
- 4.5. Patent/Trademark Analysis
- 5. Global US Clean Energy Industry Analysis, Insights and Forecast, 2019-2031
- 5.1. Market Analysis, Insights and Forecast - by Wind
- 5.2. Market Analysis, Insights and Forecast - by Solar
- 5.3. Market Analysis, Insights and Forecast - by Hydropower
- 5.4. Market Analysis, Insights and Forecast - by Bioenergy
- 5.5. Market Analysis, Insights and Forecast - by Other So
- 5.6. Market Analysis, Insights and Forecast - by Region
- 5.6.1. North America
- 5.6.2. South America
- 5.6.3. Europe
- 5.6.4. Middle East & Africa
- 5.6.5. Asia Pacific
- 5.1. Market Analysis, Insights and Forecast - by Wind
- 6. North America US Clean Energy Industry Analysis, Insights and Forecast, 2019-2031
- 6.1. Market Analysis, Insights and Forecast - by Wind
- 6.2. Market Analysis, Insights and Forecast - by Solar
- 6.3. Market Analysis, Insights and Forecast - by Hydropower
- 6.4. Market Analysis, Insights and Forecast - by Bioenergy
- 6.5. Market Analysis, Insights and Forecast - by Other So
- 6.1. Market Analysis, Insights and Forecast - by Wind
- 7. South America US Clean Energy Industry Analysis, Insights and Forecast, 2019-2031
- 7.1. Market Analysis, Insights and Forecast - by Wind
- 7.2. Market Analysis, Insights and Forecast - by Solar
- 7.3. Market Analysis, Insights and Forecast - by Hydropower
- 7.4. Market Analysis, Insights and Forecast - by Bioenergy
- 7.5. Market Analysis, Insights and Forecast - by Other So
- 7.1. Market Analysis, Insights and Forecast - by Wind
- 8. Europe US Clean Energy Industry Analysis, Insights and Forecast, 2019-2031
- 8.1. Market Analysis, Insights and Forecast - by Wind
- 8.2. Market Analysis, Insights and Forecast - by Solar
- 8.3. Market Analysis, Insights and Forecast - by Hydropower
- 8.4. Market Analysis, Insights and Forecast - by Bioenergy
- 8.5. Market Analysis, Insights and Forecast - by Other So
- 8.1. Market Analysis, Insights and Forecast - by Wind
- 9. Middle East & Africa US Clean Energy Industry Analysis, Insights and Forecast, 2019-2031
- 9.1. Market Analysis, Insights and Forecast - by Wind
- 9.2. Market Analysis, Insights and Forecast - by Solar
- 9.3. Market Analysis, Insights and Forecast - by Hydropower
- 9.4. Market Analysis, Insights and Forecast - by Bioenergy
- 9.5. Market Analysis, Insights and Forecast - by Other So
- 9.1. Market Analysis, Insights and Forecast - by Wind
- 10. Asia Pacific US Clean Energy Industry Analysis, Insights and Forecast, 2019-2031
- 10.1. Market Analysis, Insights and Forecast - by Wind
- 10.2. Market Analysis, Insights and Forecast - by Solar
- 10.3. Market Analysis, Insights and Forecast - by Hydropower
- 10.4. Market Analysis, Insights and Forecast - by Bioenergy
- 10.5. Market Analysis, Insights and Forecast - by Other So
- 10.1. Market Analysis, Insights and Forecast - by Wind
- 11. Northeast US Clean Energy Industry Analysis, Insights and Forecast, 2019-2031
- 12. Southeast US Clean Energy Industry Analysis, Insights and Forecast, 2019-2031
- 13. Midwest US Clean Energy Industry Analysis, Insights and Forecast, 2019-2031
- 14. Southwest US Clean Energy Industry Analysis, Insights and Forecast, 2019-2031
- 15. West US Clean Energy Industry Analysis, Insights and Forecast, 2019-2031
- 16. Competitive Analysis
- 16.1. Global Market Share Analysis 2024
- 16.2. Company Profiles
- 16.2.1 First Solar Inc
- 16.2.1.1. Overview
- 16.2.1.2. Products
- 16.2.1.3. SWOT Analysis
- 16.2.1.4. Recent Developments
- 16.2.1.5. Financials (Based on Availability)
- 16.2.2 NextEra Energy Inc
- 16.2.2.1. Overview
- 16.2.2.2. Products
- 16.2.2.3. SWOT Analysis
- 16.2.2.4. Recent Developments
- 16.2.2.5. Financials (Based on Availability)
- 16.2.3 Siemens Gamesa Renewable Energy SA
- 16.2.3.1. Overview
- 16.2.3.2. Products
- 16.2.3.3. SWOT Analysis
- 16.2.3.4. Recent Developments
- 16.2.3.5. Financials (Based on Availability)
- 16.2.4 Canadian Solar Inc
- 16.2.4.1. Overview
- 16.2.4.2. Products
- 16.2.4.3. SWOT Analysis
- 16.2.4.4. Recent Developments
- 16.2.4.5. Financials (Based on Availability)
- 16.2.5 Trina Solar Co Ltd*List Not Exhaustive
- 16.2.5.1. Overview
- 16.2.5.2. Products
- 16.2.5.3. SWOT Analysis
- 16.2.5.4. Recent Developments
- 16.2.5.5. Financials (Based on Availability)
- 16.2.6 Sunrun Inc
- 16.2.6.1. Overview
- 16.2.6.2. Products
- 16.2.6.3. SWOT Analysis
- 16.2.6.4. Recent Developments
- 16.2.6.5. Financials (Based on Availability)
- 16.2.7 Vestas Wind Systems AS
- 16.2.7.1. Overview
- 16.2.7.2. Products
- 16.2.7.3. SWOT Analysis
- 16.2.7.4. Recent Developments
- 16.2.7.5. Financials (Based on Availability)
- 16.2.8 General Electric Company
- 16.2.8.1. Overview
- 16.2.8.2. Products
- 16.2.8.3. SWOT Analysis
- 16.2.8.4. Recent Developments
- 16.2.8.5. Financials (Based on Availability)
- 16.2.9 Mitsubishi Heavy Industries Ltd
- 16.2.9.1. Overview
- 16.2.9.2. Products
- 16.2.9.3. SWOT Analysis
- 16.2.9.4. Recent Developments
- 16.2.9.5. Financials (Based on Availability)
- 16.2.1 First Solar Inc
List of Figures
- Figure 1: Global US Clean Energy Industry Revenue Breakdown (Million, %) by Region 2024 & 2032
- Figure 2: Global US Clean Energy Industry Volume Breakdown (gigawatt, %) by Region 2024 & 2032
- Figure 3: United states US Clean Energy Industry Revenue (Million), by Country 2024 & 2032
- Figure 4: United states US Clean Energy Industry Volume (gigawatt), by Country 2024 & 2032
- Figure 5: United states US Clean Energy Industry Revenue Share (%), by Country 2024 & 2032
- Figure 6: United states US Clean Energy Industry Volume Share (%), by Country 2024 & 2032
- Figure 7: North America US Clean Energy Industry Revenue (Million), by Wind 2024 & 2032
- Figure 8: North America US Clean Energy Industry Volume (gigawatt), by Wind 2024 & 2032
- Figure 9: North America US Clean Energy Industry Revenue Share (%), by Wind 2024 & 2032
- Figure 10: North America US Clean Energy Industry Volume Share (%), by Wind 2024 & 2032
- Figure 11: North America US Clean Energy Industry Revenue (Million), by Solar 2024 & 2032
- Figure 12: North America US Clean Energy Industry Volume (gigawatt), by Solar 2024 & 2032
- Figure 13: North America US Clean Energy Industry Revenue Share (%), by Solar 2024 & 2032
- Figure 14: North America US Clean Energy Industry Volume Share (%), by Solar 2024 & 2032
- Figure 15: North America US Clean Energy Industry Revenue (Million), by Hydropower 2024 & 2032
- Figure 16: North America US Clean Energy Industry Volume (gigawatt), by Hydropower 2024 & 2032
- Figure 17: North America US Clean Energy Industry Revenue Share (%), by Hydropower 2024 & 2032
- Figure 18: North America US Clean Energy Industry Volume Share (%), by Hydropower 2024 & 2032
- Figure 19: North America US Clean Energy Industry Revenue (Million), by Bioenergy 2024 & 2032
- Figure 20: North America US Clean Energy Industry Volume (gigawatt), by Bioenergy 2024 & 2032
- Figure 21: North America US Clean Energy Industry Revenue Share (%), by Bioenergy 2024 & 2032
- Figure 22: North America US Clean Energy Industry Volume Share (%), by Bioenergy 2024 & 2032
- Figure 23: North America US Clean Energy Industry Revenue (Million), by Other So 2024 & 2032
- Figure 24: North America US Clean Energy Industry Volume (gigawatt), by Other So 2024 & 2032
- Figure 25: North America US Clean Energy Industry Revenue Share (%), by Other So 2024 & 2032
- Figure 26: North America US Clean Energy Industry Volume Share (%), by Other So 2024 & 2032
- Figure 27: North America US Clean Energy Industry Revenue (Million), by Country 2024 & 2032
- Figure 28: North America US Clean Energy Industry Volume (gigawatt), by Country 2024 & 2032
- Figure 29: North America US Clean Energy Industry Revenue Share (%), by Country 2024 & 2032
- Figure 30: North America US Clean Energy Industry Volume Share (%), by Country 2024 & 2032
- Figure 31: South America US Clean Energy Industry Revenue (Million), by Wind 2024 & 2032
- Figure 32: South America US Clean Energy Industry Volume (gigawatt), by Wind 2024 & 2032
- Figure 33: South America US Clean Energy Industry Revenue Share (%), by Wind 2024 & 2032
- Figure 34: South America US Clean Energy Industry Volume Share (%), by Wind 2024 & 2032
- Figure 35: South America US Clean Energy Industry Revenue (Million), by Solar 2024 & 2032
- Figure 36: South America US Clean Energy Industry Volume (gigawatt), by Solar 2024 & 2032
- Figure 37: South America US Clean Energy Industry Revenue Share (%), by Solar 2024 & 2032
- Figure 38: South America US Clean Energy Industry Volume Share (%), by Solar 2024 & 2032
- Figure 39: South America US Clean Energy Industry Revenue (Million), by Hydropower 2024 & 2032
- Figure 40: South America US Clean Energy Industry Volume (gigawatt), by Hydropower 2024 & 2032
- Figure 41: South America US Clean Energy Industry Revenue Share (%), by Hydropower 2024 & 2032
- Figure 42: South America US Clean Energy Industry Volume Share (%), by Hydropower 2024 & 2032
- Figure 43: South America US Clean Energy Industry Revenue (Million), by Bioenergy 2024 & 2032
- Figure 44: South America US Clean Energy Industry Volume (gigawatt), by Bioenergy 2024 & 2032
- Figure 45: South America US Clean Energy Industry Revenue Share (%), by Bioenergy 2024 & 2032
- Figure 46: South America US Clean Energy Industry Volume Share (%), by Bioenergy 2024 & 2032
- Figure 47: South America US Clean Energy Industry Revenue (Million), by Other So 2024 & 2032
- Figure 48: South America US Clean Energy Industry Volume (gigawatt), by Other So 2024 & 2032
- Figure 49: South America US Clean Energy Industry Revenue Share (%), by Other So 2024 & 2032
- Figure 50: South America US Clean Energy Industry Volume Share (%), by Other So 2024 & 2032
- Figure 51: South America US Clean Energy Industry Revenue (Million), by Country 2024 & 2032
- Figure 52: South America US Clean Energy Industry Volume (gigawatt), by Country 2024 & 2032
- Figure 53: South America US Clean Energy Industry Revenue Share (%), by Country 2024 & 2032
- Figure 54: South America US Clean Energy Industry Volume Share (%), by Country 2024 & 2032
- Figure 55: Europe US Clean Energy Industry Revenue (Million), by Wind 2024 & 2032
- Figure 56: Europe US Clean Energy Industry Volume (gigawatt), by Wind 2024 & 2032
- Figure 57: Europe US Clean Energy Industry Revenue Share (%), by Wind 2024 & 2032
- Figure 58: Europe US Clean Energy Industry Volume Share (%), by Wind 2024 & 2032
- Figure 59: Europe US Clean Energy Industry Revenue (Million), by Solar 2024 & 2032
- Figure 60: Europe US Clean Energy Industry Volume (gigawatt), by Solar 2024 & 2032
- Figure 61: Europe US Clean Energy Industry Revenue Share (%), by Solar 2024 & 2032
- Figure 62: Europe US Clean Energy Industry Volume Share (%), by Solar 2024 & 2032
- Figure 63: Europe US Clean Energy Industry Revenue (Million), by Hydropower 2024 & 2032
- Figure 64: Europe US Clean Energy Industry Volume (gigawatt), by Hydropower 2024 & 2032
- Figure 65: Europe US Clean Energy Industry Revenue Share (%), by Hydropower 2024 & 2032
- Figure 66: Europe US Clean Energy Industry Volume Share (%), by Hydropower 2024 & 2032
- Figure 67: Europe US Clean Energy Industry Revenue (Million), by Bioenergy 2024 & 2032
- Figure 68: Europe US Clean Energy Industry Volume (gigawatt), by Bioenergy 2024 & 2032
- Figure 69: Europe US Clean Energy Industry Revenue Share (%), by Bioenergy 2024 & 2032
- Figure 70: Europe US Clean Energy Industry Volume Share (%), by Bioenergy 2024 & 2032
- Figure 71: Europe US Clean Energy Industry Revenue (Million), by Other So 2024 & 2032
- Figure 72: Europe US Clean Energy Industry Volume (gigawatt), by Other So 2024 & 2032
- Figure 73: Europe US Clean Energy Industry Revenue Share (%), by Other So 2024 & 2032
- Figure 74: Europe US Clean Energy Industry Volume Share (%), by Other So 2024 & 2032
- Figure 75: Europe US Clean Energy Industry Revenue (Million), by Country 2024 & 2032
- Figure 76: Europe US Clean Energy Industry Volume (gigawatt), by Country 2024 & 2032
- Figure 77: Europe US Clean Energy Industry Revenue Share (%), by Country 2024 & 2032
- Figure 78: Europe US Clean Energy Industry Volume Share (%), by Country 2024 & 2032
- Figure 79: Middle East & Africa US Clean Energy Industry Revenue (Million), by Wind 2024 & 2032
- Figure 80: Middle East & Africa US Clean Energy Industry Volume (gigawatt), by Wind 2024 & 2032
- Figure 81: Middle East & Africa US Clean Energy Industry Revenue Share (%), by Wind 2024 & 2032
- Figure 82: Middle East & Africa US Clean Energy Industry Volume Share (%), by Wind 2024 & 2032
- Figure 83: Middle East & Africa US Clean Energy Industry Revenue (Million), by Solar 2024 & 2032
- Figure 84: Middle East & Africa US Clean Energy Industry Volume (gigawatt), by Solar 2024 & 2032
- Figure 85: Middle East & Africa US Clean Energy Industry Revenue Share (%), by Solar 2024 & 2032
- Figure 86: Middle East & Africa US Clean Energy Industry Volume Share (%), by Solar 2024 & 2032
- Figure 87: Middle East & Africa US Clean Energy Industry Revenue (Million), by Hydropower 2024 & 2032
- Figure 88: Middle East & Africa US Clean Energy Industry Volume (gigawatt), by Hydropower 2024 & 2032
- Figure 89: Middle East & Africa US Clean Energy Industry Revenue Share (%), by Hydropower 2024 & 2032
- Figure 90: Middle East & Africa US Clean Energy Industry Volume Share (%), by Hydropower 2024 & 2032
- Figure 91: Middle East & Africa US Clean Energy Industry Revenue (Million), by Bioenergy 2024 & 2032
- Figure 92: Middle East & Africa US Clean Energy Industry Volume (gigawatt), by Bioenergy 2024 & 2032
- Figure 93: Middle East & Africa US Clean Energy Industry Revenue Share (%), by Bioenergy 2024 & 2032
- Figure 94: Middle East & Africa US Clean Energy Industry Volume Share (%), by Bioenergy 2024 & 2032
- Figure 95: Middle East & Africa US Clean Energy Industry Revenue (Million), by Other So 2024 & 2032
- Figure 96: Middle East & Africa US Clean Energy Industry Volume (gigawatt), by Other So 2024 & 2032
- Figure 97: Middle East & Africa US Clean Energy Industry Revenue Share (%), by Other So 2024 & 2032
- Figure 98: Middle East & Africa US Clean Energy Industry Volume Share (%), by Other So 2024 & 2032
- Figure 99: Middle East & Africa US Clean Energy Industry Revenue (Million), by Country 2024 & 2032
- Figure 100: Middle East & Africa US Clean Energy Industry Volume (gigawatt), by Country 2024 & 2032
- Figure 101: Middle East & Africa US Clean Energy Industry Revenue Share (%), by Country 2024 & 2032
- Figure 102: Middle East & Africa US Clean Energy Industry Volume Share (%), by Country 2024 & 2032
- Figure 103: Asia Pacific US Clean Energy Industry Revenue (Million), by Wind 2024 & 2032
- Figure 104: Asia Pacific US Clean Energy Industry Volume (gigawatt), by Wind 2024 & 2032
- Figure 105: Asia Pacific US Clean Energy Industry Revenue Share (%), by Wind 2024 & 2032
- Figure 106: Asia Pacific US Clean Energy Industry Volume Share (%), by Wind 2024 & 2032
- Figure 107: Asia Pacific US Clean Energy Industry Revenue (Million), by Solar 2024 & 2032
- Figure 108: Asia Pacific US Clean Energy Industry Volume (gigawatt), by Solar 2024 & 2032
- Figure 109: Asia Pacific US Clean Energy Industry Revenue Share (%), by Solar 2024 & 2032
- Figure 110: Asia Pacific US Clean Energy Industry Volume Share (%), by Solar 2024 & 2032
- Figure 111: Asia Pacific US Clean Energy Industry Revenue (Million), by Hydropower 2024 & 2032
- Figure 112: Asia Pacific US Clean Energy Industry Volume (gigawatt), by Hydropower 2024 & 2032
- Figure 113: Asia Pacific US Clean Energy Industry Revenue Share (%), by Hydropower 2024 & 2032
- Figure 114: Asia Pacific US Clean Energy Industry Volume Share (%), by Hydropower 2024 & 2032
- Figure 115: Asia Pacific US Clean Energy Industry Revenue (Million), by Bioenergy 2024 & 2032
- Figure 116: Asia Pacific US Clean Energy Industry Volume (gigawatt), by Bioenergy 2024 & 2032
- Figure 117: Asia Pacific US Clean Energy Industry Revenue Share (%), by Bioenergy 2024 & 2032
- Figure 118: Asia Pacific US Clean Energy Industry Volume Share (%), by Bioenergy 2024 & 2032
- Figure 119: Asia Pacific US Clean Energy Industry Revenue (Million), by Other So 2024 & 2032
- Figure 120: Asia Pacific US Clean Energy Industry Volume (gigawatt), by Other So 2024 & 2032
- Figure 121: Asia Pacific US Clean Energy Industry Revenue Share (%), by Other So 2024 & 2032
- Figure 122: Asia Pacific US Clean Energy Industry Volume Share (%), by Other So 2024 & 2032
- Figure 123: Asia Pacific US Clean Energy Industry Revenue (Million), by Country 2024 & 2032
- Figure 124: Asia Pacific US Clean Energy Industry Volume (gigawatt), by Country 2024 & 2032
- Figure 125: Asia Pacific US Clean Energy Industry Revenue Share (%), by Country 2024 & 2032
- Figure 126: Asia Pacific US Clean Energy Industry Volume Share (%), by Country 2024 & 2032
List of Tables
- Table 1: Global US Clean Energy Industry Revenue Million Forecast, by Region 2019 & 2032
- Table 2: Global US Clean Energy Industry Volume gigawatt Forecast, by Region 2019 & 2032
- Table 3: Global US Clean Energy Industry Revenue Million Forecast, by Wind 2019 & 2032
- Table 4: Global US Clean Energy Industry Volume gigawatt Forecast, by Wind 2019 & 2032
- Table 5: Global US Clean Energy Industry Revenue Million Forecast, by Solar 2019 & 2032
- Table 6: Global US Clean Energy Industry Volume gigawatt Forecast, by Solar 2019 & 2032
- Table 7: Global US Clean Energy Industry Revenue Million Forecast, by Hydropower 2019 & 2032
- Table 8: Global US Clean Energy Industry Volume gigawatt Forecast, by Hydropower 2019 & 2032
- Table 9: Global US Clean Energy Industry Revenue Million Forecast, by Bioenergy 2019 & 2032
- Table 10: Global US Clean Energy Industry Volume gigawatt Forecast, by Bioenergy 2019 & 2032
- Table 11: Global US Clean Energy Industry Revenue Million Forecast, by Other So 2019 & 2032
- Table 12: Global US Clean Energy Industry Volume gigawatt Forecast, by Other So 2019 & 2032
- Table 13: Global US Clean Energy Industry Revenue Million Forecast, by Region 2019 & 2032
- Table 14: Global US Clean Energy Industry Volume gigawatt Forecast, by Region 2019 & 2032
- Table 15: Global US Clean Energy Industry Revenue Million Forecast, by Country 2019 & 2032
- Table 16: Global US Clean Energy Industry Volume gigawatt Forecast, by Country 2019 & 2032
- Table 17: Northeast US Clean Energy Industry Revenue (Million) Forecast, by Application 2019 & 2032
- Table 18: Northeast US Clean Energy Industry Volume (gigawatt) Forecast, by Application 2019 & 2032
- Table 19: Southeast US Clean Energy Industry Revenue (Million) Forecast, by Application 2019 & 2032
- Table 20: Southeast US Clean Energy Industry Volume (gigawatt) Forecast, by Application 2019 & 2032
- Table 21: Midwest US Clean Energy Industry Revenue (Million) Forecast, by Application 2019 & 2032
- Table 22: Midwest US Clean Energy Industry Volume (gigawatt) Forecast, by Application 2019 & 2032
- Table 23: Southwest US Clean Energy Industry Revenue (Million) Forecast, by Application 2019 & 2032
- Table 24: Southwest US Clean Energy Industry Volume (gigawatt) Forecast, by Application 2019 & 2032
- Table 25: West US Clean Energy Industry Revenue (Million) Forecast, by Application 2019 & 2032
- Table 26: West US Clean Energy Industry Volume (gigawatt) Forecast, by Application 2019 & 2032
- Table 27: Global US Clean Energy Industry Revenue Million Forecast, by Wind 2019 & 2032
- Table 28: Global US Clean Energy Industry Volume gigawatt Forecast, by Wind 2019 & 2032
- Table 29: Global US Clean Energy Industry Revenue Million Forecast, by Solar 2019 & 2032
- Table 30: Global US Clean Energy Industry Volume gigawatt Forecast, by Solar 2019 & 2032
- Table 31: Global US Clean Energy Industry Revenue Million Forecast, by Hydropower 2019 & 2032
- Table 32: Global US Clean Energy Industry Volume gigawatt Forecast, by Hydropower 2019 & 2032
- Table 33: Global US Clean Energy Industry Revenue Million Forecast, by Bioenergy 2019 & 2032
- Table 34: Global US Clean Energy Industry Volume gigawatt Forecast, by Bioenergy 2019 & 2032
- Table 35: Global US Clean Energy Industry Revenue Million Forecast, by Other So 2019 & 2032
- Table 36: Global US Clean Energy Industry Volume gigawatt Forecast, by Other So 2019 & 2032
- Table 37: Global US Clean Energy Industry Revenue Million Forecast, by Country 2019 & 2032
- Table 38: Global US Clean Energy Industry Volume gigawatt Forecast, by Country 2019 & 2032
- Table 39: United States US Clean Energy Industry Revenue (Million) Forecast, by Application 2019 & 2032
- Table 40: United States US Clean Energy Industry Volume (gigawatt) Forecast, by Application 2019 & 2032
- Table 41: Canada US Clean Energy Industry Revenue (Million) Forecast, by Application 2019 & 2032
- Table 42: Canada US Clean Energy Industry Volume (gigawatt) Forecast, by Application 2019 & 2032
- Table 43: Mexico US Clean Energy Industry Revenue (Million) Forecast, by Application 2019 & 2032
- Table 44: Mexico US Clean Energy Industry Volume (gigawatt) Forecast, by Application 2019 & 2032
- Table 45: Global US Clean Energy Industry Revenue Million Forecast, by Wind 2019 & 2032
- Table 46: Global US Clean Energy Industry Volume gigawatt Forecast, by Wind 2019 & 2032
- Table 47: Global US Clean Energy Industry Revenue Million Forecast, by Solar 2019 & 2032
- Table 48: Global US Clean Energy Industry Volume gigawatt Forecast, by Solar 2019 & 2032
- Table 49: Global US Clean Energy Industry Revenue Million Forecast, by Hydropower 2019 & 2032
- Table 50: Global US Clean Energy Industry Volume gigawatt Forecast, by Hydropower 2019 & 2032
- Table 51: Global US Clean Energy Industry Revenue Million Forecast, by Bioenergy 2019 & 2032
- Table 52: Global US Clean Energy Industry Volume gigawatt Forecast, by Bioenergy 2019 & 2032
- Table 53: Global US Clean Energy Industry Revenue Million Forecast, by Other So 2019 & 2032
- Table 54: Global US Clean Energy Industry Volume gigawatt Forecast, by Other So 2019 & 2032
- Table 55: Global US Clean Energy Industry Revenue Million Forecast, by Country 2019 & 2032
- Table 56: Global US Clean Energy Industry Volume gigawatt Forecast, by Country 2019 & 2032
- Table 57: Brazil US Clean Energy Industry Revenue (Million) Forecast, by Application 2019 & 2032
- Table 58: Brazil US Clean Energy Industry Volume (gigawatt) Forecast, by Application 2019 & 2032
- Table 59: Argentina US Clean Energy Industry Revenue (Million) Forecast, by Application 2019 & 2032
- Table 60: Argentina US Clean Energy Industry Volume (gigawatt) Forecast, by Application 2019 & 2032
- Table 61: Rest of South America US Clean Energy Industry Revenue (Million) Forecast, by Application 2019 & 2032
- Table 62: Rest of South America US Clean Energy Industry Volume (gigawatt) Forecast, by Application 2019 & 2032
- Table 63: Global US Clean Energy Industry Revenue Million Forecast, by Wind 2019 & 2032
- Table 64: Global US Clean Energy Industry Volume gigawatt Forecast, by Wind 2019 & 2032
- Table 65: Global US Clean Energy Industry Revenue Million Forecast, by Solar 2019 & 2032
- Table 66: Global US Clean Energy Industry Volume gigawatt Forecast, by Solar 2019 & 2032
- Table 67: Global US Clean Energy Industry Revenue Million Forecast, by Hydropower 2019 & 2032
- Table 68: Global US Clean Energy Industry Volume gigawatt Forecast, by Hydropower 2019 & 2032
- Table 69: Global US Clean Energy Industry Revenue Million Forecast, by Bioenergy 2019 & 2032
- Table 70: Global US Clean Energy Industry Volume gigawatt Forecast, by Bioenergy 2019 & 2032
- Table 71: Global US Clean Energy Industry Revenue Million Forecast, by Other So 2019 & 2032
- Table 72: Global US Clean Energy Industry Volume gigawatt Forecast, by Other So 2019 & 2032
- Table 73: Global US Clean Energy Industry Revenue Million Forecast, by Country 2019 & 2032
- Table 74: Global US Clean Energy Industry Volume gigawatt Forecast, by Country 2019 & 2032
- Table 75: United Kingdom US Clean Energy Industry Revenue (Million) Forecast, by Application 2019 & 2032
- Table 76: United Kingdom US Clean Energy Industry Volume (gigawatt) Forecast, by Application 2019 & 2032
- Table 77: Germany US Clean Energy Industry Revenue (Million) Forecast, by Application 2019 & 2032
- Table 78: Germany US Clean Energy Industry Volume (gigawatt) Forecast, by Application 2019 & 2032
- Table 79: France US Clean Energy Industry Revenue (Million) Forecast, by Application 2019 & 2032
- Table 80: France US Clean Energy Industry Volume (gigawatt) Forecast, by Application 2019 & 2032
- Table 81: Italy US Clean Energy Industry Revenue (Million) Forecast, by Application 2019 & 2032
- Table 82: Italy US Clean Energy Industry Volume (gigawatt) Forecast, by Application 2019 & 2032
- Table 83: Spain US Clean Energy Industry Revenue (Million) Forecast, by Application 2019 & 2032
- Table 84: Spain US Clean Energy Industry Volume (gigawatt) Forecast, by Application 2019 & 2032
- Table 85: Russia US Clean Energy Industry Revenue (Million) Forecast, by Application 2019 & 2032
- Table 86: Russia US Clean Energy Industry Volume (gigawatt) Forecast, by Application 2019 & 2032
- Table 87: Benelux US Clean Energy Industry Revenue (Million) Forecast, by Application 2019 & 2032
- Table 88: Benelux US Clean Energy Industry Volume (gigawatt) Forecast, by Application 2019 & 2032
- Table 89: Nordics US Clean Energy Industry Revenue (Million) Forecast, by Application 2019 & 2032
- Table 90: Nordics US Clean Energy Industry Volume (gigawatt) Forecast, by Application 2019 & 2032
- Table 91: Rest of Europe US Clean Energy Industry Revenue (Million) Forecast, by Application 2019 & 2032
- Table 92: Rest of Europe US Clean Energy Industry Volume (gigawatt) Forecast, by Application 2019 & 2032
- Table 93: Global US Clean Energy Industry Revenue Million Forecast, by Wind 2019 & 2032
- Table 94: Global US Clean Energy Industry Volume gigawatt Forecast, by Wind 2019 & 2032
- Table 95: Global US Clean Energy Industry Revenue Million Forecast, by Solar 2019 & 2032
- Table 96: Global US Clean Energy Industry Volume gigawatt Forecast, by Solar 2019 & 2032
- Table 97: Global US Clean Energy Industry Revenue Million Forecast, by Hydropower 2019 & 2032
- Table 98: Global US Clean Energy Industry Volume gigawatt Forecast, by Hydropower 2019 & 2032
- Table 99: Global US Clean Energy Industry Revenue Million Forecast, by Bioenergy 2019 & 2032
- Table 100: Global US Clean Energy Industry Volume gigawatt Forecast, by Bioenergy 2019 & 2032
- Table 101: Global US Clean Energy Industry Revenue Million Forecast, by Other So 2019 & 2032
- Table 102: Global US Clean Energy Industry Volume gigawatt Forecast, by Other So 2019 & 2032
- Table 103: Global US Clean Energy Industry Revenue Million Forecast, by Country 2019 & 2032
- Table 104: Global US Clean Energy Industry Volume gigawatt Forecast, by Country 2019 & 2032
- Table 105: Turkey US Clean Energy Industry Revenue (Million) Forecast, by Application 2019 & 2032
- Table 106: Turkey US Clean Energy Industry Volume (gigawatt) Forecast, by Application 2019 & 2032
- Table 107: Israel US Clean Energy Industry Revenue (Million) Forecast, by Application 2019 & 2032
- Table 108: Israel US Clean Energy Industry Volume (gigawatt) Forecast, by Application 2019 & 2032
- Table 109: GCC US Clean Energy Industry Revenue (Million) Forecast, by Application 2019 & 2032
- Table 110: GCC US Clean Energy Industry Volume (gigawatt) Forecast, by Application 2019 & 2032
- Table 111: North Africa US Clean Energy Industry Revenue (Million) Forecast, by Application 2019 & 2032
- Table 112: North Africa US Clean Energy Industry Volume (gigawatt) Forecast, by Application 2019 & 2032
- Table 113: South Africa US Clean Energy Industry Revenue (Million) Forecast, by Application 2019 & 2032
- Table 114: South Africa US Clean Energy Industry Volume (gigawatt) Forecast, by Application 2019 & 2032
- Table 115: Rest of Middle East & Africa US Clean Energy Industry Revenue (Million) Forecast, by Application 2019 & 2032
- Table 116: Rest of Middle East & Africa US Clean Energy Industry Volume (gigawatt) Forecast, by Application 2019 & 2032
- Table 117: Global US Clean Energy Industry Revenue Million Forecast, by Wind 2019 & 2032
- Table 118: Global US Clean Energy Industry Volume gigawatt Forecast, by Wind 2019 & 2032
- Table 119: Global US Clean Energy Industry Revenue Million Forecast, by Solar 2019 & 2032
- Table 120: Global US Clean Energy Industry Volume gigawatt Forecast, by Solar 2019 & 2032
- Table 121: Global US Clean Energy Industry Revenue Million Forecast, by Hydropower 2019 & 2032
- Table 122: Global US Clean Energy Industry Volume gigawatt Forecast, by Hydropower 2019 & 2032
- Table 123: Global US Clean Energy Industry Revenue Million Forecast, by Bioenergy 2019 & 2032
- Table 124: Global US Clean Energy Industry Volume gigawatt Forecast, by Bioenergy 2019 & 2032
- Table 125: Global US Clean Energy Industry Revenue Million Forecast, by Other So 2019 & 2032
- Table 126: Global US Clean Energy Industry Volume gigawatt Forecast, by Other So 2019 & 2032
- Table 127: Global US Clean Energy Industry Revenue Million Forecast, by Country 2019 & 2032
- Table 128: Global US Clean Energy Industry Volume gigawatt Forecast, by Country 2019 & 2032
- Table 129: China US Clean Energy Industry Revenue (Million) Forecast, by Application 2019 & 2032
- Table 130: China US Clean Energy Industry Volume (gigawatt) Forecast, by Application 2019 & 2032
- Table 131: India US Clean Energy Industry Revenue (Million) Forecast, by Application 2019 & 2032
- Table 132: India US Clean Energy Industry Volume (gigawatt) Forecast, by Application 2019 & 2032
- Table 133: Japan US Clean Energy Industry Revenue (Million) Forecast, by Application 2019 & 2032
- Table 134: Japan US Clean Energy Industry Volume (gigawatt) Forecast, by Application 2019 & 2032
- Table 135: South Korea US Clean Energy Industry Revenue (Million) Forecast, by Application 2019 & 2032
- Table 136: South Korea US Clean Energy Industry Volume (gigawatt) Forecast, by Application 2019 & 2032
- Table 137: ASEAN US Clean Energy Industry Revenue (Million) Forecast, by Application 2019 & 2032
- Table 138: ASEAN US Clean Energy Industry Volume (gigawatt) Forecast, by Application 2019 & 2032
- Table 139: Oceania US Clean Energy Industry Revenue (Million) Forecast, by Application 2019 & 2032
- Table 140: Oceania US Clean Energy Industry Volume (gigawatt) Forecast, by Application 2019 & 2032
- Table 141: Rest of Asia Pacific US Clean Energy Industry Revenue (Million) Forecast, by Application 2019 & 2032
- Table 142: Rest of Asia Pacific US Clean Energy Industry Volume (gigawatt) Forecast, by Application 2019 & 2032
Frequently Asked Questions
1. What is the projected Compound Annual Growth Rate (CAGR) of the US Clean Energy Industry?
The projected CAGR is approximately 10.01%.
2. Which companies are prominent players in the US Clean Energy Industry?
Key companies in the market include First Solar Inc, NextEra Energy Inc, Siemens Gamesa Renewable Energy SA, Canadian Solar Inc, Trina Solar Co Ltd*List Not Exhaustive, Sunrun Inc, Vestas Wind Systems AS, General Electric Company, Mitsubishi Heavy Industries Ltd.
3. What are the main segments of the US Clean Energy Industry?
The market segments include Wind, Solar, Hydropower, Bioenergy, Other So.
4. Can you provide details about the market size?
The market size is estimated to be USD XX Million as of 2022.
5. What are some drivers contributing to market growth?
Supportive Government Policies and Incentives4.; Environmental Concerns.
6. What are the notable trends driving market growth?
Solar Energy to Witness Significant Growth.
7. Are there any restraints impacting market growth?
Fossil Fuel Subsidies.
8. Can you provide examples of recent developments in the market?
March 2023: The US Energy Information Administration announced that the total electricity generated from renewables surpassed coal in the United States for the first time in 2022. Renewable energy also exceeded nuclear generation in 2022.
9. What pricing options are available for accessing the report?
Pricing options include single-user, multi-user, and enterprise licenses priced at USD 3800, USD 4500, and USD 5800 respectively.
10. Is the market size provided in terms of value or volume?
The market size is provided in terms of value, measured in Million and volume, measured in gigawatt.
11. Are there any specific market keywords associated with the report?
Yes, the market keyword associated with the report is "US Clean Energy Industry," which aids in identifying and referencing the specific market segment covered.
12. How do I determine which pricing option suits my needs best?
The pricing options vary based on user requirements and access needs. Individual users may opt for single-user licenses, while businesses requiring broader access may choose multi-user or enterprise licenses for cost-effective access to the report.
13. Are there any additional resources or data provided in the US Clean Energy Industry report?
While the report offers comprehensive insights, it's advisable to review the specific contents or supplementary materials provided to ascertain if additional resources or data are available.
14. How can I stay updated on further developments or reports in the US Clean Energy Industry?
To stay informed about further developments, trends, and reports in the US Clean Energy Industry, consider subscribing to industry newsletters, following relevant companies and organizations, or regularly checking reputable industry news sources and publications.
Methodology
Step 1 - Identification of Relevant Samples Size from Population Database


Step 2 - Approaches for Defining Global Market Size (Value, Volume* & Price*)

Note*: In applicable scenarios
Step 3 - Data Sources
Primary Research
- Web Analytics
- Survey Reports
- Research Institute
- Latest Research Reports
- Opinion Leaders
Secondary Research
- Annual Reports
- White Paper
- Latest Press Release
- Industry Association
- Paid Database
- Investor Presentations

Step 4 - Data Triangulation
Involves using different sources of information in order to increase the validity of a study
These sources are likely to be stakeholders in a program - participants, other researchers, program staff, other community members, and so on.
Then we put all data in single framework & apply various statistical tools to find out the dynamic on the market.
During the analysis stage, feedback from the stakeholder groups would be compared to determine areas of agreement as well as areas of divergence


