
Key Insights
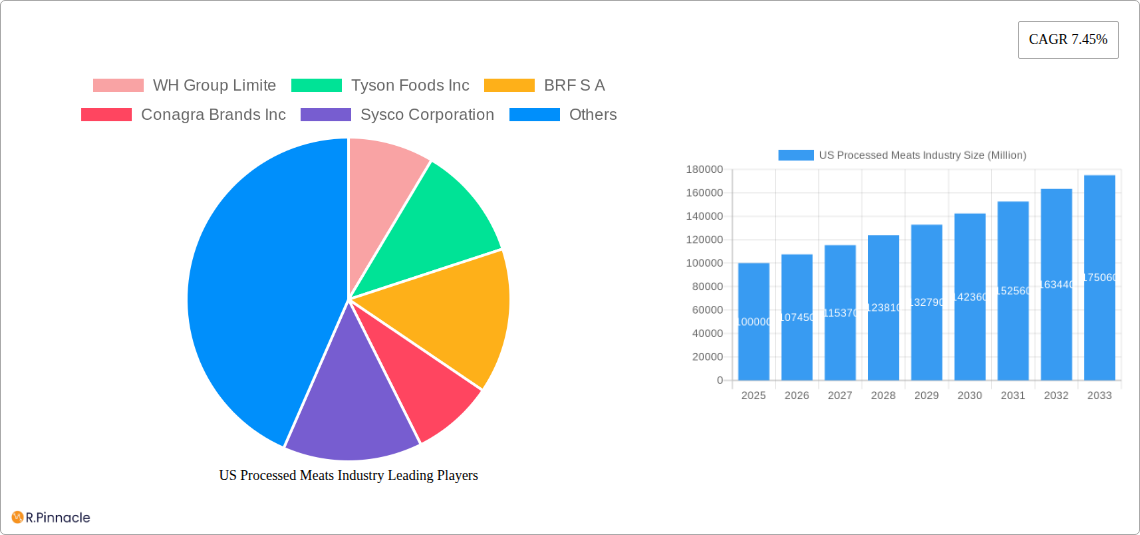
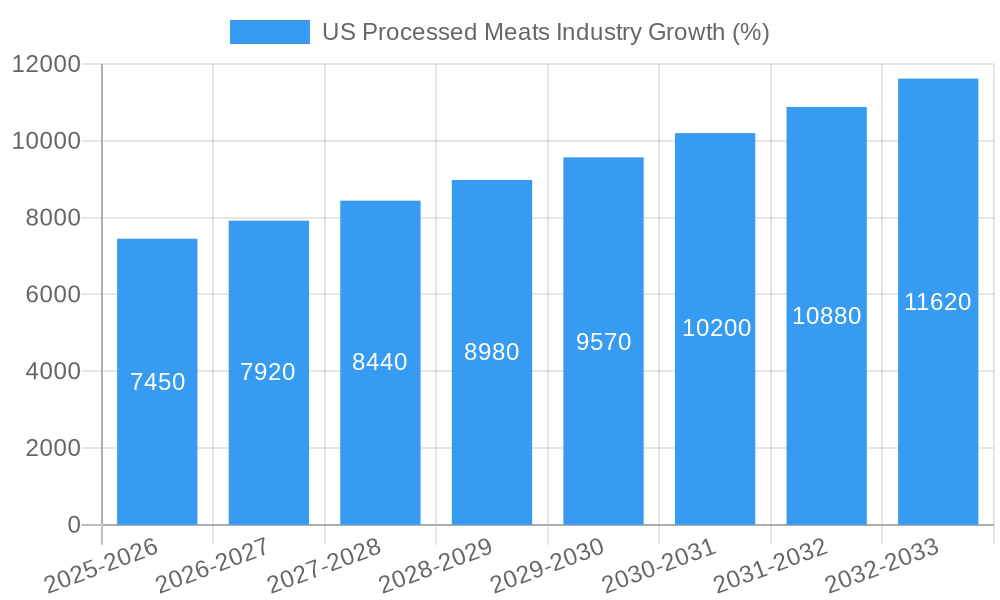
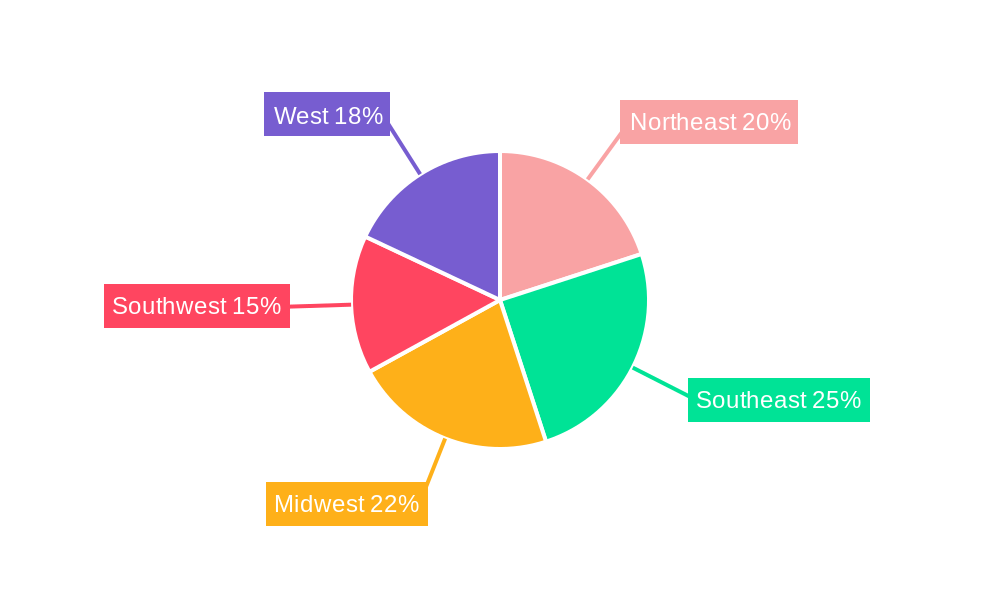
The US processed meats industry, valued at approximately $100 billion in 2025, is projected to experience robust growth, with a compound annual growth rate (CAGR) of 7.45% from 2025 to 2033. This expansion is fueled by several key drivers. Increasing consumer demand for convenient and ready-to-eat meals is a significant factor, particularly among busy professionals and households with limited cooking time. Innovation in product offerings, including healthier options like leaner meats and reduced sodium content, is also contributing to market growth. Furthermore, the rise of foodservice channels, such as restaurants and food trucks incorporating processed meats in their menus, fuels demand. However, the industry faces challenges, including concerns over health implications associated with high consumption of processed meats, fluctuating raw material prices, and increasing regulatory scrutiny regarding food safety and labeling. The industry is segmented by meat type (beef, mutton, pork, poultry, other) and distribution channel (off-trade, on-trade), with beef and poultry currently dominating market share. The geographical distribution shows varied consumption patterns across the United States, with regions like the Midwest and Southeast showing higher demand compared to others. Major players like JBS SA, Tyson Foods, and Hormel Foods dominate the market, utilizing advanced processing techniques and strategic branding to maintain their competitive edge. The forecast period will see continued growth, although the pace may be influenced by macroeconomic factors like inflation and changes in consumer preferences.
The competitive landscape is marked by both established industry giants and emerging players. Large companies leverage their established distribution networks and strong brand recognition to maintain their market share, while smaller companies are focusing on niche markets, such as organic or specialty processed meats, to carve out a space for themselves. Successful navigation of this market will require companies to adapt to shifting consumer preferences, embrace sustainable practices, and proactively address public health concerns. Future growth will likely depend on the successful introduction of innovative, healthier products, improved supply chain efficiency, and a targeted approach to marketing and consumer engagement across various regional markets.
US Processed Meats Industry Report: 2019-2033
This comprehensive report provides a detailed analysis of the US processed meats industry, offering invaluable insights for industry professionals, investors, and strategic decision-makers. Covering the period 2019-2033, with a focus on 2025, this report analyzes market dynamics, leading players, and future growth opportunities within this dynamic sector.
US Processed Meats Industry Market Structure & Innovation Trends
This section analyzes the competitive landscape of the US processed meats industry, focusing on market concentration, innovation drivers, regulatory frameworks, and M&A activity. The report examines the market share held by key players such as WH Group Limited, Tyson Foods Inc, JBS SA, and Cargill Inc, providing a granular understanding of the industry's structure. We delve into the impact of mergers and acquisitions, evaluating deal values and their influence on market consolidation. Furthermore, we assess the role of innovation, examining the impact of technological advancements on product development and manufacturing processes. The report also considers the regulatory environment, including food safety regulations and labeling requirements, and their impact on market operations. Finally, we explore the influence of substitute products and evolving consumer preferences on market dynamics. The analysis incorporates metrics like market share distribution, M&A deal values (estimated at xx Million USD in the forecast period), and identifies key trends shaping the competitive landscape.
- Market share analysis of top 10 players.
- Detailed assessment of M&A activity and its impact on market concentration.
- Analysis of innovation drivers, including technological advancements and consumer demand.
- Evaluation of regulatory frameworks and their influence on industry practices.
US Processed Meats Industry Market Dynamics & Trends
This section provides a comprehensive analysis of the market dynamics driving growth within the US processed meats sector. We explore market size, growth rates (CAGR), and market penetration of various processed meat types. We examine factors influencing market growth, including shifts in consumer preferences (e.g., demand for healthier options, convenience foods), technological disruptions, and competitive dynamics. The report also analyzes the impact of macroeconomic factors, such as economic growth and disposable income, on market demand. We further detail the role of supply chain management and logistics in shaping market outcomes. Finally, we discuss the impact of evolving consumer preferences for sustainable and ethically sourced products. The analysis includes projected CAGRs of xx% for the forecast period (2025-2033), providing a clear picture of future growth trajectories.
Dominant Regions & Segments in US Processed Meats Industry
This section identifies the leading regions and segments within the US processed meats industry. We analyze market dominance across different segments, including beef, pork, poultry, mutton, and other meats, as well as distribution channels (off-trade and on-trade). The analysis highlights key drivers of dominance within each segment, considering factors such as economic policies, infrastructure development, and consumer preferences.
- Leading Segment: Detailed analysis of the dominant processed meat type (e.g., beef) and its market share.
- Key Drivers: Bullet points outlining the factors driving dominance in the leading segment.
- Regional Analysis: Assessment of regional variations in market performance and consumption patterns.
- Distribution Channel Analysis: Evaluation of off-trade versus on-trade market shares and their growth projections.
US Processed Meats Industry Product Innovations
This section focuses on recent product innovations in the US processed meats industry. We highlight new product launches, technological advancements that have led to improved product quality or efficiency, and the competitive advantages these innovations provide. We also explore the market fit for these new products, considering their alignment with consumer preferences and market trends. This section underscores the role of technological trends, such as automation and improved processing techniques, in shaping product development.
Report Scope & Segmentation Analysis
This report segments the US processed meats market by type (beef, mutton, pork, poultry, other meat) and distribution channel (off-trade, on-trade). Each segment’s market size, growth projections, and competitive dynamics are analyzed. We provide detailed insights into the growth potential of each segment and highlight key opportunities for players.
- By Type: Detailed market size and growth projections for each meat type (Beef, Mutton, Pork, Poultry, Other Meat), including analysis of competitive landscapes within each segment. Estimated market size in 2025 for beef is xx Million USD.
- By Distribution Channel: Analysis of market size and growth projections for off-trade and on-trade channels, examining the distinct competitive landscapes of each. Estimated market size in 2025 for off-trade is xx Million USD and xx Million USD for on-trade.
Key Drivers of US Processed Meats Industry Growth
The growth of the US processed meats industry is driven by several key factors. Increasing consumer demand for convenient and ready-to-eat food products fuels the industry's expansion. Technological advancements in meat processing and packaging have enhanced efficiency and product quality, also contributing to growth. Favorable economic conditions and rising disposable incomes are further propelling market expansion. Moreover, government support and investment in the agricultural sector have a positive impact on industry performance. Lastly, the innovation of new products and flavors cater to diverse consumer preferences.
Challenges in the US Processed Meats Industry Sector
The US processed meats industry faces several challenges. Stricter regulations regarding food safety and labeling add compliance costs and complexities. Fluctuations in raw material prices and supply chain disruptions can impact profitability. Intense competition from both domestic and international players exerts downward pressure on prices. Growing consumer concerns about health and ethical sourcing influence demand patterns and necessitate product adjustments. These challenges impact market stability and require strategic adjustments by industry participants.
Emerging Opportunities in US Processed Meats Industry
Emerging opportunities in the US processed meats industry stem from several factors. Growth in demand for convenient and ready-to-eat meal options creates new product development opportunities. Expansion into niche markets, such as organic and natural meats, presents considerable potential. Technological advancements, including automation and precision processing, enhance efficiency and reduce costs. Finally, the adoption of sustainable and ethical sourcing practices strengthens brand image and consumer appeal. These factors create significant opportunities for businesses adapting to evolving consumer needs.
Leading Players in the US Processed Meats Industry Market
- WH Group Limited
- Tyson Foods Inc
- BRF S A
- Conagra Brands Inc
- Sysco Corporation
- The Kraft Heinz Company
- Hormel Foods Corporation
- Cargill Inc
- Marfrig Global Foods S A
- Maple Leaf Foods
- JBS SA
Key Developments in US Processed Meats Industry
- May 2023: Tyson Foods Claryville announced an USD 83 million expansion of its cocktail sausage manufacturing capacity, increasing production by 50%.
- April 2023: Launch of the HERDEZ™ Mexican Refrigerated Entrées line, featuring chicken and pork varieties.
- March 2023: Tyson® brand introduced chicken sandwiches and sliders, expanding its frozen snack offerings.
Future Outlook for US Processed Meats Industry Market
The future of the US processed meats industry appears promising, driven by continuous innovation, evolving consumer preferences, and strategic investments. Growth in health-conscious options, expansion into new product categories, and advancements in sustainable practices present significant opportunities. Further market consolidation through mergers and acquisitions is anticipated, along with increased technological adoption to improve efficiency and reduce environmental impact. The industry's ability to adapt to evolving consumer demands and regulatory requirements will be crucial for future success.
US Processed Meats Industry Segmentation
-
1. Type
- 1.1. Beef
- 1.2. Mutton
- 1.3. Pork
- 1.4. Poultry
- 1.5. Other Meat
-
2. Distribution Channel
-
2.1. Off-Trade
- 2.1.1. Convenience Stores
- 2.1.2. Online Channel
- 2.1.3. Supermarkets and Hypermarkets
- 2.1.4. Others
- 2.2. On-Trade
-
2.1. Off-Trade
US Processed Meats Industry Segmentation By Geography
-
1. North America
- 1.1. United States
- 1.2. Canada
- 1.3. Mexico
-
2. South America
- 2.1. Brazil
- 2.2. Argentina
- 2.3. Rest of South America
-
3. Europe
- 3.1. United Kingdom
- 3.2. Germany
- 3.3. France
- 3.4. Italy
- 3.5. Spain
- 3.6. Russia
- 3.7. Benelux
- 3.8. Nordics
- 3.9. Rest of Europe
-
4. Middle East & Africa
- 4.1. Turkey
- 4.2. Israel
- 4.3. GCC
- 4.4. North Africa
- 4.5. South Africa
- 4.6. Rest of Middle East & Africa
-
5. Asia Pacific
- 5.1. China
- 5.2. India
- 5.3. Japan
- 5.4. South Korea
- 5.5. ASEAN
- 5.6. Oceania
- 5.7. Rest of Asia Pacific
US Processed Meats Industry REPORT HIGHLIGHTS
| Aspects | Details |
|---|---|
| Study Period | 2019-2033 |
| Base Year | 2024 |
| Estimated Year | 2025 |
| Forecast Period | 2025-2033 |
| Historical Period | 2019-2024 |
| Growth Rate | CAGR of 7.45% from 2019-2033 |
| Segmentation |
|
Table of Contents
- 1. Introduction
- 1.1. Research Scope
- 1.2. Market Segmentation
- 1.3. Research Methodology
- 1.4. Definitions and Assumptions
- 2. Executive Summary
- 2.1. Introduction
- 3. Market Dynamics
- 3.1. Introduction
- 3.2. Market Drivers
- 3.2.1. Increasing Demand for Functional and Fortified Food; Multi-functionality and Wide Application of Riboflavin
- 3.3. Market Restrains
- 3.3.1. Low Stability of Riboflavin on Exposure to Light and Heat
- 3.4. Market Trends
- 3.4.1. OTHER KEY INDUSTRY TRENDS COVERED IN THE REPORT
- 4. Market Factor Analysis
- 4.1. Porters Five Forces
- 4.2. Supply/Value Chain
- 4.3. PESTEL analysis
- 4.4. Market Entropy
- 4.5. Patent/Trademark Analysis
- 5. Global US Processed Meats Industry Analysis, Insights and Forecast, 2019-2031
- 5.1. Market Analysis, Insights and Forecast - by Type
- 5.1.1. Beef
- 5.1.2. Mutton
- 5.1.3. Pork
- 5.1.4. Poultry
- 5.1.5. Other Meat
- 5.2. Market Analysis, Insights and Forecast - by Distribution Channel
- 5.2.1. Off-Trade
- 5.2.1.1. Convenience Stores
- 5.2.1.2. Online Channel
- 5.2.1.3. Supermarkets and Hypermarkets
- 5.2.1.4. Others
- 5.2.2. On-Trade
- 5.2.1. Off-Trade
- 5.3. Market Analysis, Insights and Forecast - by Region
- 5.3.1. North America
- 5.3.2. South America
- 5.3.3. Europe
- 5.3.4. Middle East & Africa
- 5.3.5. Asia Pacific
- 5.1. Market Analysis, Insights and Forecast - by Type
- 6. North America US Processed Meats Industry Analysis, Insights and Forecast, 2019-2031
- 6.1. Market Analysis, Insights and Forecast - by Type
- 6.1.1. Beef
- 6.1.2. Mutton
- 6.1.3. Pork
- 6.1.4. Poultry
- 6.1.5. Other Meat
- 6.2. Market Analysis, Insights and Forecast - by Distribution Channel
- 6.2.1. Off-Trade
- 6.2.1.1. Convenience Stores
- 6.2.1.2. Online Channel
- 6.2.1.3. Supermarkets and Hypermarkets
- 6.2.1.4. Others
- 6.2.2. On-Trade
- 6.2.1. Off-Trade
- 6.1. Market Analysis, Insights and Forecast - by Type
- 7. South America US Processed Meats Industry Analysis, Insights and Forecast, 2019-2031
- 7.1. Market Analysis, Insights and Forecast - by Type
- 7.1.1. Beef
- 7.1.2. Mutton
- 7.1.3. Pork
- 7.1.4. Poultry
- 7.1.5. Other Meat
- 7.2. Market Analysis, Insights and Forecast - by Distribution Channel
- 7.2.1. Off-Trade
- 7.2.1.1. Convenience Stores
- 7.2.1.2. Online Channel
- 7.2.1.3. Supermarkets and Hypermarkets
- 7.2.1.4. Others
- 7.2.2. On-Trade
- 7.2.1. Off-Trade
- 7.1. Market Analysis, Insights and Forecast - by Type
- 8. Europe US Processed Meats Industry Analysis, Insights and Forecast, 2019-2031
- 8.1. Market Analysis, Insights and Forecast - by Type
- 8.1.1. Beef
- 8.1.2. Mutton
- 8.1.3. Pork
- 8.1.4. Poultry
- 8.1.5. Other Meat
- 8.2. Market Analysis, Insights and Forecast - by Distribution Channel
- 8.2.1. Off-Trade
- 8.2.1.1. Convenience Stores
- 8.2.1.2. Online Channel
- 8.2.1.3. Supermarkets and Hypermarkets
- 8.2.1.4. Others
- 8.2.2. On-Trade
- 8.2.1. Off-Trade
- 8.1. Market Analysis, Insights and Forecast - by Type
- 9. Middle East & Africa US Processed Meats Industry Analysis, Insights and Forecast, 2019-2031
- 9.1. Market Analysis, Insights and Forecast - by Type
- 9.1.1. Beef
- 9.1.2. Mutton
- 9.1.3. Pork
- 9.1.4. Poultry
- 9.1.5. Other Meat
- 9.2. Market Analysis, Insights and Forecast - by Distribution Channel
- 9.2.1. Off-Trade
- 9.2.1.1. Convenience Stores
- 9.2.1.2. Online Channel
- 9.2.1.3. Supermarkets and Hypermarkets
- 9.2.1.4. Others
- 9.2.2. On-Trade
- 9.2.1. Off-Trade
- 9.1. Market Analysis, Insights and Forecast - by Type
- 10. Asia Pacific US Processed Meats Industry Analysis, Insights and Forecast, 2019-2031
- 10.1. Market Analysis, Insights and Forecast - by Type
- 10.1.1. Beef
- 10.1.2. Mutton
- 10.1.3. Pork
- 10.1.4. Poultry
- 10.1.5. Other Meat
- 10.2. Market Analysis, Insights and Forecast - by Distribution Channel
- 10.2.1. Off-Trade
- 10.2.1.1. Convenience Stores
- 10.2.1.2. Online Channel
- 10.2.1.3. Supermarkets and Hypermarkets
- 10.2.1.4. Others
- 10.2.2. On-Trade
- 10.2.1. Off-Trade
- 10.1. Market Analysis, Insights and Forecast - by Type
- 11. Northeast US Processed Meats Industry Analysis, Insights and Forecast, 2019-2031
- 12. Southeast US Processed Meats Industry Analysis, Insights and Forecast, 2019-2031
- 13. Midwest US Processed Meats Industry Analysis, Insights and Forecast, 2019-2031
- 14. Southwest US Processed Meats Industry Analysis, Insights and Forecast, 2019-2031
- 15. West US Processed Meats Industry Analysis, Insights and Forecast, 2019-2031
- 16. Competitive Analysis
- 16.1. Global Market Share Analysis 2024
- 16.2. Company Profiles
- 16.2.1 WH Group Limite
- 16.2.1.1. Overview
- 16.2.1.2. Products
- 16.2.1.3. SWOT Analysis
- 16.2.1.4. Recent Developments
- 16.2.1.5. Financials (Based on Availability)
- 16.2.2 Tyson Foods Inc
- 16.2.2.1. Overview
- 16.2.2.2. Products
- 16.2.2.3. SWOT Analysis
- 16.2.2.4. Recent Developments
- 16.2.2.5. Financials (Based on Availability)
- 16.2.3 BRF S A
- 16.2.3.1. Overview
- 16.2.3.2. Products
- 16.2.3.3. SWOT Analysis
- 16.2.3.4. Recent Developments
- 16.2.3.5. Financials (Based on Availability)
- 16.2.4 Conagra Brands Inc
- 16.2.4.1. Overview
- 16.2.4.2. Products
- 16.2.4.3. SWOT Analysis
- 16.2.4.4. Recent Developments
- 16.2.4.5. Financials (Based on Availability)
- 16.2.5 Sysco Corporation
- 16.2.5.1. Overview
- 16.2.5.2. Products
- 16.2.5.3. SWOT Analysis
- 16.2.5.4. Recent Developments
- 16.2.5.5. Financials (Based on Availability)
- 16.2.6 The Kraft Heinz Company
- 16.2.6.1. Overview
- 16.2.6.2. Products
- 16.2.6.3. SWOT Analysis
- 16.2.6.4. Recent Developments
- 16.2.6.5. Financials (Based on Availability)
- 16.2.7 Hormel Foods Corporation
- 16.2.7.1. Overview
- 16.2.7.2. Products
- 16.2.7.3. SWOT Analysis
- 16.2.7.4. Recent Developments
- 16.2.7.5. Financials (Based on Availability)
- 16.2.8 Cargill Inc
- 16.2.8.1. Overview
- 16.2.8.2. Products
- 16.2.8.3. SWOT Analysis
- 16.2.8.4. Recent Developments
- 16.2.8.5. Financials (Based on Availability)
- 16.2.9 Marfrig Global Foods S A
- 16.2.9.1. Overview
- 16.2.9.2. Products
- 16.2.9.3. SWOT Analysis
- 16.2.9.4. Recent Developments
- 16.2.9.5. Financials (Based on Availability)
- 16.2.10 Maple Leaf Foods
- 16.2.10.1. Overview
- 16.2.10.2. Products
- 16.2.10.3. SWOT Analysis
- 16.2.10.4. Recent Developments
- 16.2.10.5. Financials (Based on Availability)
- 16.2.11 JBS SA
- 16.2.11.1. Overview
- 16.2.11.2. Products
- 16.2.11.3. SWOT Analysis
- 16.2.11.4. Recent Developments
- 16.2.11.5. Financials (Based on Availability)
- 16.2.1 WH Group Limite
List of Figures
- Figure 1: Global US Processed Meats Industry Revenue Breakdown (Million, %) by Region 2024 & 2032
- Figure 2: United states US Processed Meats Industry Revenue (Million), by Country 2024 & 2032
- Figure 3: United states US Processed Meats Industry Revenue Share (%), by Country 2024 & 2032
- Figure 4: North America US Processed Meats Industry Revenue (Million), by Type 2024 & 2032
- Figure 5: North America US Processed Meats Industry Revenue Share (%), by Type 2024 & 2032
- Figure 6: North America US Processed Meats Industry Revenue (Million), by Distribution Channel 2024 & 2032
- Figure 7: North America US Processed Meats Industry Revenue Share (%), by Distribution Channel 2024 & 2032
- Figure 8: North America US Processed Meats Industry Revenue (Million), by Country 2024 & 2032
- Figure 9: North America US Processed Meats Industry Revenue Share (%), by Country 2024 & 2032
- Figure 10: South America US Processed Meats Industry Revenue (Million), by Type 2024 & 2032
- Figure 11: South America US Processed Meats Industry Revenue Share (%), by Type 2024 & 2032
- Figure 12: South America US Processed Meats Industry Revenue (Million), by Distribution Channel 2024 & 2032
- Figure 13: South America US Processed Meats Industry Revenue Share (%), by Distribution Channel 2024 & 2032
- Figure 14: South America US Processed Meats Industry Revenue (Million), by Country 2024 & 2032
- Figure 15: South America US Processed Meats Industry Revenue Share (%), by Country 2024 & 2032
- Figure 16: Europe US Processed Meats Industry Revenue (Million), by Type 2024 & 2032
- Figure 17: Europe US Processed Meats Industry Revenue Share (%), by Type 2024 & 2032
- Figure 18: Europe US Processed Meats Industry Revenue (Million), by Distribution Channel 2024 & 2032
- Figure 19: Europe US Processed Meats Industry Revenue Share (%), by Distribution Channel 2024 & 2032
- Figure 20: Europe US Processed Meats Industry Revenue (Million), by Country 2024 & 2032
- Figure 21: Europe US Processed Meats Industry Revenue Share (%), by Country 2024 & 2032
- Figure 22: Middle East & Africa US Processed Meats Industry Revenue (Million), by Type 2024 & 2032
- Figure 23: Middle East & Africa US Processed Meats Industry Revenue Share (%), by Type 2024 & 2032
- Figure 24: Middle East & Africa US Processed Meats Industry Revenue (Million), by Distribution Channel 2024 & 2032
- Figure 25: Middle East & Africa US Processed Meats Industry Revenue Share (%), by Distribution Channel 2024 & 2032
- Figure 26: Middle East & Africa US Processed Meats Industry Revenue (Million), by Country 2024 & 2032
- Figure 27: Middle East & Africa US Processed Meats Industry Revenue Share (%), by Country 2024 & 2032
- Figure 28: Asia Pacific US Processed Meats Industry Revenue (Million), by Type 2024 & 2032
- Figure 29: Asia Pacific US Processed Meats Industry Revenue Share (%), by Type 2024 & 2032
- Figure 30: Asia Pacific US Processed Meats Industry Revenue (Million), by Distribution Channel 2024 & 2032
- Figure 31: Asia Pacific US Processed Meats Industry Revenue Share (%), by Distribution Channel 2024 & 2032
- Figure 32: Asia Pacific US Processed Meats Industry Revenue (Million), by Country 2024 & 2032
- Figure 33: Asia Pacific US Processed Meats Industry Revenue Share (%), by Country 2024 & 2032
List of Tables
- Table 1: Global US Processed Meats Industry Revenue Million Forecast, by Region 2019 & 2032
- Table 2: Global US Processed Meats Industry Revenue Million Forecast, by Type 2019 & 2032
- Table 3: Global US Processed Meats Industry Revenue Million Forecast, by Distribution Channel 2019 & 2032
- Table 4: Global US Processed Meats Industry Revenue Million Forecast, by Region 2019 & 2032
- Table 5: Global US Processed Meats Industry Revenue Million Forecast, by Country 2019 & 2032
- Table 6: Northeast US Processed Meats Industry Revenue (Million) Forecast, by Application 2019 & 2032
- Table 7: Southeast US Processed Meats Industry Revenue (Million) Forecast, by Application 2019 & 2032
- Table 8: Midwest US Processed Meats Industry Revenue (Million) Forecast, by Application 2019 & 2032
- Table 9: Southwest US Processed Meats Industry Revenue (Million) Forecast, by Application 2019 & 2032
- Table 10: West US Processed Meats Industry Revenue (Million) Forecast, by Application 2019 & 2032
- Table 11: Global US Processed Meats Industry Revenue Million Forecast, by Type 2019 & 2032
- Table 12: Global US Processed Meats Industry Revenue Million Forecast, by Distribution Channel 2019 & 2032
- Table 13: Global US Processed Meats Industry Revenue Million Forecast, by Country 2019 & 2032
- Table 14: United States US Processed Meats Industry Revenue (Million) Forecast, by Application 2019 & 2032
- Table 15: Canada US Processed Meats Industry Revenue (Million) Forecast, by Application 2019 & 2032
- Table 16: Mexico US Processed Meats Industry Revenue (Million) Forecast, by Application 2019 & 2032
- Table 17: Global US Processed Meats Industry Revenue Million Forecast, by Type 2019 & 2032
- Table 18: Global US Processed Meats Industry Revenue Million Forecast, by Distribution Channel 2019 & 2032
- Table 19: Global US Processed Meats Industry Revenue Million Forecast, by Country 2019 & 2032
- Table 20: Brazil US Processed Meats Industry Revenue (Million) Forecast, by Application 2019 & 2032
- Table 21: Argentina US Processed Meats Industry Revenue (Million) Forecast, by Application 2019 & 2032
- Table 22: Rest of South America US Processed Meats Industry Revenue (Million) Forecast, by Application 2019 & 2032
- Table 23: Global US Processed Meats Industry Revenue Million Forecast, by Type 2019 & 2032
- Table 24: Global US Processed Meats Industry Revenue Million Forecast, by Distribution Channel 2019 & 2032
- Table 25: Global US Processed Meats Industry Revenue Million Forecast, by Country 2019 & 2032
- Table 26: United Kingdom US Processed Meats Industry Revenue (Million) Forecast, by Application 2019 & 2032
- Table 27: Germany US Processed Meats Industry Revenue (Million) Forecast, by Application 2019 & 2032
- Table 28: France US Processed Meats Industry Revenue (Million) Forecast, by Application 2019 & 2032
- Table 29: Italy US Processed Meats Industry Revenue (Million) Forecast, by Application 2019 & 2032
- Table 30: Spain US Processed Meats Industry Revenue (Million) Forecast, by Application 2019 & 2032
- Table 31: Russia US Processed Meats Industry Revenue (Million) Forecast, by Application 2019 & 2032
- Table 32: Benelux US Processed Meats Industry Revenue (Million) Forecast, by Application 2019 & 2032
- Table 33: Nordics US Processed Meats Industry Revenue (Million) Forecast, by Application 2019 & 2032
- Table 34: Rest of Europe US Processed Meats Industry Revenue (Million) Forecast, by Application 2019 & 2032
- Table 35: Global US Processed Meats Industry Revenue Million Forecast, by Type 2019 & 2032
- Table 36: Global US Processed Meats Industry Revenue Million Forecast, by Distribution Channel 2019 & 2032
- Table 37: Global US Processed Meats Industry Revenue Million Forecast, by Country 2019 & 2032
- Table 38: Turkey US Processed Meats Industry Revenue (Million) Forecast, by Application 2019 & 2032
- Table 39: Israel US Processed Meats Industry Revenue (Million) Forecast, by Application 2019 & 2032
- Table 40: GCC US Processed Meats Industry Revenue (Million) Forecast, by Application 2019 & 2032
- Table 41: North Africa US Processed Meats Industry Revenue (Million) Forecast, by Application 2019 & 2032
- Table 42: South Africa US Processed Meats Industry Revenue (Million) Forecast, by Application 2019 & 2032
- Table 43: Rest of Middle East & Africa US Processed Meats Industry Revenue (Million) Forecast, by Application 2019 & 2032
- Table 44: Global US Processed Meats Industry Revenue Million Forecast, by Type 2019 & 2032
- Table 45: Global US Processed Meats Industry Revenue Million Forecast, by Distribution Channel 2019 & 2032
- Table 46: Global US Processed Meats Industry Revenue Million Forecast, by Country 2019 & 2032
- Table 47: China US Processed Meats Industry Revenue (Million) Forecast, by Application 2019 & 2032
- Table 48: India US Processed Meats Industry Revenue (Million) Forecast, by Application 2019 & 2032
- Table 49: Japan US Processed Meats Industry Revenue (Million) Forecast, by Application 2019 & 2032
- Table 50: South Korea US Processed Meats Industry Revenue (Million) Forecast, by Application 2019 & 2032
- Table 51: ASEAN US Processed Meats Industry Revenue (Million) Forecast, by Application 2019 & 2032
- Table 52: Oceania US Processed Meats Industry Revenue (Million) Forecast, by Application 2019 & 2032
- Table 53: Rest of Asia Pacific US Processed Meats Industry Revenue (Million) Forecast, by Application 2019 & 2032
Frequently Asked Questions
1. What is the projected Compound Annual Growth Rate (CAGR) of the US Processed Meats Industry?
The projected CAGR is approximately 7.45%.
2. Which companies are prominent players in the US Processed Meats Industry?
Key companies in the market include WH Group Limite, Tyson Foods Inc, BRF S A, Conagra Brands Inc, Sysco Corporation, The Kraft Heinz Company, Hormel Foods Corporation, Cargill Inc, Marfrig Global Foods S A, Maple Leaf Foods, JBS SA.
3. What are the main segments of the US Processed Meats Industry?
The market segments include Type, Distribution Channel.
4. Can you provide details about the market size?
The market size is estimated to be USD XX Million as of 2022.
5. What are some drivers contributing to market growth?
Increasing Demand for Functional and Fortified Food; Multi-functionality and Wide Application of Riboflavin.
6. What are the notable trends driving market growth?
OTHER KEY INDUSTRY TRENDS COVERED IN THE REPORT.
7. Are there any restraints impacting market growth?
Low Stability of Riboflavin on Exposure to Light and Heat.
8. Can you provide examples of recent developments in the market?
May 2023: Tyson Foods Claryville announced its newly expanded cocktail sausage manufacturing capacity, allowing the company to meet high customer demand for its Hillshire Farm brand products. This USD 83 million expansion will add 15,000 square feet to its 342,000 square foot facility and state-of-the-art equipment to increase production by 50% to better serve customers.April 2023: The makers of the HERDEZ® brand announced the launch of its HERDEZ™ Mexican Refrigerated Entrées line with two delicious varieties, including HERDEZ™ Chicken Shredded in Mild Chipotle Sauce and HERDEZ™ Carnitas Slow Cooked Pork.March 2023: Tyson® brand introduces chicken sandwiches and sliders, bringing restaurant-quality taste to home. The new Tyson Chicken Breast Sandwiches and Sliders are available in Original and Spicy. The new product is available in the frozen snacks section at retailers nationwide.
9. What pricing options are available for accessing the report?
Pricing options include single-user, multi-user, and enterprise licenses priced at USD 3800, USD 4500, and USD 5800 respectively.
10. Is the market size provided in terms of value or volume?
The market size is provided in terms of value, measured in Million.
11. Are there any specific market keywords associated with the report?
Yes, the market keyword associated with the report is "US Processed Meats Industry," which aids in identifying and referencing the specific market segment covered.
12. How do I determine which pricing option suits my needs best?
The pricing options vary based on user requirements and access needs. Individual users may opt for single-user licenses, while businesses requiring broader access may choose multi-user or enterprise licenses for cost-effective access to the report.
13. Are there any additional resources or data provided in the US Processed Meats Industry report?
While the report offers comprehensive insights, it's advisable to review the specific contents or supplementary materials provided to ascertain if additional resources or data are available.
14. How can I stay updated on further developments or reports in the US Processed Meats Industry?
To stay informed about further developments, trends, and reports in the US Processed Meats Industry, consider subscribing to industry newsletters, following relevant companies and organizations, or regularly checking reputable industry news sources and publications.
Methodology
Step 1 - Identification of Relevant Samples Size from Population Database


Step 2 - Approaches for Defining Global Market Size (Value, Volume* & Price*)

Note*: In applicable scenarios
Step 3 - Data Sources
Primary Research
- Web Analytics
- Survey Reports
- Research Institute
- Latest Research Reports
- Opinion Leaders
Secondary Research
- Annual Reports
- White Paper
- Latest Press Release
- Industry Association
- Paid Database
- Investor Presentations

Step 4 - Data Triangulation
Involves using different sources of information in order to increase the validity of a study
These sources are likely to be stakeholders in a program - participants, other researchers, program staff, other community members, and so on.
Then we put all data in single framework & apply various statistical tools to find out the dynamic on the market.
During the analysis stage, feedback from the stakeholder groups would be compared to determine areas of agreement as well as areas of divergence


