
Key Insights
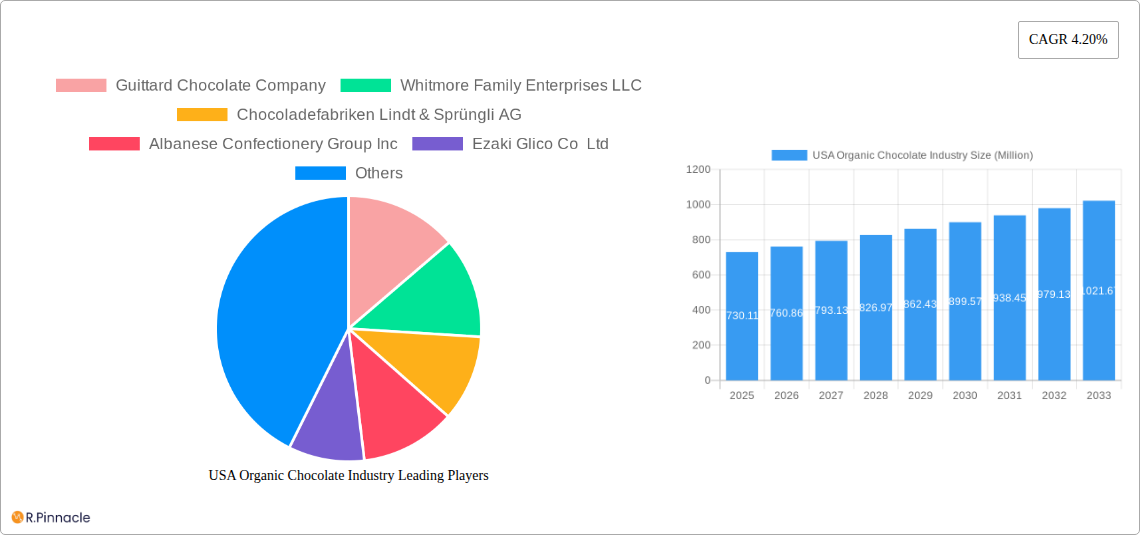
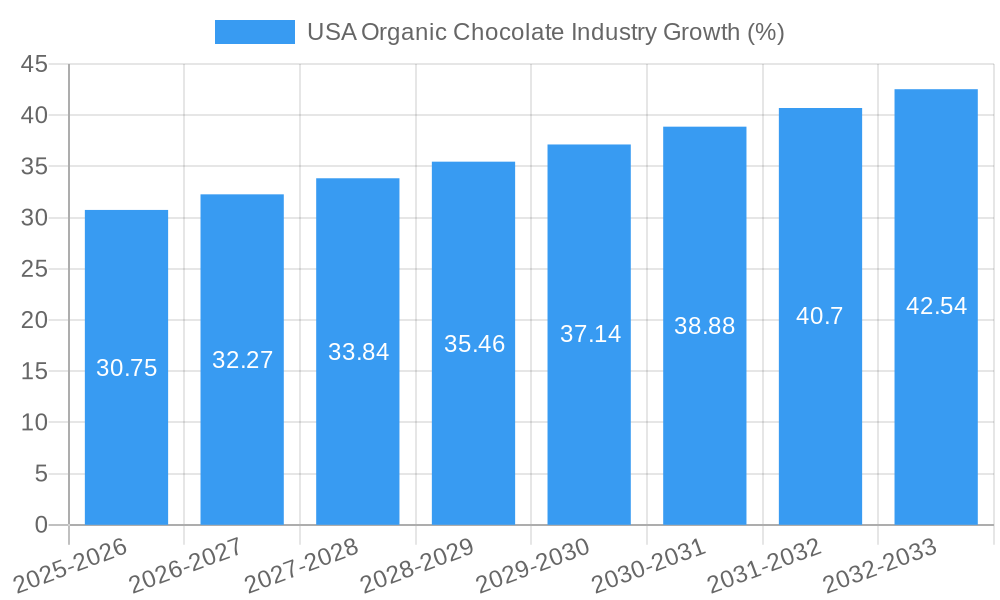
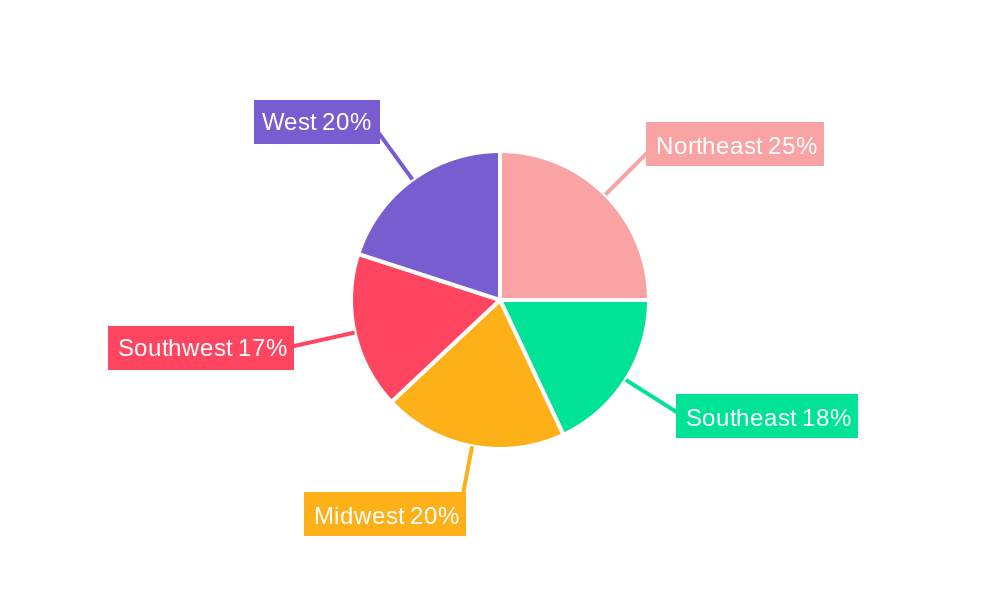
The US organic chocolate market, valued at $730.11 million in 2025, is projected to experience robust growth, driven by increasing consumer demand for healthier and ethically sourced confectionery. The market's Compound Annual Growth Rate (CAGR) of 4.20% from 2025 to 2033 reflects a sustained interest in organic products, aligning with broader health and wellness trends. Key drivers include growing awareness of the health benefits of dark chocolate (rich in antioxidants), increased consumer preference for natural and sustainable ingredients, and a rising disposable income allowing for premium product purchases. The market segmentation reveals a strong preference for dark chocolate variants, indicating a focus on health benefits. Distribution channels are diversified, with supermarkets/hypermarkets holding a significant share, complemented by the growing influence of online retail stores. Competitive landscape analysis suggests that established players like Hershey's, Mars, and Lindt, alongside specialized organic chocolate manufacturers, are actively vying for market share. The Northeast and West regions of the US are likely to lead in market share due to higher concentrations of health-conscious consumers and higher disposable incomes. The market is expected to see further fragmentation with the entry of smaller, niche players focusing on specific flavor profiles or ethical sourcing practices.
The forecast period (2025-2033) anticipates a consistent upward trajectory, although potential restraints, such as fluctuating raw material prices and competition from conventional chocolate manufacturers, warrant consideration. However, the continued focus on sustainability, transparency in supply chains, and the increasing availability of organic chocolate across diverse distribution channels, are likely to mitigate these challenges. The market’s success hinges on the ability of manufacturers to innovate and offer products that cater to evolving consumer preferences, including unique flavor combinations, convenient packaging, and compelling brand narratives highlighting the ethical and sustainable aspects of their operations. Further growth can be achieved by tapping into emerging trends like vegan chocolate and incorporating functional ingredients for enhanced health benefits.
USA Organic Chocolate Industry Report: 2019-2033
This comprehensive report provides an in-depth analysis of the USA organic chocolate industry, offering invaluable insights for industry professionals, investors, and stakeholders. The report covers the period 2019-2033, with a base year of 2025 and a forecast period of 2025-2033. Discover key trends, market dynamics, and future growth opportunities within this thriving sector.
USA Organic Chocolate Industry Market Structure & Innovation Trends
This section analyzes the competitive landscape of the USA organic chocolate market, examining market concentration, innovation drivers, regulatory frameworks, and M&A activities. The market is characterized by a mix of large multinational corporations and smaller, specialized brands. Market share is currently dominated by a few key players, with Mondelēz International Inc., The Hershey Company, and Mars Incorporated holding significant positions. However, smaller, niche organic chocolate makers are also gaining traction, driven by consumer demand for higher quality and ethically sourced products.
- Market Concentration: Highly concentrated at the top, with a long tail of smaller players focusing on niche segments. xx% market share held by the top 3 players in 2025.
- Innovation Drivers: Growing consumer demand for organic and sustainably produced food products, coupled with increasing health consciousness, drives innovation. Premiumization and product diversification are key strategies.
- Regulatory Framework: Stringent regulations regarding organic certification and labeling influence product development and marketing. Compliance costs can be a significant factor.
- Product Substitutes: Other confectionery items, as well as healthier snacks and desserts, compete with organic chocolate.
- End-User Demographics: The primary consumer base is affluent, health-conscious individuals aged 25-55, with a growing segment of younger consumers showing increased interest.
- M&A Activities: The industry has witnessed several mergers and acquisitions in recent years, driven by consolidation and expansion efforts. Estimated M&A deal value in 2024 totalled approximately $xx Million.
USA Organic Chocolate Industry Market Dynamics & Trends
The USA organic chocolate market is experiencing robust growth, fueled by several key factors. Consumer preference for organic and sustainably sourced products is a major driver, alongside the increasing demand for premium and specialty chocolates. The market is also witnessing technological disruptions, with advancements in production methods and packaging enhancing efficiency and sustainability. Competitive dynamics are intense, with both large established players and smaller niche brands vying for market share. The CAGR for the forecast period (2025-2033) is projected to be xx%, with market penetration expected to reach xx% by 2033.
Dominant Regions & Segments in USA Organic Chocolate Industry
The organic chocolate market shows varied growth across different regions and segments. While data on specific regional dominance isn't readily available, California, New York, and other states with a strong focus on organic farming and a significant consumer base for premium food products are likely leaders. Within segments, the following observations can be made:
- Confectionery Variant: Dark chocolate continues to be the most popular segment, driven by its perceived health benefits and intense flavour profile. Milk chocolate holds a significant share, while white chocolate occupies a smaller niche.
- Distribution Channel: Supermarket/hypermarkets remain the dominant distribution channel, followed by online retail stores, reflecting the convenience and accessibility they offer to consumers. Convenience stores represent a smaller but growing segment.
Key Drivers for Dominant Segments:
- Supermarket/Hypermarket: Extensive reach, established supply chains, and promotional opportunities.
- Dark Chocolate: Perceived health benefits (antioxidants), strong flavour, and appeal to sophisticated palates.
USA Organic Chocolate Industry Product Innovations
Recent innovations in the organic chocolate market emphasize sustainability, ethical sourcing, and unique flavour profiles. New product launches focus on clean label ingredients, functional additions (e.g., superfoods), and innovative packaging solutions. Technological advancements in processing and fermentation techniques are improving the quality and taste of organic chocolate. This focus on premiumization and differentiation allows companies to command premium pricing and stand out in a competitive market.
Report Scope & Segmentation Analysis
This report provides a comprehensive segmentation of the USA organic chocolate market, examining various factors impacting its growth.
Confectionery Variant: The market is segmented into Dark Chocolate, Milk Chocolate, and White Chocolate, each demonstrating unique growth projections based on consumer preference.
Distribution Channel: The market is analyzed across Convenience Stores, Online Retail Stores, Supermarket/Hypermarket, and Others, outlining the specific dynamics and growth potential within each channel. Growth projections vary significantly by channel.
Competitive dynamics vary considerably across segments. The large multinational companies generally dominate supermarket/hypermarket channels. Niche brands and smaller players often have stronger presence in online and convenience store channels.
Key Drivers of USA Organic Chocolate Industry Growth
Several factors contribute to the growth of the USA organic chocolate industry. Increasing consumer awareness of health and wellness is a major driver, leading to a preference for natural and organic products. Growing disposable incomes enable consumers to spend more on premium food items. Further growth is fueled by the rising popularity of ethical and sustainable consumption patterns, with consumers increasingly seeking out brands committed to responsible sourcing and environmental sustainability.
Challenges in the USA Organic Chocolate Industry Sector
The organic chocolate industry faces various challenges, including fluctuating raw material prices, particularly cocoa beans. Supply chain disruptions can impact production and distribution, leading to higher costs. Intense competition, with both established players and new entrants vying for market share, creates pressure on pricing and margins. Maintaining consistent organic certification standards across the supply chain adds complexity and cost.
Emerging Opportunities in USA Organic Chocolate Industry
Emerging opportunities in the organic chocolate market include the growth of plant-based and vegan chocolate alternatives. Increasing demand for functional chocolates with added health benefits, such as probiotics or adaptogens, presents another opportunity. The expansion into new distribution channels, such as direct-to-consumer online sales and subscription boxes, allows for enhanced customer engagement and revenue generation.
Leading Players in the USA Organic Chocolate Industry Market
- Guittard Chocolate Company
- Whitmore Family Enterprises LLC
- Chocoladefabriken Lindt & Sprüngli AG
- Albanese Confectionery Group Inc
- Ezaki Glico Co Ltd
- Vosges Haut-Chocolat LLC
- Salmon River Foods Inc
- Ferrero International SA
- TCHO Ventures Inc
- Mars Incorporated
- Yıldız Holding AŞ
- Barry Callebaut AG
- Mast Brothers & Co
- Mondelēz International Inc
- The Hershey Company
Key Developments in USA Organic Chocolate Industry
- September 2022: Mondelēz International Inc. expanded its Green & Black premium organic chocolate brand with the launch of a new range, Smooth, in North America.
- October 2022: Lindt & Sprungli USA launched its first-ever 3D virtual store, enhancing customer engagement.
- November 2022: Yıldız Holding AS' brand GODIVA launched "Holiday Collection Packs" of premium chocolates, capitalizing on seasonal demand.
Future Outlook for USA Organic Chocolate Industry Market
The future of the USA organic chocolate market looks promising, driven by continued growth in consumer demand for premium, ethically sourced, and sustainably produced chocolate. Strategic opportunities exist in product innovation, focusing on unique flavors, functional ingredients, and convenient formats. Expansion into emerging distribution channels and increased emphasis on building brand loyalty will be crucial for success in this competitive market. The market is expected to experience significant growth over the next decade.
USA Organic Chocolate Industry Segmentation
-
1. Confectionery Variant
- 1.1. Dark Chocolate
- 1.2. Milk and White Chocolate
-
2. Distribution Channel
- 2.1. Convenience Store
- 2.2. Online Retail Store
- 2.3. Supermarket/Hypermarket
- 2.4. Others
USA Organic Chocolate Industry Segmentation By Geography
-
1. North America
- 1.1. United States
- 1.2. Canada
- 1.3. Mexico
-
2. South America
- 2.1. Brazil
- 2.2. Argentina
- 2.3. Rest of South America
-
3. Europe
- 3.1. United Kingdom
- 3.2. Germany
- 3.3. France
- 3.4. Italy
- 3.5. Spain
- 3.6. Russia
- 3.7. Benelux
- 3.8. Nordics
- 3.9. Rest of Europe
-
4. Middle East & Africa
- 4.1. Turkey
- 4.2. Israel
- 4.3. GCC
- 4.4. North Africa
- 4.5. South Africa
- 4.6. Rest of Middle East & Africa
-
5. Asia Pacific
- 5.1. China
- 5.2. India
- 5.3. Japan
- 5.4. South Korea
- 5.5. ASEAN
- 5.6. Oceania
- 5.7. Rest of Asia Pacific
USA Organic Chocolate Industry REPORT HIGHLIGHTS
| Aspects | Details |
|---|---|
| Study Period | 2019-2033 |
| Base Year | 2024 |
| Estimated Year | 2025 |
| Forecast Period | 2025-2033 |
| Historical Period | 2019-2024 |
| Growth Rate | CAGR of 4.20% from 2019-2033 |
| Segmentation |
|
Table of Contents
- 1. Introduction
- 1.1. Research Scope
- 1.2. Market Segmentation
- 1.3. Research Methodology
- 1.4. Definitions and Assumptions
- 2. Executive Summary
- 2.1. Introduction
- 3. Market Dynamics
- 3.1. Introduction
- 3.2. Market Drivers
- 3.2.1. Escalating Demand for Processed Poultry Products; Favorable Government Initiatives to Boost Production
- 3.3. Market Restrains
- 3.3.1. Rising Vegan Trend among Young Consumers; Deeper Penetration of Red Meat Across Saudi Arabia
- 3.4. Market Trends
- 3.4.1. OTHER KEY INDUSTRY TRENDS COVERED IN THE REPORT
- 4. Market Factor Analysis
- 4.1. Porters Five Forces
- 4.2. Supply/Value Chain
- 4.3. PESTEL analysis
- 4.4. Market Entropy
- 4.5. Patent/Trademark Analysis
- 5. Global USA Organic Chocolate Industry Analysis, Insights and Forecast, 2019-2031
- 5.1. Market Analysis, Insights and Forecast - by Confectionery Variant
- 5.1.1. Dark Chocolate
- 5.1.2. Milk and White Chocolate
- 5.2. Market Analysis, Insights and Forecast - by Distribution Channel
- 5.2.1. Convenience Store
- 5.2.2. Online Retail Store
- 5.2.3. Supermarket/Hypermarket
- 5.2.4. Others
- 5.3. Market Analysis, Insights and Forecast - by Region
- 5.3.1. North America
- 5.3.2. South America
- 5.3.3. Europe
- 5.3.4. Middle East & Africa
- 5.3.5. Asia Pacific
- 5.1. Market Analysis, Insights and Forecast - by Confectionery Variant
- 6. North America USA Organic Chocolate Industry Analysis, Insights and Forecast, 2019-2031
- 6.1. Market Analysis, Insights and Forecast - by Confectionery Variant
- 6.1.1. Dark Chocolate
- 6.1.2. Milk and White Chocolate
- 6.2. Market Analysis, Insights and Forecast - by Distribution Channel
- 6.2.1. Convenience Store
- 6.2.2. Online Retail Store
- 6.2.3. Supermarket/Hypermarket
- 6.2.4. Others
- 6.1. Market Analysis, Insights and Forecast - by Confectionery Variant
- 7. South America USA Organic Chocolate Industry Analysis, Insights and Forecast, 2019-2031
- 7.1. Market Analysis, Insights and Forecast - by Confectionery Variant
- 7.1.1. Dark Chocolate
- 7.1.2. Milk and White Chocolate
- 7.2. Market Analysis, Insights and Forecast - by Distribution Channel
- 7.2.1. Convenience Store
- 7.2.2. Online Retail Store
- 7.2.3. Supermarket/Hypermarket
- 7.2.4. Others
- 7.1. Market Analysis, Insights and Forecast - by Confectionery Variant
- 8. Europe USA Organic Chocolate Industry Analysis, Insights and Forecast, 2019-2031
- 8.1. Market Analysis, Insights and Forecast - by Confectionery Variant
- 8.1.1. Dark Chocolate
- 8.1.2. Milk and White Chocolate
- 8.2. Market Analysis, Insights and Forecast - by Distribution Channel
- 8.2.1. Convenience Store
- 8.2.2. Online Retail Store
- 8.2.3. Supermarket/Hypermarket
- 8.2.4. Others
- 8.1. Market Analysis, Insights and Forecast - by Confectionery Variant
- 9. Middle East & Africa USA Organic Chocolate Industry Analysis, Insights and Forecast, 2019-2031
- 9.1. Market Analysis, Insights and Forecast - by Confectionery Variant
- 9.1.1. Dark Chocolate
- 9.1.2. Milk and White Chocolate
- 9.2. Market Analysis, Insights and Forecast - by Distribution Channel
- 9.2.1. Convenience Store
- 9.2.2. Online Retail Store
- 9.2.3. Supermarket/Hypermarket
- 9.2.4. Others
- 9.1. Market Analysis, Insights and Forecast - by Confectionery Variant
- 10. Asia Pacific USA Organic Chocolate Industry Analysis, Insights and Forecast, 2019-2031
- 10.1. Market Analysis, Insights and Forecast - by Confectionery Variant
- 10.1.1. Dark Chocolate
- 10.1.2. Milk and White Chocolate
- 10.2. Market Analysis, Insights and Forecast - by Distribution Channel
- 10.2.1. Convenience Store
- 10.2.2. Online Retail Store
- 10.2.3. Supermarket/Hypermarket
- 10.2.4. Others
- 10.1. Market Analysis, Insights and Forecast - by Confectionery Variant
- 11. Northeast USA Organic Chocolate Industry Analysis, Insights and Forecast, 2019-2031
- 12. Southeast USA Organic Chocolate Industry Analysis, Insights and Forecast, 2019-2031
- 13. Midwest USA Organic Chocolate Industry Analysis, Insights and Forecast, 2019-2031
- 14. Southwest USA Organic Chocolate Industry Analysis, Insights and Forecast, 2019-2031
- 15. West USA Organic Chocolate Industry Analysis, Insights and Forecast, 2019-2031
- 16. Competitive Analysis
- 16.1. Global Market Share Analysis 2024
- 16.2. Company Profiles
- 16.2.1 Guittard Chocolate Company
- 16.2.1.1. Overview
- 16.2.1.2. Products
- 16.2.1.3. SWOT Analysis
- 16.2.1.4. Recent Developments
- 16.2.1.5. Financials (Based on Availability)
- 16.2.2 Whitmore Family Enterprises LLC
- 16.2.2.1. Overview
- 16.2.2.2. Products
- 16.2.2.3. SWOT Analysis
- 16.2.2.4. Recent Developments
- 16.2.2.5. Financials (Based on Availability)
- 16.2.3 Chocoladefabriken Lindt & Sprüngli AG
- 16.2.3.1. Overview
- 16.2.3.2. Products
- 16.2.3.3. SWOT Analysis
- 16.2.3.4. Recent Developments
- 16.2.3.5. Financials (Based on Availability)
- 16.2.4 Albanese Confectionery Group Inc
- 16.2.4.1. Overview
- 16.2.4.2. Products
- 16.2.4.3. SWOT Analysis
- 16.2.4.4. Recent Developments
- 16.2.4.5. Financials (Based on Availability)
- 16.2.5 Ezaki Glico Co Ltd
- 16.2.5.1. Overview
- 16.2.5.2. Products
- 16.2.5.3. SWOT Analysis
- 16.2.5.4. Recent Developments
- 16.2.5.5. Financials (Based on Availability)
- 16.2.6 Vosges Haut-Chocolat LLC
- 16.2.6.1. Overview
- 16.2.6.2. Products
- 16.2.6.3. SWOT Analysis
- 16.2.6.4. Recent Developments
- 16.2.6.5. Financials (Based on Availability)
- 16.2.7 Salmon River Foods Inc
- 16.2.7.1. Overview
- 16.2.7.2. Products
- 16.2.7.3. SWOT Analysis
- 16.2.7.4. Recent Developments
- 16.2.7.5. Financials (Based on Availability)
- 16.2.8 Ferrero International SA
- 16.2.8.1. Overview
- 16.2.8.2. Products
- 16.2.8.3. SWOT Analysis
- 16.2.8.4. Recent Developments
- 16.2.8.5. Financials (Based on Availability)
- 16.2.9 TCHO Ventures Inc
- 16.2.9.1. Overview
- 16.2.9.2. Products
- 16.2.9.3. SWOT Analysis
- 16.2.9.4. Recent Developments
- 16.2.9.5. Financials (Based on Availability)
- 16.2.10 Mars Incorporated
- 16.2.10.1. Overview
- 16.2.10.2. Products
- 16.2.10.3. SWOT Analysis
- 16.2.10.4. Recent Developments
- 16.2.10.5. Financials (Based on Availability)
- 16.2.11 Yıldız Holding A
- 16.2.11.1. Overview
- 16.2.11.2. Products
- 16.2.11.3. SWOT Analysis
- 16.2.11.4. Recent Developments
- 16.2.11.5. Financials (Based on Availability)
- 16.2.12 Barry Callebaut AG
- 16.2.12.1. Overview
- 16.2.12.2. Products
- 16.2.12.3. SWOT Analysis
- 16.2.12.4. Recent Developments
- 16.2.12.5. Financials (Based on Availability)
- 16.2.13 Mast Brothers & Co
- 16.2.13.1. Overview
- 16.2.13.2. Products
- 16.2.13.3. SWOT Analysis
- 16.2.13.4. Recent Developments
- 16.2.13.5. Financials (Based on Availability)
- 16.2.14 Mondelēz International Inc
- 16.2.14.1. Overview
- 16.2.14.2. Products
- 16.2.14.3. SWOT Analysis
- 16.2.14.4. Recent Developments
- 16.2.14.5. Financials (Based on Availability)
- 16.2.15 The Hershey Company
- 16.2.15.1. Overview
- 16.2.15.2. Products
- 16.2.15.3. SWOT Analysis
- 16.2.15.4. Recent Developments
- 16.2.15.5. Financials (Based on Availability)
- 16.2.1 Guittard Chocolate Company
List of Figures
- Figure 1: Global USA Organic Chocolate Industry Revenue Breakdown (Million, %) by Region 2024 & 2032
- Figure 2: Global USA Organic Chocolate Industry Volume Breakdown (Tons, %) by Region 2024 & 2032
- Figure 3: United states USA Organic Chocolate Industry Revenue (Million), by Country 2024 & 2032
- Figure 4: United states USA Organic Chocolate Industry Volume (Tons), by Country 2024 & 2032
- Figure 5: United states USA Organic Chocolate Industry Revenue Share (%), by Country 2024 & 2032
- Figure 6: United states USA Organic Chocolate Industry Volume Share (%), by Country 2024 & 2032
- Figure 7: North America USA Organic Chocolate Industry Revenue (Million), by Confectionery Variant 2024 & 2032
- Figure 8: North America USA Organic Chocolate Industry Volume (Tons), by Confectionery Variant 2024 & 2032
- Figure 9: North America USA Organic Chocolate Industry Revenue Share (%), by Confectionery Variant 2024 & 2032
- Figure 10: North America USA Organic Chocolate Industry Volume Share (%), by Confectionery Variant 2024 & 2032
- Figure 11: North America USA Organic Chocolate Industry Revenue (Million), by Distribution Channel 2024 & 2032
- Figure 12: North America USA Organic Chocolate Industry Volume (Tons), by Distribution Channel 2024 & 2032
- Figure 13: North America USA Organic Chocolate Industry Revenue Share (%), by Distribution Channel 2024 & 2032
- Figure 14: North America USA Organic Chocolate Industry Volume Share (%), by Distribution Channel 2024 & 2032
- Figure 15: North America USA Organic Chocolate Industry Revenue (Million), by Country 2024 & 2032
- Figure 16: North America USA Organic Chocolate Industry Volume (Tons), by Country 2024 & 2032
- Figure 17: North America USA Organic Chocolate Industry Revenue Share (%), by Country 2024 & 2032
- Figure 18: North America USA Organic Chocolate Industry Volume Share (%), by Country 2024 & 2032
- Figure 19: South America USA Organic Chocolate Industry Revenue (Million), by Confectionery Variant 2024 & 2032
- Figure 20: South America USA Organic Chocolate Industry Volume (Tons), by Confectionery Variant 2024 & 2032
- Figure 21: South America USA Organic Chocolate Industry Revenue Share (%), by Confectionery Variant 2024 & 2032
- Figure 22: South America USA Organic Chocolate Industry Volume Share (%), by Confectionery Variant 2024 & 2032
- Figure 23: South America USA Organic Chocolate Industry Revenue (Million), by Distribution Channel 2024 & 2032
- Figure 24: South America USA Organic Chocolate Industry Volume (Tons), by Distribution Channel 2024 & 2032
- Figure 25: South America USA Organic Chocolate Industry Revenue Share (%), by Distribution Channel 2024 & 2032
- Figure 26: South America USA Organic Chocolate Industry Volume Share (%), by Distribution Channel 2024 & 2032
- Figure 27: South America USA Organic Chocolate Industry Revenue (Million), by Country 2024 & 2032
- Figure 28: South America USA Organic Chocolate Industry Volume (Tons), by Country 2024 & 2032
- Figure 29: South America USA Organic Chocolate Industry Revenue Share (%), by Country 2024 & 2032
- Figure 30: South America USA Organic Chocolate Industry Volume Share (%), by Country 2024 & 2032
- Figure 31: Europe USA Organic Chocolate Industry Revenue (Million), by Confectionery Variant 2024 & 2032
- Figure 32: Europe USA Organic Chocolate Industry Volume (Tons), by Confectionery Variant 2024 & 2032
- Figure 33: Europe USA Organic Chocolate Industry Revenue Share (%), by Confectionery Variant 2024 & 2032
- Figure 34: Europe USA Organic Chocolate Industry Volume Share (%), by Confectionery Variant 2024 & 2032
- Figure 35: Europe USA Organic Chocolate Industry Revenue (Million), by Distribution Channel 2024 & 2032
- Figure 36: Europe USA Organic Chocolate Industry Volume (Tons), by Distribution Channel 2024 & 2032
- Figure 37: Europe USA Organic Chocolate Industry Revenue Share (%), by Distribution Channel 2024 & 2032
- Figure 38: Europe USA Organic Chocolate Industry Volume Share (%), by Distribution Channel 2024 & 2032
- Figure 39: Europe USA Organic Chocolate Industry Revenue (Million), by Country 2024 & 2032
- Figure 40: Europe USA Organic Chocolate Industry Volume (Tons), by Country 2024 & 2032
- Figure 41: Europe USA Organic Chocolate Industry Revenue Share (%), by Country 2024 & 2032
- Figure 42: Europe USA Organic Chocolate Industry Volume Share (%), by Country 2024 & 2032
- Figure 43: Middle East & Africa USA Organic Chocolate Industry Revenue (Million), by Confectionery Variant 2024 & 2032
- Figure 44: Middle East & Africa USA Organic Chocolate Industry Volume (Tons), by Confectionery Variant 2024 & 2032
- Figure 45: Middle East & Africa USA Organic Chocolate Industry Revenue Share (%), by Confectionery Variant 2024 & 2032
- Figure 46: Middle East & Africa USA Organic Chocolate Industry Volume Share (%), by Confectionery Variant 2024 & 2032
- Figure 47: Middle East & Africa USA Organic Chocolate Industry Revenue (Million), by Distribution Channel 2024 & 2032
- Figure 48: Middle East & Africa USA Organic Chocolate Industry Volume (Tons), by Distribution Channel 2024 & 2032
- Figure 49: Middle East & Africa USA Organic Chocolate Industry Revenue Share (%), by Distribution Channel 2024 & 2032
- Figure 50: Middle East & Africa USA Organic Chocolate Industry Volume Share (%), by Distribution Channel 2024 & 2032
- Figure 51: Middle East & Africa USA Organic Chocolate Industry Revenue (Million), by Country 2024 & 2032
- Figure 52: Middle East & Africa USA Organic Chocolate Industry Volume (Tons), by Country 2024 & 2032
- Figure 53: Middle East & Africa USA Organic Chocolate Industry Revenue Share (%), by Country 2024 & 2032
- Figure 54: Middle East & Africa USA Organic Chocolate Industry Volume Share (%), by Country 2024 & 2032
- Figure 55: Asia Pacific USA Organic Chocolate Industry Revenue (Million), by Confectionery Variant 2024 & 2032
- Figure 56: Asia Pacific USA Organic Chocolate Industry Volume (Tons), by Confectionery Variant 2024 & 2032
- Figure 57: Asia Pacific USA Organic Chocolate Industry Revenue Share (%), by Confectionery Variant 2024 & 2032
- Figure 58: Asia Pacific USA Organic Chocolate Industry Volume Share (%), by Confectionery Variant 2024 & 2032
- Figure 59: Asia Pacific USA Organic Chocolate Industry Revenue (Million), by Distribution Channel 2024 & 2032
- Figure 60: Asia Pacific USA Organic Chocolate Industry Volume (Tons), by Distribution Channel 2024 & 2032
- Figure 61: Asia Pacific USA Organic Chocolate Industry Revenue Share (%), by Distribution Channel 2024 & 2032
- Figure 62: Asia Pacific USA Organic Chocolate Industry Volume Share (%), by Distribution Channel 2024 & 2032
- Figure 63: Asia Pacific USA Organic Chocolate Industry Revenue (Million), by Country 2024 & 2032
- Figure 64: Asia Pacific USA Organic Chocolate Industry Volume (Tons), by Country 2024 & 2032
- Figure 65: Asia Pacific USA Organic Chocolate Industry Revenue Share (%), by Country 2024 & 2032
- Figure 66: Asia Pacific USA Organic Chocolate Industry Volume Share (%), by Country 2024 & 2032
List of Tables
- Table 1: Global USA Organic Chocolate Industry Revenue Million Forecast, by Region 2019 & 2032
- Table 2: Global USA Organic Chocolate Industry Volume Tons Forecast, by Region 2019 & 2032
- Table 3: Global USA Organic Chocolate Industry Revenue Million Forecast, by Confectionery Variant 2019 & 2032
- Table 4: Global USA Organic Chocolate Industry Volume Tons Forecast, by Confectionery Variant 2019 & 2032
- Table 5: Global USA Organic Chocolate Industry Revenue Million Forecast, by Distribution Channel 2019 & 2032
- Table 6: Global USA Organic Chocolate Industry Volume Tons Forecast, by Distribution Channel 2019 & 2032
- Table 7: Global USA Organic Chocolate Industry Revenue Million Forecast, by Region 2019 & 2032
- Table 8: Global USA Organic Chocolate Industry Volume Tons Forecast, by Region 2019 & 2032
- Table 9: Global USA Organic Chocolate Industry Revenue Million Forecast, by Country 2019 & 2032
- Table 10: Global USA Organic Chocolate Industry Volume Tons Forecast, by Country 2019 & 2032
- Table 11: Northeast USA Organic Chocolate Industry Revenue (Million) Forecast, by Application 2019 & 2032
- Table 12: Northeast USA Organic Chocolate Industry Volume (Tons) Forecast, by Application 2019 & 2032
- Table 13: Southeast USA Organic Chocolate Industry Revenue (Million) Forecast, by Application 2019 & 2032
- Table 14: Southeast USA Organic Chocolate Industry Volume (Tons) Forecast, by Application 2019 & 2032
- Table 15: Midwest USA Organic Chocolate Industry Revenue (Million) Forecast, by Application 2019 & 2032
- Table 16: Midwest USA Organic Chocolate Industry Volume (Tons) Forecast, by Application 2019 & 2032
- Table 17: Southwest USA Organic Chocolate Industry Revenue (Million) Forecast, by Application 2019 & 2032
- Table 18: Southwest USA Organic Chocolate Industry Volume (Tons) Forecast, by Application 2019 & 2032
- Table 19: West USA Organic Chocolate Industry Revenue (Million) Forecast, by Application 2019 & 2032
- Table 20: West USA Organic Chocolate Industry Volume (Tons) Forecast, by Application 2019 & 2032
- Table 21: Global USA Organic Chocolate Industry Revenue Million Forecast, by Confectionery Variant 2019 & 2032
- Table 22: Global USA Organic Chocolate Industry Volume Tons Forecast, by Confectionery Variant 2019 & 2032
- Table 23: Global USA Organic Chocolate Industry Revenue Million Forecast, by Distribution Channel 2019 & 2032
- Table 24: Global USA Organic Chocolate Industry Volume Tons Forecast, by Distribution Channel 2019 & 2032
- Table 25: Global USA Organic Chocolate Industry Revenue Million Forecast, by Country 2019 & 2032
- Table 26: Global USA Organic Chocolate Industry Volume Tons Forecast, by Country 2019 & 2032
- Table 27: United States USA Organic Chocolate Industry Revenue (Million) Forecast, by Application 2019 & 2032
- Table 28: United States USA Organic Chocolate Industry Volume (Tons) Forecast, by Application 2019 & 2032
- Table 29: Canada USA Organic Chocolate Industry Revenue (Million) Forecast, by Application 2019 & 2032
- Table 30: Canada USA Organic Chocolate Industry Volume (Tons) Forecast, by Application 2019 & 2032
- Table 31: Mexico USA Organic Chocolate Industry Revenue (Million) Forecast, by Application 2019 & 2032
- Table 32: Mexico USA Organic Chocolate Industry Volume (Tons) Forecast, by Application 2019 & 2032
- Table 33: Global USA Organic Chocolate Industry Revenue Million Forecast, by Confectionery Variant 2019 & 2032
- Table 34: Global USA Organic Chocolate Industry Volume Tons Forecast, by Confectionery Variant 2019 & 2032
- Table 35: Global USA Organic Chocolate Industry Revenue Million Forecast, by Distribution Channel 2019 & 2032
- Table 36: Global USA Organic Chocolate Industry Volume Tons Forecast, by Distribution Channel 2019 & 2032
- Table 37: Global USA Organic Chocolate Industry Revenue Million Forecast, by Country 2019 & 2032
- Table 38: Global USA Organic Chocolate Industry Volume Tons Forecast, by Country 2019 & 2032
- Table 39: Brazil USA Organic Chocolate Industry Revenue (Million) Forecast, by Application 2019 & 2032
- Table 40: Brazil USA Organic Chocolate Industry Volume (Tons) Forecast, by Application 2019 & 2032
- Table 41: Argentina USA Organic Chocolate Industry Revenue (Million) Forecast, by Application 2019 & 2032
- Table 42: Argentina USA Organic Chocolate Industry Volume (Tons) Forecast, by Application 2019 & 2032
- Table 43: Rest of South America USA Organic Chocolate Industry Revenue (Million) Forecast, by Application 2019 & 2032
- Table 44: Rest of South America USA Organic Chocolate Industry Volume (Tons) Forecast, by Application 2019 & 2032
- Table 45: Global USA Organic Chocolate Industry Revenue Million Forecast, by Confectionery Variant 2019 & 2032
- Table 46: Global USA Organic Chocolate Industry Volume Tons Forecast, by Confectionery Variant 2019 & 2032
- Table 47: Global USA Organic Chocolate Industry Revenue Million Forecast, by Distribution Channel 2019 & 2032
- Table 48: Global USA Organic Chocolate Industry Volume Tons Forecast, by Distribution Channel 2019 & 2032
- Table 49: Global USA Organic Chocolate Industry Revenue Million Forecast, by Country 2019 & 2032
- Table 50: Global USA Organic Chocolate Industry Volume Tons Forecast, by Country 2019 & 2032
- Table 51: United Kingdom USA Organic Chocolate Industry Revenue (Million) Forecast, by Application 2019 & 2032
- Table 52: United Kingdom USA Organic Chocolate Industry Volume (Tons) Forecast, by Application 2019 & 2032
- Table 53: Germany USA Organic Chocolate Industry Revenue (Million) Forecast, by Application 2019 & 2032
- Table 54: Germany USA Organic Chocolate Industry Volume (Tons) Forecast, by Application 2019 & 2032
- Table 55: France USA Organic Chocolate Industry Revenue (Million) Forecast, by Application 2019 & 2032
- Table 56: France USA Organic Chocolate Industry Volume (Tons) Forecast, by Application 2019 & 2032
- Table 57: Italy USA Organic Chocolate Industry Revenue (Million) Forecast, by Application 2019 & 2032
- Table 58: Italy USA Organic Chocolate Industry Volume (Tons) Forecast, by Application 2019 & 2032
- Table 59: Spain USA Organic Chocolate Industry Revenue (Million) Forecast, by Application 2019 & 2032
- Table 60: Spain USA Organic Chocolate Industry Volume (Tons) Forecast, by Application 2019 & 2032
- Table 61: Russia USA Organic Chocolate Industry Revenue (Million) Forecast, by Application 2019 & 2032
- Table 62: Russia USA Organic Chocolate Industry Volume (Tons) Forecast, by Application 2019 & 2032
- Table 63: Benelux USA Organic Chocolate Industry Revenue (Million) Forecast, by Application 2019 & 2032
- Table 64: Benelux USA Organic Chocolate Industry Volume (Tons) Forecast, by Application 2019 & 2032
- Table 65: Nordics USA Organic Chocolate Industry Revenue (Million) Forecast, by Application 2019 & 2032
- Table 66: Nordics USA Organic Chocolate Industry Volume (Tons) Forecast, by Application 2019 & 2032
- Table 67: Rest of Europe USA Organic Chocolate Industry Revenue (Million) Forecast, by Application 2019 & 2032
- Table 68: Rest of Europe USA Organic Chocolate Industry Volume (Tons) Forecast, by Application 2019 & 2032
- Table 69: Global USA Organic Chocolate Industry Revenue Million Forecast, by Confectionery Variant 2019 & 2032
- Table 70: Global USA Organic Chocolate Industry Volume Tons Forecast, by Confectionery Variant 2019 & 2032
- Table 71: Global USA Organic Chocolate Industry Revenue Million Forecast, by Distribution Channel 2019 & 2032
- Table 72: Global USA Organic Chocolate Industry Volume Tons Forecast, by Distribution Channel 2019 & 2032
- Table 73: Global USA Organic Chocolate Industry Revenue Million Forecast, by Country 2019 & 2032
- Table 74: Global USA Organic Chocolate Industry Volume Tons Forecast, by Country 2019 & 2032
- Table 75: Turkey USA Organic Chocolate Industry Revenue (Million) Forecast, by Application 2019 & 2032
- Table 76: Turkey USA Organic Chocolate Industry Volume (Tons) Forecast, by Application 2019 & 2032
- Table 77: Israel USA Organic Chocolate Industry Revenue (Million) Forecast, by Application 2019 & 2032
- Table 78: Israel USA Organic Chocolate Industry Volume (Tons) Forecast, by Application 2019 & 2032
- Table 79: GCC USA Organic Chocolate Industry Revenue (Million) Forecast, by Application 2019 & 2032
- Table 80: GCC USA Organic Chocolate Industry Volume (Tons) Forecast, by Application 2019 & 2032
- Table 81: North Africa USA Organic Chocolate Industry Revenue (Million) Forecast, by Application 2019 & 2032
- Table 82: North Africa USA Organic Chocolate Industry Volume (Tons) Forecast, by Application 2019 & 2032
- Table 83: South Africa USA Organic Chocolate Industry Revenue (Million) Forecast, by Application 2019 & 2032
- Table 84: South Africa USA Organic Chocolate Industry Volume (Tons) Forecast, by Application 2019 & 2032
- Table 85: Rest of Middle East & Africa USA Organic Chocolate Industry Revenue (Million) Forecast, by Application 2019 & 2032
- Table 86: Rest of Middle East & Africa USA Organic Chocolate Industry Volume (Tons) Forecast, by Application 2019 & 2032
- Table 87: Global USA Organic Chocolate Industry Revenue Million Forecast, by Confectionery Variant 2019 & 2032
- Table 88: Global USA Organic Chocolate Industry Volume Tons Forecast, by Confectionery Variant 2019 & 2032
- Table 89: Global USA Organic Chocolate Industry Revenue Million Forecast, by Distribution Channel 2019 & 2032
- Table 90: Global USA Organic Chocolate Industry Volume Tons Forecast, by Distribution Channel 2019 & 2032
- Table 91: Global USA Organic Chocolate Industry Revenue Million Forecast, by Country 2019 & 2032
- Table 92: Global USA Organic Chocolate Industry Volume Tons Forecast, by Country 2019 & 2032
- Table 93: China USA Organic Chocolate Industry Revenue (Million) Forecast, by Application 2019 & 2032
- Table 94: China USA Organic Chocolate Industry Volume (Tons) Forecast, by Application 2019 & 2032
- Table 95: India USA Organic Chocolate Industry Revenue (Million) Forecast, by Application 2019 & 2032
- Table 96: India USA Organic Chocolate Industry Volume (Tons) Forecast, by Application 2019 & 2032
- Table 97: Japan USA Organic Chocolate Industry Revenue (Million) Forecast, by Application 2019 & 2032
- Table 98: Japan USA Organic Chocolate Industry Volume (Tons) Forecast, by Application 2019 & 2032
- Table 99: South Korea USA Organic Chocolate Industry Revenue (Million) Forecast, by Application 2019 & 2032
- Table 100: South Korea USA Organic Chocolate Industry Volume (Tons) Forecast, by Application 2019 & 2032
- Table 101: ASEAN USA Organic Chocolate Industry Revenue (Million) Forecast, by Application 2019 & 2032
- Table 102: ASEAN USA Organic Chocolate Industry Volume (Tons) Forecast, by Application 2019 & 2032
- Table 103: Oceania USA Organic Chocolate Industry Revenue (Million) Forecast, by Application 2019 & 2032
- Table 104: Oceania USA Organic Chocolate Industry Volume (Tons) Forecast, by Application 2019 & 2032
- Table 105: Rest of Asia Pacific USA Organic Chocolate Industry Revenue (Million) Forecast, by Application 2019 & 2032
- Table 106: Rest of Asia Pacific USA Organic Chocolate Industry Volume (Tons) Forecast, by Application 2019 & 2032
Frequently Asked Questions
1. What is the projected Compound Annual Growth Rate (CAGR) of the USA Organic Chocolate Industry?
The projected CAGR is approximately 4.20%.
2. Which companies are prominent players in the USA Organic Chocolate Industry?
Key companies in the market include Guittard Chocolate Company, Whitmore Family Enterprises LLC, Chocoladefabriken Lindt & Sprüngli AG, Albanese Confectionery Group Inc, Ezaki Glico Co Ltd, Vosges Haut-Chocolat LLC, Salmon River Foods Inc, Ferrero International SA, TCHO Ventures Inc, Mars Incorporated, Yıldız Holding A, Barry Callebaut AG, Mast Brothers & Co, Mondelēz International Inc, The Hershey Company.
3. What are the main segments of the USA Organic Chocolate Industry?
The market segments include Confectionery Variant, Distribution Channel.
4. Can you provide details about the market size?
The market size is estimated to be USD 730.11 Million as of 2022.
5. What are some drivers contributing to market growth?
Escalating Demand for Processed Poultry Products; Favorable Government Initiatives to Boost Production.
6. What are the notable trends driving market growth?
OTHER KEY INDUSTRY TRENDS COVERED IN THE REPORT.
7. Are there any restraints impacting market growth?
Rising Vegan Trend among Young Consumers; Deeper Penetration of Red Meat Across Saudi Arabia.
8. Can you provide examples of recent developments in the market?
November 2022: Yıldız Holding AS' brand GODIVA launched "Holiday Collection Packs" of premium chocolates. The chocolate packs include Milk Chocolate Praline Heart, Midnight Swirl, and White Chocolate Raspberry Star.October 2022: Lindt & Sprungli USA launched its first-ever 3D virtual store. Lindt's new online storefront allows consumers across the country to engage in the enchanting brand experience of a Lindt Chocolate store from the comfort of their homes or even on the go.September 2022: Mondelēz International Inc. expanded its Green & Black premium organic chocolate brand with the launch of a new range, Smooth, in North America.
9. What pricing options are available for accessing the report?
Pricing options include single-user, multi-user, and enterprise licenses priced at USD 3800, USD 4500, and USD 5800 respectively.
10. Is the market size provided in terms of value or volume?
The market size is provided in terms of value, measured in Million and volume, measured in Tons.
11. Are there any specific market keywords associated with the report?
Yes, the market keyword associated with the report is "USA Organic Chocolate Industry," which aids in identifying and referencing the specific market segment covered.
12. How do I determine which pricing option suits my needs best?
The pricing options vary based on user requirements and access needs. Individual users may opt for single-user licenses, while businesses requiring broader access may choose multi-user or enterprise licenses for cost-effective access to the report.
13. Are there any additional resources or data provided in the USA Organic Chocolate Industry report?
While the report offers comprehensive insights, it's advisable to review the specific contents or supplementary materials provided to ascertain if additional resources or data are available.
14. How can I stay updated on further developments or reports in the USA Organic Chocolate Industry?
To stay informed about further developments, trends, and reports in the USA Organic Chocolate Industry, consider subscribing to industry newsletters, following relevant companies and organizations, or regularly checking reputable industry news sources and publications.
Methodology
Step 1 - Identification of Relevant Samples Size from Population Database


Step 2 - Approaches for Defining Global Market Size (Value, Volume* & Price*)

Note*: In applicable scenarios
Step 3 - Data Sources
Primary Research
- Web Analytics
- Survey Reports
- Research Institute
- Latest Research Reports
- Opinion Leaders
Secondary Research
- Annual Reports
- White Paper
- Latest Press Release
- Industry Association
- Paid Database
- Investor Presentations

Step 4 - Data Triangulation
Involves using different sources of information in order to increase the validity of a study
These sources are likely to be stakeholders in a program - participants, other researchers, program staff, other community members, and so on.
Then we put all data in single framework & apply various statistical tools to find out the dynamic on the market.
During the analysis stage, feedback from the stakeholder groups would be compared to determine areas of agreement as well as areas of divergence


